GLAUCOMA
Repeatability of nerve fiber layer thickness measurements
in patients with glaucoma and without glaucoma
using spectral-domain and time-domain OCT
Marc Töteberg-Harms&Veit Sturm&Pascal B. Knecht&
Jens Funk&Marcel N. Menke
Received: 12 January 2011 / Revised: 16 August 2011 / Accepted: 19 August 2011 / Published online: 10 September 2011 # Springer-Verlag 2011
Abstract
Background The aim of this work is to assess the repeatability of spectral-domain-OCT (SD-OCT) retinal nerve fiber layer thickness (RNFL) thickness measurements in a non-glaucoma group and patients with glaucoma and to compare these results to conventional time-domain-OCT (TD-OCT).
Methods In a prospective, comparative, observational case-control study, 50 eyes of 25 non-glaucoma and 22 eyes of 11 patients with primary open angle glaucoma (POAG) were included. SD-OCT and TD-OCT circle scans were centered on the optic disc. In each eye, OCT scans were performed three times by two independent observers. RNFL thickness was measured in four quadrants around the optic disc. In addition, the overall mean RNFL thickness was assessed. Intraclass correlation coefficients (ICC) and coefficients of variation (COV) were calculated. Inter-observer and inter-OCT repeatability was visualized by using Bland–Altman analysis.
Results Intra-observer repeatability for TD- OCT was good with an ICCmean RNFL thickness of 0.939 in non-glaucomas
and 0.980 in glaucomatous eyes. For SD-OCT, intra-observer repeatability was higher with an ICC of 0.989
for non-glaucomas and 0.997 for glaucomatous eyes. COVs for TD-OCT ranged from 2.9–7.7% in non-glaucomas and from 6.0–13.3% in glaucoma patients. COVs for SD-OCT ranged from 0.3–1% in non-glaucomas and from 0.9–2.3% in glaucomatous eyes. COVs were influenced by various factors. In the glaucoma group, COVs were significantly higher (p<0.001) compared to the non-glaucoma group. COVs increased by a mean of 5.1% when TD-OCT was used instead of SD-OCT (p<0.001).
Conclusions SD-OCT RNFL thickness measurements in healthy volunteers and glaucoma patients showed good intra- and inter-observer repeatability. Especially in glau-comatous eyes, repeatability of SD-OCT was superior to TD-OCT.
Keywords Retinal nerve fiber layer thickness . Optical coherence tomography . OCT . Spectral-domain OCT . Time-domain OCT . Glaucoma
Introduction
Evaluation of the retinal nerve fiber layer (RNFL) is fundamental for diagnosing and managing glaucoma and other optic neuropathies [1–4]. Scanning laser ophthalmos-copy and scanning laser polarimetry were the first instru-ments to allow objective and quantitative evaluation of the RNFL and the optic disc [5].
Optical coherence tomography (OCT) was first intro-duced in 1995 as an imaging technique for glaucoma diagnosis [6]. Previous studies investigated the repeatability of time-domain OCT (TD-OCT) retinal nerve fiber layer thickness measurements to assess the informative value of OCT to distinguish between healthy and glaucomatous eyes [2,4,7–13].
The study is registered in the registrar of the U.S. National Institute of Health (http://www.clinicaltrials.gov, NCT 01273285).
M. Töteberg-Harms (*)
:
V. Sturm:
P. B. Knecht:
J. Funk Division of Ophthalmology, UniversityHospital Zurich (USZ), Frauenklinikstrasse 24,8091 Zurich, Switzerland e-mail: [email protected] M. N. Menke
Department of Ophthalmology, Inselspital Bern, Bern, Switzerland
For RNFL measurements, TD-OCT mostly uses a 3.4-mm-diameter circle scan centered on the optic disc to generate 512 A-scans. The RNFL thickness profile shows a characteristic curve with two peaks, one in the superior and one in the inferior quadrant.
Recently, improvements in OCT technology have been introduced [14, 15]. Spectral-domain OCT (SD-OCT) provides increased resolution and scanning speed by recording the interferometric information using a Fourier-domain spectrometric method instead of adjusting the position of a reference mirror [1]. Axial resolution in tissue is up to 7μm and imaging speed has increased to 40,000 A-scans per second [16,17].
Recently, the peripapillary nerve fiber layer thickness profile was determined with SD-OCT by using high-density scanning [18–20]. In addition, repeatability of raster scans for RNFL thickness measurements has been investigated [21]. A new SD-OCT model (Spectralis™ OCT, Heidelberg
Engineering, Germany) is now available. The instrument provides peripapillary circle scans of a 12° diameter around the optic disc for RNFL retinal thickness measurements comparable to TD-OCT.
The purpose of this study was to assess and compare the repeatability of SD-OCT (Spectralis™ OCT, Heidel-berg Engineering, Germany) and conventional TD-OCT (Stratus™ OCT3000, Carl-Zeiss Meditec, Dublin, CA, USA) RNFL thickness measurements in a non-glaucoma group consisting of healthy volunteers and patients with glaucoma.
Materials and methods
Fifty eyes of 25 subjects of a non-glaucoma group consisting of healthy volunteers (18 female) with a mean age of 27.3±6.4 years and 22 eyes of 11 patients with primary open-angle glaucoma (POAG) (eight female; mean age of 71±12.2 years) were included into the study. The diagnosis of POAG was clinically based on increased optic nerve cupping with verified progression and typical visual field defects. The study was performed at a single site, University Hospital Zurich, Switzerland, between April and September 2009.
Exclusion criteria in the non-glaucoma group were history of glaucoma, history of any other ocular disease, or intraocular pressure greater than 21 mmHg. Exclusion criteria in the glaucoma group were history of other optic neuropathies or severe optic media opacities. SD-OCT RNFL circle scans were performed by using the Spectralis™ OCT system. Conventional TD-OCT RNFL circle scans were performed with Stratus™ OCT. Both OCT machines carried the CE-mark for examination of the retina. Pupil diameter had to be at least 4 mm for scanning. An internal fixation light was
used to center the scanning area on the optic disc. All scans were performed six times in one session by two operators (M.T. and M.N.M., three scans each in changing order, a randomization plan was generated using http://www.randomization.com). Between measure-ments, the subject had to lean back. Position of the head-rest and OCT correction for spherical errors was re-adjusted between each measurement. Scans with low quality and a failing retinal thickness algorithm were excluded and measurements were repeated until good quality was achieved. In addition, scans with blinks during the scanning process were excluded and repeated. All subjects gave prior written informed consent to participate in the study, which was approved by the ethics committee of the University Hospital Zurich and adhered to the tenets of the Declaration of Helsinki.
SD-OCT RNFL thickness measurements were per-formed by using circle scans with a scanning angle of 12°. When assuming a standard corneal curvature of 7.7 mm, the diameter of the circle scan is estimated to be 3.5 mm. The instrument provides up to 40,000 A-scans/s with a depth resolution of 7μm in tissue and a transversal resolution of 14 μm by using a superluminescence diode with 870-nm bandwidth. The SD-OCT combines OCT technology with a confocal scanning laser ophthalmoscope, which provides a reference fundus image. Each OCT B-scan will be registered and locked to a reference image. OCT software can identify previous scan locations and“guide” the OCT laser to scan the same location again. For this purpose, the first complete circle scan was set as a reference scan. The Spectralis™ OCT has a follow-up function to ensure that the same scanning location is identified on following examination by the tracking program. In addition, eye tracking and the high scanning speed is supposed to reduce moving artifacts. For OCT scanning, the Spectralis™ OCT provides an ART function (automatic real time) for increased image quality. With ART activated, multiple frames (B-scans) of the same scanning location are performed during the scanning process and images are averaged for noise reduction. The number of frames can be adjusted. In this study, the ART function was turned on and 16 frames were acquired for each B-scan location to reduce noise and to improve image quality. Scans were acquired in the high-resolution acquisition mode. Spectralis™ OCT provides a software algorithm (software version 1.6.1.0) for retinal thickness measurements. Each scan was separately analyzed by using the automated retinal thickness algorithm to generate RNFL thickness values in micrometers.
Stratus™ OCT uses a 3.4-mm circle scan centered on the optic disc for RNFL thickness measurements. Each circle consists of 512 A-scans. The landmark option was used to ensure that follow-up scans were exactly placed at the same retinal location around the optic disc. The RNFL thickness
measurement algorithm (software version 4.0.7) automati-cally outlines the RNFL and provides mean thickness measurements for 12 clock hours or four quadrants around the optic disc.
The SD-OCT software provides a quality bar during the scanning process based on the signal-to-noise ratio. The quality score range is 0 (bad quality) to 40 (excellent
quality). If the score is 15 or less, the quality bar turns from blue to red during the measurement. This function is comparable to the scan strength number (range 0 to 10, 10 being the best scan quality) given in TD-OCT for each examination. SD-OCT scans with a quality of less than 25, and TD-OCT scans with a scan strength number less than six were excluded and measurements were repeated until
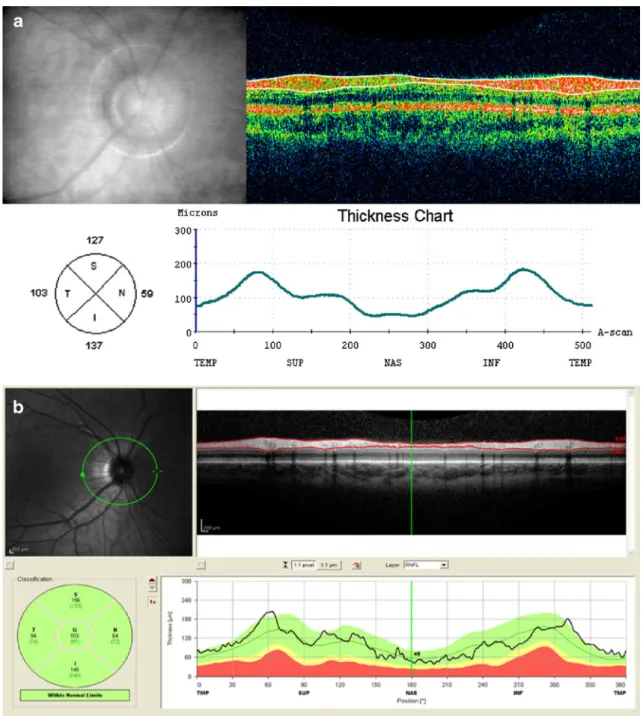
Fig. 1 Retinal nerve fiber layer (RNFL) measurement of a subject of a non-glaucoma group consisting of healthy volunteers with time-domain (TD) OCT (a) and spectral-time-domain (SD) OCT (b). Top left: fundus image; top right: cross-sectional B-scan image. The white lines (TD-OCT) or red lines (SD-OCT) indicate the automated RNFL measurement algorithm; Bottom left: Circle diagram showing mean
RNFL thickness values for all quadrants; Bottom right: RNFL thickness diagram showing the typical two peaks in the superior and inferior quadrant. In SD-OCT the green color indicates that RNFL values were within 95% confidence interval for one single subject of normal age matched subjects (i.e., 95% reference interval in the commonly used nomenclature)
six scans of good quality were acquired. In addition, scans with blinks during the scanning process were excluded and repeated. The SD-OCT system provides a software algo-rithm for RNFL thickness measurements. Each circle scan was separately analyzed by using the RNFL algorithm to generate RNFL thickness values in micrometers. Mean RNFL thickness values can be plotted as a circle, divided into four quadrants. Left eyes were treated as mirror images of right eyes. Figure 1 shows an example of a RNFL thickness measurement showing mean values of RNFL thickness for each quadrant.
For statistical analysis, mean RNFL thickness out of the three measurements for all quadrants separately for both OCT types and for both observers were computed. In addition, the overall mean RNFL thickness of all quadrants was calculated.
Coefficients of variation (COV) were determined for each quadrant and for overall mean RNFL thickness in both types (Stratus™ TD-OCT and Spectralis™ SD-OCT) and groups (non-glaucoma and glaucoma) for observer 1 and 2 separately.
Variance components were determined for subjects, eyes, and observers using a linear mixed-effects model (xtmixed in STATA)[22] for disease types and OCT types separately. Two kinds of intraclass correlation coefficients (ICCs) were determined: Intra-observer ICC and inter-observer ICC.
The linear mixed-effects model was also used to evaluate differences in RNFL thickness and COVs between study groups, quadrants, OCT types, and observers when adjust-ing for clusteradjust-ing due to patient and eye. In order to adjust for clustering, the influence of study groups, quadrants, OCT types, and observers were treated as fixed effects when the additive random effects due to patient and eye within patient were considered. No interaction effects were expected.
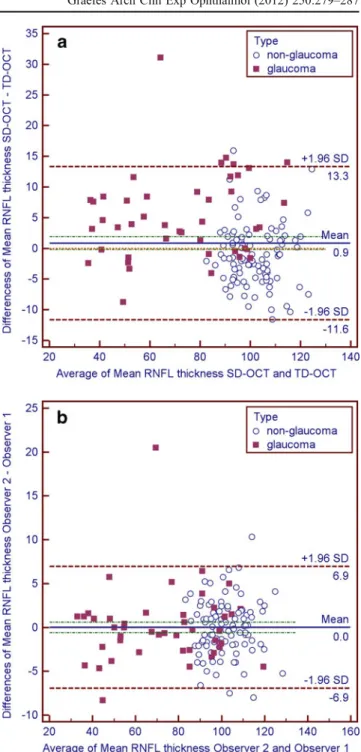
In addition, 95% limits of agreement for inter-observer and inter-OCT consistency and the bias between operators and OCT types were evaluated by means of Bland–Altman analysis [23, 24]. Only the overall mean RNFL thickness measurements were used for Fig.2. Limits of agreement are defined as the mean of the differences (between measure-ments of either observer 1 and 2, or TD-OCT and SD-OCT for overall mean RNFL thickness measurements) plus/ minus 1.96 times standard deviation (SD) of the differ-ences. They provide an interval within which 95% of the differences between measurements by the two methods are expected to lie. The 95% confidence interval (95% CI) for the differences gives the additional information about the deterministic bias between both methods. If 0 is not contained in the 95% CI, we have to conclude that one of the methods measures deterministically higher values than the other.
STATA™ (Version 9.2, StataCorp, Texas, USA) was used for the computation of the linear mixed models were as Bland–Altman plots were created using MedCalc™ (MedCalc Software 11.5.1, Mariakerke, Belgium). Results of the statistical analysis with p values smaller then the descriptive significance level of 0.05 were considered as statistically significant.
Fig. 2 Bland–Altman plots to demonstrate differences in overall mean retinal nerve fiber layer (RNFL) thickness measurements between OCT types (a) and observers (b). Limits of agreement were provided as 1.96 times standard deviation (SD) with upper and lower limit of the differences. Units for both axes areμm. Results are split for study groups (glaucoma and non-glaucoma)
Results
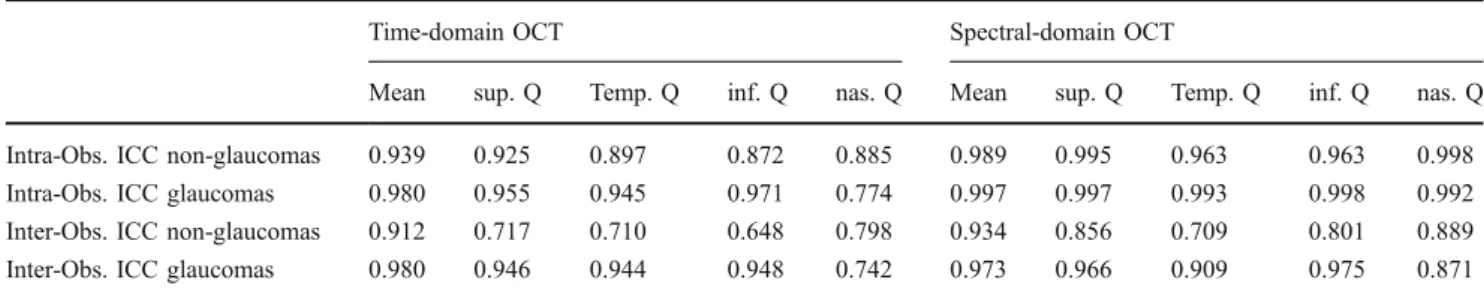
Table 1 shows the calculated intra-observer and inter-observer ICCs for both study groups. Intra-inter-observer repeatability for TD-OCT was relatively good with an ICCmean RNFL thickness of 0.939 in the non-glaucomas
and 0.980 in the glaucomatous eyes. For SD-OCT, intra-observer repeatability was higher with an ICC of 0.989 for the non-glaucomas and 0.997 for the glaucomatous eyes. In the non-glaucoma group, TD-OCT showed best intra-observer repeatability for the superior quadrant (ICC = 0.925). SD-OCT showed best repeatability for the nasal quadrant (ICC = 0.998). In the glaucoma patients, the best intra-observer repeatability was found for the inferior quadrant (ICCTD-OCT= 0.971;
ICCSD-OCT= 0.998).
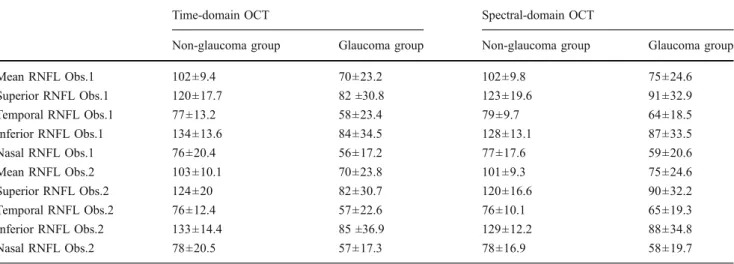
The descriptive statistics for the mean overall RNFL and mean RNFL in each quadrant can be found in (Table 2) whereas the results obtained from the linear mixed model for the mean RNFL can be found in Table4. The mean RNFL thickness values in the glaucoma group are lower than in the non-glaucoma group (−29 μm, p<0.001). No differences due to OCT type (p = 0.315) and operator (p = 0.991) could be found.
Mean COVs of measurements for each quadrant are shown in Table3. COVs were influenced by various factors (Table4).
COVs were significantly higher by 2.5 percentage points (p<0.001) in the glaucoma group than in the non-glaucoma group. COVs were significantly lower by 5.2 percentage points (p < 0.001) when TD-OCT was used than when SD-OCT was used. No differences in COV due to operator (p = 0.315) could be found.
Bland–Altman plots were used to demonstrate differ-ences in overall mean RNFL thickness measurements between OCT types (Fig. 2a) and observers (Fig. 2b) respectively. There was bias between OCT types and no bias between observers. Limits of agreement and 95% CI were provided in Table5.
Discussion
Our results indicate that RNFL measurements with Stra-tus™ TD-OCT and Spectralis™ SD-OCT are repeatable. Stratus™ TD-OCT mean RNFL thickness measurements showed an ICC of 0.939 in the non-glaucomas and 0.980 in the glaucomatous eyes. Spectralis™ SD-OCT repeatability was better with an ICC of 0.989 for the non-glaucomas and 0.997 for the glaucomatous eyes.
In addition, our analysis shows that intra-observer COV is higher in patients with glaucoma. In the non-glaucoma group, mean COV for observer 1 and 2 was 4.5% and 4.7% for Stratus™ TD-OCT, respectively. Mean COV for observer 1 and 2 in the glaucoma group was 8.9 and 9.5%, respectively. In Spectralis™ SD-OCT, mean COV for observer 1 and 2 was 0.5 and 0.7% in the non-glaucoma group, and 1.2 and 1.4% in the glaucoma group, respec-tively. These findings are in agreement with previous results [7, 10, 12,25–30]. One explanation might be that glaucoma patients have less stable fixation. This might complicate OCT measurements since it becomes difficult to exactly measure the same location around the disc again. The Spectralis™ OCT has an eye-tracking system that should minimize artifacts of eye movements and therefore increase intra-observer repeatability. In fact, COVs were lower when measured with Spectralis™ SD-OCT. The differences in COV between OCT types were particularly striking in the glaucoma group. Based on our data, glaucoma seems to approximately double the COVs in both OCT types. However, the levels of COVs in Spectralis™ SD-OCT were considerably lower compared to Stratus™ TD-OCT. Another possible explanation for lower intra-observer repeatability in glaucoma patients might be the fact that RNFL thickness values are lower. Especially in far-progressed glaucoma, RNFL thickness can be severely reduced. This probably hinders the RNFL measurement algorithm to correctly identify the RNFL. Higher OCT scan resolution might facilitate the correct outlining of the RNFL. Therefore, one would expect lower
Table 1 Inter- and intraobserver intraclass correlation coefficients (ICC) for retinal nerve fiber layer thickness measurements
Time-domain OCT Spectral-domain OCT
Mean sup. Q Temp. Q inf. Q nas. Q Mean sup. Q Temp. Q inf. Q nas. Q Intra-Obs. ICC non-glaucomas 0.939 0.925 0.897 0.872 0.885 0.989 0.995 0.963 0.963 0.998 Intra-Obs. ICC glaucomas 0.980 0.955 0.945 0.971 0.774 0.997 0.997 0.993 0.998 0.992 Inter-Obs. ICC non-glaucomas 0.912 0.717 0.710 0.648 0.798 0.934 0.856 0.709 0.801 0.889 Inter-Obs. ICC glaucomas 0.980 0.946 0.944 0.948 0.742 0.973 0.966 0.909 0.975 0.871 sup.=superior; temp.=temporal; inf.=inferior; nas.=nasal; Obs.=Observer; ICC=intraclass correlation coefficient; Q = quadrant
intra-observer variability in the glaucoma group if high-resolution SD-OCT is used [31]. Our data supports this hypothesis. In addition, comparison of OCT types showed that Spectralis™ SD-OCT has a tendency to produce higher RNFL measurements in glaucoma patients. This again might be due to the higher scan resolution that facilitates RNFL identification. However, this study could not reveal if TD-OCT underestimates or SD-OCT overestimates RNFL thickness in glaucoma patients.
All data was acquired by using the automated RNFL thickness algorithm provided by the OCT software. Therefore the repeatability data of this study can only be applied to automated RNFL measurements. Addi-tional studies are needed to test if the manually corrected algorithm shows even more reliable and reproducible results for RNFL measurements compared to the fully automated measurement.
Based on previously published data, one can assume that TD-OCT RNFL thickness measurements are reproducible, although in glaucoma patients repeatability seems to decrease [7, 9–11, 13, 32, 33]. There is a clear need to clarify if new SD-OCT models are more reliable for RNFL monitoring. Our data indicates that SD-OCT seems to be superior to TD-OCT in regard of repeatability, in particular in glaucomatous eyes. Our results are also in accordance with prior studies that have also shown this effect for other SD-OCT types [25–30,34–37].
However, direct comparison of RNFL values between different OCT machines is difficult due to different technical specifications, imaging protocols, and different thickness measurement algorithms. For example, retinal (macular) thickness measurements with the Spectralis™ OCT are performed differently compared to Stratus™ OCT. Both instruments outline the inner limiting membrane as
Table 3 Coefficients of variation (COV) of nerve fiber layer thickness measurements for OCT types, observers, and study groups
COV=Coefficient of variation; RNFL=Retinal nerve fiber layer; Obs. = Observer
Time-domain OCT Spectral-domain OCT Non-glaucoma group Glaucoma group Non-glaucoma group Glaucoma group
COV Mean RNFL Obs.1 4.5% 8.9% 0.5% 1.2%
COV Superior RNFL Obs.1 3.7% 8.9% 0.5% 1.0%
COV Temporal RNFL Obs.1 4.2% 8.7% 0.7% 1.6%
COV Inferior RNFL Obs.1 2.9% 6.0% 0.3% 1.3%
COV Nasal RNFL Obs.1 7.1% 12.0% 0.3% 0.9%
COV Mean RNFL Obs.2 4.7% 9.5% 0.7% 1.4%
COV Superior RNFL Obs.2 3.8% 8.3% 0.5% 1.5%
COV Temporal RNFL Obs.2 4.2% 8.0% 1.0% 0.9%
COV Inferior RNFL Obs.2 2.9% 8.4% 0.6% 1.0%
COV Nasal RNFL Obs.2 7.7% 13.3% 0.6% 2.3%
Table 2 Mean retinal nerve fiber layer thickness for both OCT types, observers, and study groups
Time-domain OCT Spectral-domain OCT
Non-glaucoma group Glaucoma group Non-glaucoma group Glaucoma group
Mean RNFL Obs.1 102±9.4 70±23.2 102±9.8 75±24.6 Superior RNFL Obs.1 120±17.7 82 ±30.8 123±19.6 91±32.9 Temporal RNFL Obs.1 77±13.2 58±23.4 79±9.7 64±18.5 Inferior RNFL Obs.1 134±13.6 84±34.5 128±13.1 87±33.5 Nasal RNFL Obs.1 76±20.4 56±17.2 77±17.6 59±20.6 Mean RNFL Obs.2 103±10.1 70±23.8 101±9.3 75±24.6 Superior RNFL Obs.2 124±20 82±30.7 120±16.6 90±32.2 Temporal RNFL Obs.2 76±12.4 57±22.6 76±10.1 65±19.3 Inferior RNFL Obs.2 133±14.4 85 ±36.9 129±12.2 88±34.8 Nasal RNFL Obs.2 78±20.5 57±17.3 78±16.9 58±19.7
the inner retinal border. The outer retinal border is defined in Stratus™ OCT on top of a signal believed to correspond to the junction between inner- and outer segments of the photoreceptors. However, the Spectralis™ OCT software defines the outer retinal border as to be Bruchs membrane underneath the photoreceptor signal, which results in larger retinal thickness measurements. Algorithm definitions of the outer border for RNFL thickness measurements are not that obvious, but such differences between OCT types might exist for RNFL thickness measurements as well.
As found in previous studies, repeatability of TD-OCT was lowest in the nasal quadrant [7,9–11]. Knighton et al. suggested that the angle of incidence of the illuminating beam makes the RNFL image on the nasal side dimmer and therefore harder to be identified by the measurement algorithm [38]. In addition, Budenz et al. suggested that ICCs might be reduced mathematically because of a smaller
population variance nasally [10]. In our study, SD-OCT repeatability was not significantly lower in the nasal quadrant. In fact, in non-glaucomas SD-OCT showed the best intra-observer repeatability for the nasal quadrant (ICC= 0.998) and inter-observer repeatability was also excellent (ICC=0.998). These findings contradict the assumption of Budenz et al. that the population variance nasally plays a role for repeatability. In addition, the problem of lower repeat-ability for RNFL thickness measurements nasally seems only to apply for TD-OCT. Most likely, technical specifications of TD-OCT account for the dimmer illumination of the nasal side. In SD-OCT, this seems not to be an issue.
In addition to intra-observer repeatability, our study assessed inter-observer repeatability. Differences between the two observers were minimal and not significant. However, scan quality is important to facilitate the recognition of the RNFL by the measurement algorithm.
Table 5 Summaries of the Bland–Altman plots: bias, 95% limits of agreement and 95% confidence interval
Bias (μm) Limits of agreement (μm) p value 95%CI (μm)
Non-glaucoma OCT types −1.0 −11.0 – 8.9 0.05 −2.0 −0.0
Observers 0.0 −6.2 – 6.1 0.89 −0.7 0.6
Glaucoma OCT types 5.1 −8.5 – 18.7 <0.001 3.0 7.2
Observers 0.1 −8.4 – 8.7 0.85 −1.2 1.4
The agreement between OCT-types (SD-OCT, TD-OCT) and observers (1 and 2) was investigated for non-glaucoma and glaucoma group separately. Lower and upper limits of agreement were provided as 1.96 times standard deviation of the differences (SD)
Table 4 Results of the linear mixed models with nested random effects (eye within patient)
Linear mixed model for mean RNFL thickness Linear mixed model for COV (%)
Predictor Level Coefficient Std. error p value 95% CI Coefficient Std. error p value 95% CI
Group Glaucoma 29.1 4.9 <0.001 −38.8 −19.4 2.5 0.5 <0.001 1. 6 3.5 Non-glaucoma 0 - - - - 0 - - - -Type TD-OCT 0.9 0.9 0.315 −0.8 2.5 −5.2 0.2 <0.001 −5.6 −4.7 SD-OCT 0 - - - - 0 - - - -Quadrant Superior −6.4 1.2 <0.001 −8.7 −4.0 0.5 0.3 0.097 −0.1 1.2 Temporal −45.4 1.2 <0.001 −47.8 −43.0 0.8 0.3 0.012 0.2 1.4 Nasal −46.1 1.2 <0.001 −48.5 −43.7 2.5 0.3 <0.001 1.9 3.1 Inferior 0 - - - - 0 - - - -Operator Operator 2 0.009 0.9 0.991 −1.7 1.7 0.2 0.2 0.315 −0.2 0.7 Operator 1 0 - - - - 0 - - - -Intercept Constant 154.1 7.1 <0.001 140.2 168.0 6.5 0.9 <0.001 4.8 8.2 SD patient 12.1 0.8 SD eyes 8.2 1.3 SD residual 14.5 3.8
(Group=glaucoma vs. non-glaucoma; Type=TD-OCT vs. SD-OCT; Superior=superior vs. inferior quadrant; Temporal=temporal vs. inferior quadrant; Nasal=nasal vs. inferior quadrant; Operator=Operator 2 vs. Operator 1; Constant=intercept; 95% CI=95% confidence interval of the estimate; SD patient=SD of the random effect for patients; SD eyes=SD of the random effect for eyes; SD residual=SD of the unexplained variability) Example: The expected RNFL thickness of a control subject examined by SD-OCT in the inferior quadrant measured by operator 2 is given by 154.1+0*29.1+ 0*0.9 - 0*6.4 -0*45.4 - 0*46.1+1*0.009=154.109
In clinical routine, there might be a greater difference in RNFL measurements between experienced OCT operators and un-experienced operators, which are expected to produce scans of lower quality. In our study, the experience level of both operators was similar. Therefore we assume that the imprecision for both operators is about the same.
Multiple prior studies with previous generations of OCT tested repeatability. However, ICCs cannot directly be compared since measurements were done in different groups of subjects and with different OCT models. The ICC is calculated as the ratio of variability due to differ-ences between subjects to variability from all sources such as noise and/or fluctuations within subjects. In our case, ICCs were calculated from measurements of young healthy volunteers and from a group of glaucoma patients. One would expect only little between subject variance in the non-glaucoma group. However, between subjects variance is considerably greater in the glaucoma group.
In conclusion, intra- and inter observer repeatability is satisfactory in both OCT devices. However, in SD-OCT repeatability was significantly better. Differences in repeat-ability between OCT types were in particular striking in the glaucomatous eyes. SD-OCT can be safely and reliably used to monitor patients with glaucoma and other optic neuropathies and might be even superior to TD-OCT in these patients.
Conflict of interest None of the authors has any financial interest in any product described in this study.
References
1. Chen TC, Zeng A, Sun W, Mujat M, de Boer JF (2008) Spectral domain optical coherence tomography and glaucoma. Int Oph-thalmol Clin 48:29–45
2. Cho JW, Sung KR, Hong JT, Um TW, Kang SY, Kook MS (2011) Detection of glaucoma by spectral domain-scanning laser oph-thalmoscopy/optical coherence tomography (SD-SLO/OCT) and time domain optical coherence tomography. J Glaucoma 20:15–20 3. Leung CK, Cheung CY, Weinreb RN, Qiu K, Liu S, Li H, Xu G, Fan N, Pang CP, Tse KK, Lam DS (2010) Evaluation of retinal nerve fiber layer progression in glaucoma: a study on optical coherence tomography guided progression analysis. Invest Oph-thalmol Vis Sci 51:217–222
4. Park SB, Sung KR, Kang SY, Kim KR, Kook MS (2009) Comparison of glaucoma diagnostic capabilities of cirrus HD and stratus optical coherence tomography. Arch Ophthalmol 127:1603– 1609
5. Zangwill LM, Bowd C, Weinreb RN (2000) Evaluating the optic disc and retinal nerve fiber layer in glaucoma. II: optical image analysis. Semin Ophthalmol 15:206–220
6. Schuman JS, Hee MR, Arya AV, Pedut-Kloizman T, Puliafito CA, Fujimoto JG, Swanson EA (1995) Optical coherence tomography: a new tool for glaucoma diagnosis. Curr Opin Ophthalmol 6:89– 95
7. Blumenthal EZ, Williams JM, Weinreb RN, Girkin CA, Berry CC, Zangwill LM (2000) Reproducibility of nerve fiber layer thickness measurements by use of optical coherence tomography. Ophthal-mology 107:2278–2282
8. Bourne RR, Medeiros FA, Bowd C, Jahanbakhsh K, Zangwill LM, Weinreb RN (2005) Comparability of retinal nerve fiber layer thickness measurements of optical coherence tomography instru-ments. Invest Ophthalmol Vis Sci 46:1280–1285
9. Budenz DL, Chang RT, Huang X, Knighton RW, Tielsch JM (2005) Reproducibility of retinal nerve fiber thickness measure-ments using the stratus OCT in normal and glaucomatous eyes. Invest Ophthalmol Vis Sci 46:2440–2443
10. Budenz DL, Fredette MJ, Feuer WJ, Anderson DR (2008) Reproducibility of peripapillary retinal nerve fiber thickness measurements with stratus OCT in glaucomatous eyes. Ophthal-mology 115(661–666):e664
11. Carpineto P, Ciancaglini M, Zuppardi E, Falconio G, Doronzo E, Mastropasqua L (2003) Reliability of nerve fiber layer thickness measurements using optical coherence tomography in normal and glaucomatous eyes. Ophthalmology 110:190–195
12. Krist R, Hoffmann EM, Schwenn O (2005) Reproducibility of measurements of the peripapillary retinal nerve fibre layer thickness. Optical coherence tomography versus retinal thickness analyzer. Ophthalmologe 102(1175–1178):1180
13. Paunescu LA, Schuman JS, Price LL, Stark PC, Beaton S, Ishikawa H, Wollstein G, Fujimoto JG (2004) Reproducibility of nerve fiber thickness, macular thickness, and optic nerve head measurements using StratusOCT. Invest Ophthalmol Vis Sci 45:1716–1724
14. Choma M, Sarunic M, Yang C, Izatt J (2003) Sensitivity advantage of swept source and Fourier domain optical coherence tomography. Opt Express 11:2183–2189
15. Wojtkowski M, Srinivasan V, Fujimoto JG, Ko T, Schuman JS, Kowalczyk A, Duker JS (2005) Three-dimensional retinal imaging with high-speed ultrahigh-resolution optical coherence tomography. Ophthalmology 112:1734–1746
16. Wojtkowski M, Srinivasan V, Ko T, et al (2005) High-speed, ultrahigh resolution retinal imaging using spectral/Fourier domain OCTConf Lasers Electrooptics, pp. 2058–2060>
17. Wojtkowski M, Srinivasan V, Ko T, Fujimoto J, Kowalczyk A, Duker J (2004) Ultrahigh-resolution, high-speed, Fourier domain optical coherence tomography and methods for dispersion compensation. Opt Express 12:2404–2422
18. Bendschneider D, Tornow RP, Horn FK, Laemmer R, Roessler CW, Juenemann AG, Kruse FE, Mardin CY (2010) Retinal nerve fiber layer thickness in normals measured by spectral domain OCT. J Glaucoma 19:475–482
19. Gabriele ML, Ishikawa H, Wollstein G, Bilonick RA, Kagemann L, Wojtkowski M, Srinivasan VJ, Fujimoto JG, Duker JS, Schuman JS (2007) Peripapillary nerve fiber layer thickness profile determined with high speed, ultrahigh resolution optical coherence tomography high-density scanning. Invest Ophthalmol Vis Sci 48:3154–3160 20. Hong S, Kim CY, Lee WS, Seong GJ (2010) Reproducibility of
peripapillary retinal nerve fiber layer thickness with spectral domain cirrus high-definition optical coherence tomography in normal eyes. Jpn J Ophthalmol 54:43–47
21. Menke MN, Knecht P, Sturm V, Dabov S, Funk J (2008) Reproducibility of nerve fiber layer thickness measurements using 3D Fourier-domain OCT. Invest Ophthalmol Vis Sci 49:5386–5391 22. Rabe-Hesketh S, Skrondal A (2008) Estimation using xtmixed in Multilevel and Longitudinal Modeling Using STATA, pp. 433–436 23. Bland JM, Altman DG (1986) Statistical methods for assessing
agreement between two methods of clinical measurement. Lancet 1:307–310
24. Bland JM, Altman DG (1999) Measuring agreement in method comparison studies. Stat Methods Med Res 8:135–160
25. Gonzalez-Garcia AO, Vizzeri G, Bowd C, Medeiros FA, Zangwill LM, Weinreb RN (2009) Reproducibility of RTVue retinal nerve fiber layer thickness and optic disc measurements and agreement with Stratus optical coherence tomography measurements. Am J Ophthalmol 147:1067–1074, 1074 e1061
26. Johnson DE, El-Defrawy SR, Almeida DR, Campbell RJ (2009) Comparison of retinal nerve fibre layer measurements from time domain and spectral domain optical coherence tomography systems. Can J Ophthalmol 44:562–566
27. Kim JS, Ishikawa H, Sung KR, Xu J, Wollstein G, Bilonick RA, Gabriele ML, Kagemann L, Duker JS, Fujimoto JG, Schuman JS (2009) Retinal nerve fibre layer thickness measurement reproduc-ibility improved with spectral domain optical coherence tomogra-phy. Br J Ophthalmol 93:1057–1063
28. Knight OJ, Chang RT, Feuer WJ, Budenz DL (2009) Comparison of retinal nerve fiber layer measurements using time domain and spectral domain optical coherent tomography. Ophthalmology 116:1271–1277 29. Sung KR, Kim DY, Park SB, Kook MS (2009) Comparison of retinal nerve fiber layer thickness measured by Cirrus HD and Stratus optical coherence tomography. Ophthalmology 116:1264–1270, 1270 e1261 30. Vizzeri G, Weinreb RN, Gonzalez-Garcia AO, Bowd C, Medeiros FA, Sample PA, Zangwill LM (2009) Agreement between spectral-domain and time-domain OCT for measuring RNFL thickness. Br J Ophthalmol 93:775–781
31. Leite MT, Zangwill LM, Weinreb RN, Rao HL, Alencar LM, Sample PA, Medeiros FA (2010) Effect of disease severity on the performance of Cirrus spectral-domain OCT for glaucoma diagnosis. Invest Ophthalmol Vis Sci 51:4104–4109
32. Jones AL, Sheen NJ, North RV, Morgan JE (2001) The Humphrey optical coherence tomography scanner: quantitative analysis and reproducibility study of the normal human retinal nerve fibre layer. Br J Ophthalmol 85:673–677
33. Schuman JS, Pedut-Kloizman T, Hertzmark E, Hee MR, Wilkins JR, Coker JG, Puliafito CA, Fujimoto JG, Swanson EA (1996) Reproducibility of nerve fiber layer thickness measurements using optical coherence tomography. Ophthalmology 103:1889–1898 34. Chang RT, Knight OJ, Feuer WJ, Budenz DL (2009) Sensitivity
and specificity of time-domain versus spectral-domain optical coherence tomography in diagnosing early to moderate glaucoma. Ophthalmology 116:2294–2299
35. Kim JS, Ishikawa H, Gabriele ML, Wollstein G, Bilonick RA, Kagemann L, Fujimoto JG, Schuman JS (2010) Retinal nerve fiber layer thickness measurement comparability between time domain optical coherence tomography (OCT) and spectral domain OCT. Invest Ophthalmol Vis Sci 51:896–902
36. Leung CK, Cheung CY, Weinreb RN, Qiu Q, Liu S, Li H, Xu G, Fan N, Huang L, Pang CP, Lam DS (2009) Retinal nerve fiber layer imaging with spectral-domain optical coherence tomogra-phy: a variability and diagnostic performance study. Ophthalmol-ogy 116:1257–1263, 1263 e1251–1252
37. Schuman JS (2008) Spectral domain optical coherence tomogra-phy for glaucoma (an AOS thesis). Trans Am Ophthalmol Soc 106:426–458
38. Knighton RW, Qian C (2000) An optical model of the human retinal nerve fiber layer: implications of directional reflectance for variability of clinical measurements. J Glaucoma 9:56–62