HAL Id: hal-00297648
https://hal.archives-ouvertes.fr/hal-00297648
Submitted on 24 Oct 2007
HAL is a multi-disciplinary open access
archive for the deposit and dissemination of
sci-entific research documents, whether they are
pub-lished or not. The documents may come from
teaching and research institutions in France or
abroad, or from public or private research centers.
L’archive ouverte pluridisciplinaire HAL, est
destinée au dépôt et à la diffusion de documents
scientifiques de niveau recherche, publiés ou non,
émanant des établissements d’enseignement et de
recherche français ou étrangers, des laboratoires
publics ou privés.
storage following afforestation of a semi-arid shrubland
J. M. Grünzweig, I. Gelfand, Y. Fried, D. Yakir
To cite this version:
J. M. Grünzweig, I. Gelfand, Y. Fried, D. Yakir. Biogeochemical factors contributing to enhanced
carbon storage following afforestation of a semi-arid shrubland. Biogeosciences, European Geosciences
Union, 2007, 4 (5), pp.891-904. �hal-00297648�
www.biogeosciences.net/4/891/2007/ © Author(s) 2007. This work is licensed under a Creative Commons License.
Biogeosciences
Biogeochemical factors contributing to enhanced carbon storage
following afforestation of a semi-arid shrubland
J. M. Gr ¨unzweig1, I. Gelfand2, Y. Fried1, and D. Yakir2
1Robert H. Smith Institute of Plant Sciences and Genetics in Agriculture, Faculty of Agricultural, Food and Environmental Quality Sciences, the Hebrew University of Jerusalem, Rehovot 76100, Israel
2Department of Environmental Sciences and Energy Research, Weizmann Institute of Science, Rehovot 76100, Israel Received: 23 May 2007 – Published in Biogeosciences Discuss.: 2 July 2007
Revised: 17 September 2007 – Accepted: 11 October 2007 – Published: 24 October 2007
Abstract. Ecosystems in dry regions are generally low in productivity and carbon (C) storage. We report, however, large increases in C sequestration following afforestation of a semi-arid shrubland with Pinus halepensis trees. Using C and nitrogen (N) inventories, based in part on site-specific allometric equations, we measured an increase in the stand-ing ecosystem C stock from 2380 g C m−2 in the shrubland to 5840 g C m−2in the forest after 35 years, with no signif-icant change in N stocks. Carbon sequestration following afforestation was associated with increased N use efficiency as reflected by an overall increase in C/N ratio from 7.6 in the shrubland to 16.6 in the forest. The C accumulation rate in the forest was particularly high for soil organic C (SOC; increase of 1760 g C m−2or 50 g C m−2yr−1), which was as-sociated with the following factors: 1) Analysis of a small 13C signal within this pure C
3 system combined with size fractionation of soil organic matter indicated a significant ad-dition of new SOC derived from forest vegetation (68% of to-tal forest SOC) and a considerable portion of the old original shrubland SOC (53%) still remaining in the forest. 2) A large part of both new and old SOC appeared to be protected from decomposition as about 60% of SOC under both land-use types were in mineral-associated fractions. 3) A short-term decomposition study indicated decreased decomposition of lower-quality litter and SOC in the forest, based on reduced decay rates of up to 90% for forest compared to shrubland litter. 4) Forest soil included a significant component of live and dead roots (12% of total SOC). Our results suggest a role for increased N use efficiency, enhanced SOC protection and reduced decomposition rates in the large C sequestration po-tential following afforestation in semi-arid regions. These re-sults are particularly relevant in light of persistent predictions of drying trends in the Mediterranean and other regions.
Correspondence to: J. M. Gr¨unzweig ([email protected])
1 Introduction
The Kyoto Protocol of the United Nations Framework Con-vention on Climate Change encourages management of ter-restrial ecosystems that leads to increased carbon (C) se-questration. One of the ways to achieve this is through af-forestation, which was discussed as an instrument for reduc-ing global CO2emissions and stabilizing the climate (Jack-son and Schlesinger, 2004; Pacala and Socolow, 2004). Af-forestation is defined as establishment of forests on lands which historically have not contained forests (Houghton et al., 1996) or, alternatively, as lands which have been without forest for a period of several decades and have previously been under a different land use (Watson et al., 2000). In ad-dition to C storage, afforestation can be a tool for restoring degraded dryland soils and ecosystems (Lal, 2004).
Afforestation often results in increased ecosystem-scale C stocks, mainly as a consequence of the build-up of above-ground tree biomass (Thuille and Schulze, 2006). Conse-quences of forest establishment for soil C are more complex, and depend on the former land use, on forest age and on the environmental conditions. Afforestation of former crop-land resulted in a mean increase of 18% in soil organic C (SOC) stocks across various climatic conditions and forest ages, while planting forests on former native forest or grass-land resulted in a mean decrease of 10–13% in SOC stocks (Guo and Gifford, 2002). Those losses of SOC were smaller or no longer present at a later stage of forest development (30 to 40 years after afforestation) and below ∼1200 mm mean annual precipitation (MAP) (Guo and Gifford, 2002; Paul et al., 2002). Woody encroachment, the invasion of woody veg-etation into deserts and grasslands, resulted in reduction of SOC at moist sites with 660–1070 mm MAP, but to increased SOC stocks at dry sites below ∼350 mm MAP (Jackson et al., 2002; Smith and Johnson, 2003). Therefore, dry areas appear to have a potential for net C sequestration in soils fol-lowing a few decades of establishment of woody vegetation.
For example, the SOC sequestration potential of leguminous trees in subtropical semi-arid regions of the globe was esti-mated at 6.2 Pg (Geesing et al., 2000).
A first estimate of C stocks in a semi-arid plantation of Aleppo pine (Pinus halepensis Mill.) in Israel showed that both ecosystem and SOC storage were increased by af-forestation of former shrubland (Gr¨unzweig et al., 2003). However, the biogeochemical mechanisms enabling in-creased C storage in this and similar forests remained un-clear. The main processes that control C storage following afforestation are accumulation of C in vegetation, C emis-sion by decomposition, and litter incorporation into the soil (Quideau et al., 2001; Farley et al., 2004). These processes are controlled by litter quality, nutrient use efficiency (partic-ularly nitrogen, N) at which C input is used, stabilization of SOC stocks by physical protection, microbial composition and activity, and microclimatic variables, such as soil tem-perature and moisture (Conant et al., 1998; Post and Kwon, 2000; Chapela et al., 2001; Six et al., 2002; Farley et al., 2004).
The primary objectives of the current study were to eval-uate key processes in the C cycle, such as C partitioning, SOC turnover and litter decomposition, and to assess poten-tial biogeochemical mechanisms for increased C storage fol-lowing afforestation in a hot semi-arid region. A small iso-topic signal and physical fractionation of SOC were used to fractionate the forest SOC stock and to calculate shrubland SOC turnover. A litter bag assay and C/N analyses of the main C stocks in forest and shrubland were performed. In addition, the preliminary estimate of C stocks (Gr¨unzweig et al., 2003) was complemented by an N stock and was im-proved by developing site-specific allometric equations for tree biomass stocks.
2 Materials and methods 2.1 Site details
This study was conducted in and around Yatir Forest (31◦20′N, 35◦03′E), a pine plantation established at the edge of the Negev Desert between the years 1965 and 1969 (for the purpose of this study, we assumed a mean forest age of 35 years at the time of main soil sampling). The site is located at the transition between sub-humid and arid Mediterranean climatic zones, with mean diurnal (24-h) air temperature and relative humidity of 10◦C and 65% in January and 25◦C and 50% in July. The semi-arid climate of the northern Negev is characterized by an extended rainless period between May and October or November, and a main rainy season from De-cember to March or April. The forest is dominated by P. halepensis, with smaller proportions of other pine species (mostly Pinus brutia Ten. and Pinus pinea L.), Italian cy-press (Cucy-pressus sempervirens L.), and little understory veg-etation (peak understory aboveground biomass <100 g m−2).
Tree density in 2004 was 300 trees ha−1, mean tree diameter was 17.5 cm and mean tree height was 10 m. The trees were neither irrigated nor fertilized at any time. The surround-ing native vegetation, which was the land cover prior to af-forestation, consists of sparse shrubland with patches domi-nated by the dwarf shrub Sarcopoterium spinosum (L.) Spach and patches of herbaceous annuals and perennials (maximum vegetation height varied around 30–50 cm). The shrubland has been under moderate to heavy grazing during the last decades, and, like the entire region, was probably under graz-ing for several millennia. Herbaceous vegetation in the forest was removed mechanically or chemically during the first 12 years after afforestation, and since then is subjected to a mod-erate to heavy grazing regime (Abed Abualkean, personal communication). The main soil type in forest and shrub-land is light Rendzina (Haploxeroll) above chalk and lime-stone, with a deep ground-water table (>100 m). Main plant activity is concentrated during the winter and spring season between December and April.
2.2 Field sampling and methodology
Five 30×30 m plots were chosen in the central part of the for-est. Four of those five plots were stocked with P. halepensis only, while in the fifth plot, 65% of individuals and 85% of aboveground biomass were of P. halepensis, the rest being C. sempervirens. Five 30×30 m plots were chosen in the native shrubland around the forest. All shrubland and forest plots were at an altitude of 580–650 m a.s.l.
Standing aboveground tree biomass and biomass of the belowground stem-root transition section in the forest (see below) were estimated from measurements of stem diame-ter at 1.3 m and tree height using allometric equations (Ap-pendix A, Table A1). For the establishment of allometric equations (see e.g. Scarascia-Mugnozza et al., 2000), 28 P. halepensis trees were harvested in 2003. Trees were selected along a curve of tree height vs. stem diameter which was determined in a preliminary inventory of 256 trees. The se-lected trees spanned a stem diameter range of 3–26 cm, and different age classes were bulked. After felling, the stem was divided into sections of 1–3 m, and the crown was sep-arated into two to three equal compartments. Branches were separated into three different diameter classes, and represen-tative branches were selected for separation into three dif-ferent subclasses, cones and leaves. Five trees were also assessed for determination of belowground biomass of the stem-root transition section (belowground part of the stem + coarse roots protruding below the stem) excavated to a distance of 50–100 cm from the stem and a depth of about 50 cm. Samples of all components were collected for deter-mination of the dry matter content at 80◦C. For determina-tion of aboveground tree biomass of C. sempervirens, stem-volume equations developed by Israel’s forestry agency were used (KKL-JNF, 1999). Those equations cover the range of tree sizes in Yatir Forest, and tree biomass was estimated
using measured stem-wood density of 900 kg m−3, dry mat-ter content of 60.1%, and a ratio of stem/total biomass of 0.64 derived from the literature for the congenerous species Cupressus torulosa D. Don (Rathore et al., 1997). During pe-riodic thinning campaigns, part of the aboveground biomass was harvested by the forestry agency. The amount of har-vested biomass was estimated from diameter measurements of the generally well preserved stumps after converting to stem diameter at 1.3 m (KKL-JNF, 1999) and applying a set of allometric equations using only stem diameter (Table A1). Harvested stems >10.2 cm diameter were processed by in-dustry into products of medium lifetime, with the remain-ing harvested wood used for heatremain-ing (Abed Abualkean, per-sonal communication). Aboveground herbaceous biomass in the forest and shrubland was assumed zero, since grazing removed virtually all herbaceous plant material by the end of the drought period. Herbaceous root biomass and grazed biomass replaced by defecation of domestic animals were in-cluded in the belowground C stocks. Shrub biomass in the shrubland was determined by destructive harvest of two sub-plots of 8-m diameter adjacent to each plot. The biomass of the stem-root transition section of shrubs was calculated by a general relationship with aboveground biomass established by a destructive harvest (data not shown).
For C and N concentrations and stable isotopes, above-ground plant material was collected from five trees or shrubs per plot at the end of the dry period in 2001. Leaves included all living leaf cohorts on a twig, and tree stem properties were measured on stem cores at 1.3 m height. Soil in the forest was sampled from five cores (5 cm diameter) per plot dur-ing 2001 and 2002. Soil in each shrubland plot was sampled from five cores under S. spinosum shrubs (shrub microsite) and five cores in the interspaces between shrubs (intershrub microsite). The two microsites typically differ in soil chem-ical and other properties (e.g. Charley and West, 1975). At both sites, the mineral soil was separated into the following layers, according to Harrison et al. (2000): 0–5, 5–10, 10–20 and 20–50 cm. Roots were included in carbon stocks of min-eral soils, since it was impossible to manually separate myri-ads of fine root segments from dry soil particles. However, in 2007, fine roots (<2 mm diameter) and coarse roots (<5 mm;
∼15% of root C stock) were sampled from five cores (4.8 cm diameter) per plot, and were washed from soil over a series of sieves. The percentage of roots per total SOC was averaged across three sampling dates in 2007. The shallow litter layer was sampled within a grid of 40×40 cm in the forest and at the intershrub microsite, and within a grid of 10×10 cm un-der shrubs. Litter C and N stocks were presented as part of the soil.
2.3 Laboratory methodology
Soil samples were air-dried, sieved (2 mm) and mixed. Lit-ter was separated from mineral soil, coarsely ground and mixed. All cores in a plot were then combined to one
composite sample per plot and depth. Soil texture was analyzed by the hydrometer method after dispersion with sodium hexametaphosphate (Sheldrick and Wang, 1993). Soil pH was measured by a glass electrode in the super-natant of a 1:10 soil/water suspension. For elemental and isotopic analyses, soil and litter was ground to pass a
250-µm sieve. Concentrations of total C and N were deter-mined in an elemental analyzer (EA 1108, Carlo-Erba, Mi-lan, Italy). SOC was measured by the EA 1108 follow-ing removal of carbonates by treatfollow-ing ground soil samples with 1N HCl for 24 h according to Midwood & Boutton (1998). Stable carbon isotope analyses were conducted on CO2samples in an isotope-ratio mass spectrometer (Optima, Micromass, Manchester, UK) after quantitative combustion in the EA 1108. Stable C isotope ratios were expressed as
δ13C (‰)=(Rsample/Rstandard−1)×1000, where R=13C/12C. The standard was V-PDB, and the precision of the 13C analysis was ±0.1‰. Inorganic C concentration was deter-mined as the difference between total and organic C, and was expressed as CaCO3-equivalent C. Coarse organic mat-ter (>2 mm) was added to the fine fraction to demat-termine soil organic C concentration and stocks. In plots with shallow soil (<50 cm depth), samples were taken to 20 cm only, and C and N stocks were corrected to the maximal depth in the plot (30–40 cm) as determined by extensive probing with a metal rod. Carbon and N stocks were corrected for differ-ences in bulk density by the method of equivalent soil mass (Gr¨unzweig et al., 2004). To calculate total shrubland C and N stocks, stocks obtained for the shrub and intershrub mi-crosites were weighted with the respective percentage ground cover (19% shrub cover, 61% covered by intershrub spaces on soil, the remaining being bare rock). All area-based val-ues of C and N inventories were corrected for ground cover by rocks.
Using a small isotopic signal introduced by afforestation (see Results) in combination with physical fractionation of soil organic matter enabled partitioning of forest SOC into its components, i.e. SOC derived from forest trees vs. SOC remaining from the original shrubland. Organic matter in the top 10 cm of forest and shrubland soil was fractionated into different size classes, generally following methods of Cam-bardella and Elliott (1992) and Sollins et al. (1999). Briefly, 20 g of dry soil was dispersed in 50 ml of 5% (w/v) sodium hexametaphosphate in a reciprocal shaker for 18 h. The suspension was passed through sieves to generate fractions
>250 µm (particulate organic C), >50 µm (intermediate C
fraction), and <50 µm (mineral-associated C). The fractions were dried at 80◦C and then treated to remove carbonates as described above. The smaller the particle size, the more microbially degraded and recalcitrant the organic matter was assumed to be, which was confirmed by the δ13C data (see Results). Fractionation at various densities of sodium poly-tungstate did not yield a significant separation of SOC pools. Because the small isotopic signal in this C3-all system might limit the SOC analysis, we compared the results of
two isotope mixing models that use different parameters for the computation of the fraction of forest-derived C in forest soil. The common mixing model (Balesdent and Mariotti, 1996; Six and Jastrow, 2002) was slightly modified by sub-stituting δ13C of bulk SOC of the native soil with δ13C of the mineral-associated SOC fraction in that soil, as follows: Cf −d/Cf=(δ13Cf−δ13Cs−ma)/(δ13Cf r−δ13Cs−ma), (1) where Cf −d is the forest-derived C stock in forest soil, Cf is the total forest SOC stock, δ13Cf and δ13Cf r are the iso-topic composition of the total forest SOC stock and of forest roots, respectively, and δ13Cs−mais the isotopic composition of the mineral-associated SOC fraction in the shrubland. A second version of the mixing model was modified from the alternative model of Balesdent & Mariotti (1996) as follows: Cf −d/Cf=(δ13Cf−δ13Cs−ma)/(δ13Cf −po−δ13Cs−po), (2) where δ13C
f −poand δ13Cs−poare the isotopic composition of the particulate organic C fraction in the forest and the shrubland soil, respectively. In this version of the mass bal-ance, δ13C of the vegetation (Balesdent and Mariotti, 1996) was substituted by δ13C of assumingly most labile SOC.
Mean residence time (MRT) of shrubland SOC in the for-est was calculated as follows (Six and Jastrow, 2002):
MRT = t / ln(Cs/Cs−d), (3)
where t is the time since afforestation, Cs is the total SOC stock in the shrubland and Cs−d is the shrubland-derived SOC in the forest soil. Cs−d was determined by the differ-ence between Cf and Cf −d(from Eqs. 1 and 2).
2.4 Litter-decomposition assay
Local and standard litters were placed in litter bags for short-term decomposition in the forest and the shrubland during the wet and dry seasons using standard methodology (Har-mon et al., 1999; Gr¨unzweig et al., 2003). Local litter in the forest consisted of needles (C/N ratio=155.8) collected in litter traps during the 2004–2005 season and of roots (C/N ratio=60.0) collected from three plots to a depth of 10 cm at the end of the dry season in 2005. Local litter in the shrubland consisted of standing leaf litter (C/N ratio=39.0) and of roots to a depth of 10 cm (C/N ratio=36.0) collected from three plots under shrubs and in the intershrub microsite at the end of the dry season in 2005. Wheat straw served as standard litter (C/N ratio=102.9), and was obtained from M. Sternberg and Y. Navon (Tel Aviv University, Tel Aviv, Is-rael). Initial litter dry mass (d.m.) was 3.0±0.2 g (target d.m.
±planned and weighed deviation from target) in all litter bags. Leaf and standard litter to be placed on the soil surface were weighed into 5×10 cm litter bags made of nylon with a mesh size of 0.5×1 mm facing down and 2×4 mm facing up. Root and standard litter to be placed vertically at 0–10 cm in the soil were weighed into litter bags of the same size and
material as the leaf-litter bags with a mesh size of 0.5×1 mm at both sides. Litter was placed in the field in January 2006 for decomposition of 4 months during the wet season, and in June 2006 for decomposition of 4 months during the dry sea-son. Litter bags that were placed in the field and immediately retrieved served as control.
3 Results
3.1 Soil properties
Carbonate concentration at all sites and depths ranged from 19 to 31%, with the forest being depleted in carbonate com-pared with the native shrubland in the top 20 cm of the soil profile (Table 1). Soil pH was dominated by the high carbon-ate content, and was significantly lower under shrubs than in the open interspace between shrubs. Its increase with depth reflected the parallel increase in carbonate content. Clay con-tent ranged from 32 to 53% and increased with depth, with no differences among sites.
3.2 Plant carbon and nitrogen relations
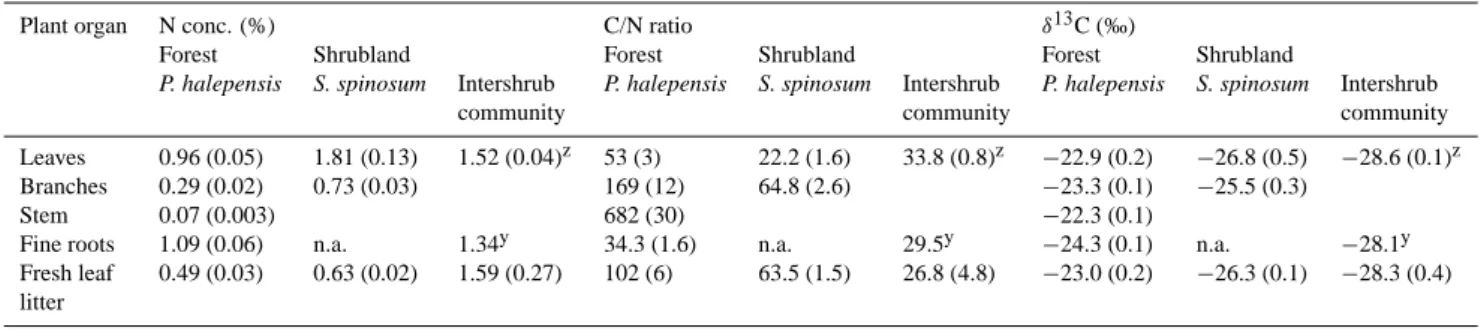
Nitrogen concentrations in plant parts and fresh litter from pine were lower by 10–60% than those from S. spinosum (Ta-ble 2). Consequently, C/N ratios were wider in pine than in S. spinosum tissue, particularly in tree stem and branch wood. The intershrub plant community had N concentrations and C/N ratios that were closer to shrub than to pine tissues. Pine tissues were significantly enriched in δ13C by 2–4‰ com-pared with plant parts of S. spinosum and by 4–6‰ comcom-pared with the intershrub community. δ13C in pine did not change from living leaves to leaf litter, and was higher by about 1‰ in needles compared with roots.
3.3 Soil carbon and nitrogen concentrations and δ13C Concentrations of organic C were higher in the mineral soil of the forest and the shrub microsite in the shrubland com-pared with intershrub soil (Fig. 1, Table 3). The difference between forest and intershrub soil extended over the entire soil profile, while forest soil was not significantly different from soil under shrubs. Total N concentration was higher un-der shrubs than in intershrub soil, with no difference between forest soil and either of the shrubland microsites. Both SOC and N concentrations decreased typically with depth at all sites and microsites. The forest had a significantly wider C/N ratio than the shrubland microsites for both the litter layer (57 vs. 29–31) and the mineral soil (10.7–11.9 vs. 6.0–8.6). SOC concentration did not correlate with either pH or clay content (data not shown).
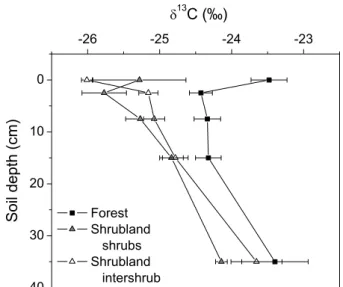
Forest soil was significantly enriched in 13C compared with both shrubland microsites for the mineral soil (Fig. 2, Table 3) and the litter layer (Fig. 2). Higher forest soil δ13C reflected the difference in δ13C between forest and shrubland
Fig. 1. Soil C and N concentrations and C/N ratio in the forest and
the shrubland microsites. The litter layer was set at 0 cm soil depth. Mean ± s.e., n=3–5 plots.
vegetation and fresh litter (Table 2). Forest soil at 0–20 cm had 0.5–0.7‰ and 0.9–1.3‰ higher δ13C than intershrub and shrub soils, respectively. δ13C increased with increas-ing depth in the mineral soil at all sites and microsites.
Fig. 2. δ13C in SOC in the forest and the shrubland microsites. The litter layer was set at 0 cm soil depth. Mean ± s.e., n=3–5 plots.
3.4 Carbon and nitrogen stocks
Organic C stocks were significantly larger in the forest than in the shrubland in part of the tested soil layers and in the soil profile as a whole (Table 4). Afforestation resulted in an increase of 1760 g C m−2 or 75% in the SOC stock (in-cluding litter layer and roots, but not the stem-root transition section) after 35 years. This increase in SOC translated into a mean annual SOC accumulation rate of 50 g C m−2yr−1. A large part of SOC under both land-use types was concen-trated at 0–20 cm in the mineral soil (58–64%), and only a small fraction was found in the litter layer (1–3%). The live and total C stocks of mainly fine roots were also determined separately from SOC for the top 20 cm of the mineral soil and contributed 10±2% and 12±2% (mean ± s.e., n=5), re-spectively, to the total forests SOC stock.
Naturally, the C stock in standing aboveground biomass was much larger in the forest than in the shrubland, and amounted to 27% and 2.5% of their respective total ecosys-tem C stocks. The total ecosysecosys-tem organic C stock in the forest was almost 2.5 times the equivalent C stock in the shrubland, an increase of 3460 g C m−2or 99 g C m−2yr−1. Forty-three percent of the increase in total ecosystem or-ganic C originated from increased aboveground C stocks and 57% from increased belowground C stocks. Periodic thinning in the forest removed a large amount of total aboveground biomass that was of the same order of mag-nitude as standing biomass (Table 4). Adding harvested stems >10.2 cm diameter (770±236 g C m−2; assumingly processed into products of medium life time) to stand-ing ecosystem C stocks increased the total amount of medium- to long-term C stores generated by afforestation to 4230 g C m−2or 121 g C m−2yr−1.
Table 1. Soil properties in forest and shrubland microsites. Clay
content and pH were determined over 0–10 cm. Mean (s.e.), n=2–5 plots.
Soil depth per site Carbonate pH Clay content and microsite concentration (%)
(% CaCO3 -equiv.) Forest 0–5 cm 19.4 (1.3) 8.34 (0.02) 36.5 (2.4) 5–10 cm 19.2 (1.9) 10–20 cm 19.9 (1.5) 8.32 (0.05) 40.5 (0.9) 20–50 cm 27.0 (1.5) 8.37 (0.07) 41.7 (1.7) Shrubland, shrub microsite 0–5 cm 23.8 (4.2) 8.09 (0.06) 31.7 (7.1) 5–10 cm 22.5 (4.0) 10–20 cm 23.1 (3.2) 8.30 (0.03) 32.5 (7.5) 20–50 cm 27.2 (5.0) 8.36 (0.05) 52.5 (2.5) Shrubland, intershrub microsite 0–5 cm 24.9 (2.1) 8.44 (0.02) 35.0 (2.9) 5–10 cm 25.3 (2.3) 10–20 cm 27.2 (3.0) 8.39 (0.04) 38.0 (3.7) 20–50 cm 30.6 (4.8) 8.57 (0.07) 50.3 (2.3) ANOVA Site/microsite 0.019 <0.001 0.755 Depth 0.103 0.007 <0.001 Site/microsite × depth 0.991 0.054 0.230
Fig. 3. Effect of harvested biomass on the relationship between
aboveground tree biomass and SOC in five forest plots. Regression analysis has been presented where statistically significant.
Variation in standing aboveground biomass among for-est plots did not correlate with the SOC stocks in those plots, although C addition to the forest soil should originate from tree biomass (Fig. 3). However, adding harvested to standing biomass in each plot resulted in a significant
loga-Fig. 4. Relative content and13C composition of SOC fractions in the top 10 cm of forest and shrubland soil. The two-way ANOVA for relative content of SOC fractions for site/microsite, particle size and their interaction (top panel) resulted in respective P val-ues of 0.99, <0.001 and 0.12. The two-way ANOVA for δ13C for site/microsite, particle size and their interaction (bottom panel) re-sulted in respective P values of <0.001, <0.001 and 0.31.
rithmic relationship between aboveground C and SOC to a depth of 20 cm (Fig. 3), and a linear relationship between aboveground C and SOC in the 0–10 cm layer (r2=0.93,
P =0.008). This shows that the legacy of harvested biomass
is apparent in forest SOC.
Total N stocks in the various soil layers did not differ sig-nificantly between forest and shrubland, except for more N in the forest litter layer than in the equivalent layer in the shrubland (Table 4). The aboveground forest N stock was larger than the equivalent shrubland N stock, mainly as a con-sequence of relatively large amounts of N in tree branches and leaves. The ecosystem N stock in the forest was 12% larger than the shrubland N stock, a mean annual increase rate of 1.06 g N m−2yr−1, but this difference was not statis-tically significant (P =0.26). N stored in aboveground struc-tures contributed only a minor part of total ecosystem N stocks (2.5% in the forest, 0.3% in the shrubland). Therefore,
Table 2. N concentration, C/N ratio and C isotopic composition in plant organs of the main forest and shrubland taxa. Mean (s.e.), n=3–5
plots.
Plant organ N conc. (%) C/N ratio δ13C (‰)
Forest Shrubland Forest Shrubland Forest Shrubland
P. halepensis S. spinosum Intershrub P. halepensis S. spinosum Intershrub P. halepensis S. spinosum Intershrub
community community community
Leaves 0.96 (0.05) 1.81 (0.13) 1.52 (0.04)z 53 (3) 22.2 (1.6) 33.8 (0.8)z −22.9 (0.2) −26.8 (0.5) −28.6 (0.1)z Branches 0.29 (0.02) 0.73 (0.03) 169 (12) 64.8 (2.6) −23.3 (0.1) −25.5 (0.3)
Stem 0.07 (0.003) 682 (30) −22.3 (0.1)
Fine roots 1.09 (0.06) n.a. 1.34y 34.3 (1.6) n.a. 29.5y −24.3 (0.1) n.a. −28.1y Fresh leaf 0.49 (0.03) 0.63 (0.02) 1.59 (0.27) 102 (6) 63.5 (1.5) 26.8 (4.8) −23.0 (0.2) −26.3 (0.1) −28.3 (0.4) litter
zData from (Gr¨unzweig and K¨orner, 2001) yData from herbaceous roots in one forest plot
Table 3. Analysis of variance and multiple comparisons of C and N concentrations in the mineral soil of the forest and the shrubland
microsites.
Variable Source of variation df F ratio P value Site/microsite differences (Tukey HSD)z
F S I C Site/microsite 2 10.66 <0.001 a a b
Soil depth 3 14.28 <0.001
Site/microsite × soil depth 6 1.196 0.330
N Site/microsite 2 4.503 0.018 ab a b Soil depth 3 16.46 <0.001
Site/microsite × soil depth 6 0.742 0.619
C/N Site/microsite 2 60.63 <0.001 a b b Soil depth 3 3.927 0.016
Site/microsite × soil depth 6 0.911 0.498
δ13C Site/microsite 2 14.30 <0.001 a b b Soil depth 3 17.73 < 0.001
Site/microsite × soil depth 6 0.774 0.596
z Tukey’s honestly significant difference test for posthoc multiple comparisons; F = forest, S = shrubland under shrubs, I = shrubland
intershrub soil
harvesting aboveground biomass during thinning campaigns removed only a small amount of N (Table 4).
3.5 Soil organic carbon fractions and dynamics
The major part (58–64%) of the total SOC content in the top 10 cm of the soil profile was in the mineral-associated fraction (<50 µm), with no significant difference between sites and microsites (Fig. 4, top panel). Particulate organic C per total SOC was slightly but statistically not significantly higher in the forest (28%) than in the shrubland (18–19%). Because of a higher total SOC stock, the absolute values of all SOC pools were higher in the forest than in the shrubland (data not shown).
SOC fractions in the forest were significantly enriched in13C compared with the shrubland microsites (P < 0.001; Fig. 4, bottom panel). δ13C ranged from −24.9 to −24.3‰ in forest soil and from −26.6 to −24.9‰ in soil under shrubs. The13C signature increased with decreasing particle size for all sites and microsites.
Applying two different mass balances to total SOC and its fractions in the forest topsoil allowed estimating the portion of SOC that originated from afforestation as compared with SOC remaining from the native shrubland. Thirty-five years after afforestation, 68% on average of organic C in forest soil was derived from forest vegetation (Table 5). Assuming that the SOC stock prior to afforestation was equivalent to current
Table 4. Organic C and total N stocks in forest and shrubland. To calculate total shrubland C and N stocks, stocks obtained for the shrub and
intershrub microsites were weighted with the respective percentage ground cover. Mean (s.e.), n= 5 plots.∗,∗∗,∗∗∗statistically significant differences between forest and shrubland at P ≤0.05, 0.01, 0.001, respectively.
Compartment Organic carbon stocks (g m−2) Total nitrogen stocks (g m−2)
Forest Shrubland Forest Shrubland 1. Standing stock Aboveground Stem 805 (80) 1.19 (0.07) Branchesy 565 (83) 3.37 (0.44) Foliage 158 (13) 3.00 (0.23) Total 1553 (178)∗∗∗ 60 (20) 7.55 (0.73)∗∗∗ 0.93 (0.33) Belowground Stem-root 215 (16)∗∗∗ 7.6 (2.5) 0.32 (0.01)∗∗ 0.12 (0.04) transition section Soily Litter layer 125 (21)∗∗∗ 23 (6) 2.5 (0.4)∗∗ 0.9 (0.3) 0–5 cm 825 (110)∗ 450 (58) 70.7 (6.2) 54.3 (6.2) 5-10 cm 540 (66) 391 (66) 50.7 (6.1) 49.2 (5.9) 10–20 cm 993 (106) 648 (118) 86.1 (9.0) 76.5 (8.4) 20–50 cm 1589 (218)∗ 803 (220) 132.8 (14.0) 131.7 (34.6) Total soil 4072 (353)∗∗ 2316 (183) 342.8 (13.3) 312.6 (28.5) Ecosystem 5839 (437)∗∗∗ 2383 (159) 350.7 (12.5) 313.7 (25.4) 2. Harvested tree 1676 (532) n.a. 8.43 (2.66) n.a. stock
yBranches include twigs and cones, mineral soil includes live and dead root stocks.
Table 5. SOC dynamics for the 0–10 cm layer in the forest soil. Mean residence time (MRT; applying Eq. 3 to the outcome of Eqs. 1 and 2)
relates to the original shrubland SOC in forest soil.
Mass Forest-derived SOC in Shrubland-derived SOC in forest soil balance forest soil
Stock Fraction Stock Fraction Fraction MRT of original (g C m−2) of total (g C m−2) of total of original shrubland SOC
forest SOC forest SOC shrubland (yr)
(%) (%) SOC (%)
Eq. (1) 980 72 385 28 46 45 Eq. (2) 864 63 501 37 59 67
Mean 922 68 443 32 53 56
shrubland SOC indicated that 53% of the original native SOC was still present in the forest. Mean MRT of the native shrub-land SOC in the forest soil was 56 years as calculated by a first-order decay model (Table 5).
The C inventory and the SOC partitioning enabled estimat-ing total C produced by the forest as 6250 g C m−2or on
av-erage 179 g C m−2yr−1. This approximation of “gross forest production” used total harvested biomass and assumed that all C stocks in the forest were newly forest-derived C, except for 32% of the mineral soil which was comprised of native shrubland SOC (obtained for the 0–10 cm layer and applied to a depth of 50 cm; Table 5).
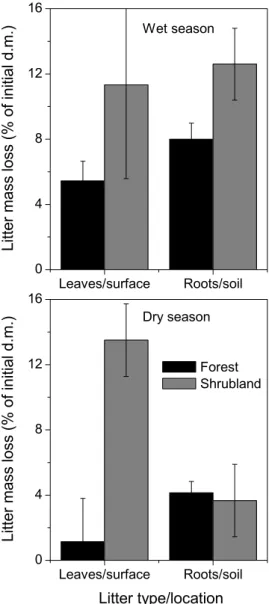
Fig. 5. Mass loss of local litter at forest and shrubland sites during
the wet and the dry seasons. Since at both shrubland microsites, a common mixture of shrub + herbaceous leaf litter and a common mixture of root litter were used, litter mass loss in the shrubland was presented across both microsites (after weighting for the relative spatial cover of each microsites). Mean ± s.e., n=3–5 plots.
3.6 Litter decomposition
Litter-bag assays with local litter revealed significantly lower decomposition rates of forest compared with shrubland litter across seasons and litter type (Fig. 5, Table 6). Short-term leaf- and root-litter mass loss was 37–52% lower in the forest than in the shrubland during the wet season. During the dry season, leaf-litter decomposition was surprisingly high in the shrubland, even higher than litter decomposition during the wet season. Decay rate of needles in the forest during the dry season was low, 92% lower than decay rate of leaf litter in the shrubland.
Fig. 6. Mass loss of standard litter at forest and shrubland microsites
during the wet and the dry seasons. Mean ± s.e., n=4–5 plots.
Standard litter decomposition was significantly higher in the forest than in the two shrubland microsites during the wet season, particularly at the soil surface (Fig. 6, Table 6). Mass loss at the soil surface (location of leaf litter) was 3.6 times greater in the forest than in the two microsites of the shrubland. Mass loss of standard litter in the soil (location of root litter) was greater than at the surface, and was 15% greater in the forest than in the shrubland. Standard-litter decomposition was low in the dry season, with no significant differences between sites and between litter locations.
4 Discussion
Afforestation of sparse shrubland in this hot semi-arid re-gion increased standing ecosystem C stocks by 3460 g C m−2 or on average 99 g C m−2yr−1 over 35 years. This integra-tive value for decades of C sequestration takes biomass har-vest into account, and can be considered, therefore, equiv-alent to long-term net biome production (Schulze et al., 2000). The long-term C stocks including C stored in wood products (Houghton, 1995) amounted to 4230 g C m−2 or
Table 6. Analysis of variance of the litter-bag assays in the forest and the shrubland during the wet and dry seasons. Mass loss of local
litter in the shrubland was combined for both microsites, mass loss for standard litter was analyzed separately for the microsites (see Figs. 5 and 6). Standard litter was analyzed with two-way ANOVA after interactions among variables in the three-way analysis were statistically significant.
Litter Time Source of variation df F ratio P value
source period
Local Both Season 1 3.37 0.077 litter seasons Litter type/location 1 0.14 0.713
Site 1 7.57 0.010
Season x litter type/location 1 1.71 0.201 Season x site 1 0.03 0.865 Site x litter type/location 1 3.02 0.093 Season x site x litter type/location 1 2.01 0.167 Standard Wet Litter location 2 9.66 < 0.001
litter season Site/microsite 1 216.5 < 0.001
Litter location x site/microsite 2 1.91 0.172 Dry Litter location 2 4.20 0.053 season Site/microsite 1 0.09 0.915 Litter location x site/microsite 2 0.33 0.725
on average 121 g C m−2yr1, while “gross forest production”, i.e. total C stocks generated by the forest, was estimated at 6250 g C m−2or on average 179 g C m−2yr−1.
The rate of C gain by the forest was lower than many records of annual increase in ecosystem C stocks follow-ing afforestation in temperate regions (Hooker and Comp-ton, 2003; Paul et al., 2003), mainly because of lower above-ground C stocks. However, tree biomass is a transient and periodically fluctuating C store, and C needs to be allocated to the soil to enable greater continuity of storage.
Soil organic C sequestration of 1760 g C m−2 or 50 g C m−2yr−1 was remarkably high compared with most forests established by afforestation or abandonment of agricultural land in temperate regions (Schlesinger, 1990; Post and Kwon, 2000; Thuille et al., 2000; Vesterdal et al., 2002; Hooker and Compton, 2003; Paul et al., 2003) or by woody encroachment of dry grassland (Jackson et al., 2002). Dry shrubland can accumulate large amounts of SOC following afforestation with pine, such as plant-ing Pinus coulteri B. Don in large lysimeters filled with shrubland soil (49 g C m−2yr−1; Ulery et al., 1995), or planting Pinus ponderosa (Dougl.) Laws in a cold semi-arid shrubland (107 g C m−2yr−1; Nosetto et al., 2006). However, when pine replaced dense productive vegetation, such as in Mediterranean macchia shrubland, SOC stocks often decreased following afforestation with P. halepensis (Maestre and Cortina, 2004; Goberna et al., 2007). Carbon sequestration following afforestation or woody encroach-ment was mainly, or sometimes entirely, contributed by aboveground biomass increase in temperate regions (Hooker
and Compton, 2003; Jackson et al., 2002; Paul et al., 2003; Thuille and Schulze, 2006). However, in semi-arid regions, belowground C accumulation contributed 50% or more to the ecosystem C gain in the forest or woodland (Jackson et al., 2002; Nosetto et al., 2006; the current study).
Various mechanisms for increased SOC stocks following afforestation have been discussed. Root biomass accumu-lation was an important factor in C sequestration following afforestation and shrub expansion (Connin et al., 1997; Us-siri et al., 2006), and the sole factor for SOC accumulation in a P. ponderosa plantation under a cold semi-arid climate (Nosetto et al., 2006). In the present study, root biomass was included in the measure of SOC because of the imprac-ticality of separating myriads of fine root segments from soil organic matter. Figure 3 indicates that harvested trees leave their legacy in the soil, which suggests a significant contribu-tion of roots to SOC over the period of forest development. The live plus dead root C stock contributed 12% to total for-est SOC, a value that increased to 34% when comparing root C to the added SOC by the forest relative to shrubland SOC. It appears, therefore, that roots contribute significantly to the SOC stock and to the increase in SOC by afforestation.
Enhanced C sequestration in N-limited systems requires either increased net N input to the ecosystem or increased N use efficiency. The latter can be achieved by an increase in the C/N ratio and/or by redistribution of N from soil with a narrow C/N ratio to vegetation which normally has a wider C/N ratio (Shaver et al., 1992; Halliday et al., 2003). Despite considerable C sequestration, accumulation of N was low and statistically not significant, suggesting no or negligible
net ecosystem N input to the forest. On the other hand, the C/N ratio was considerably wider in P. halepensis trees than in shrubland vegetation, which translated into a wider C/N ratio also in forest soil organic matter. In addition, redistri-bution of an albeit small amount of N from soil to trees was obvious from a significantly larger N stock in forest biomass and litter as compared with the shrubland. It seems, there-fore, that C accumulation in this semi-arid forest was asso-ciated with increased N use efficiency, via widening the C/N ratio of soil organic matter, a buildup of biomass with a wide C/N ratio, such as woody biomass, and redistributing some N from soil to trees. Similarly, C accumulation with no net N input in pine forests following afforestation or agricultural abandonment was attributed to a wider C/N ratio and/or a transfer of N from soil to tree biomass (Hooker and Comp-ton, 2003; Ussiri et al., 2006).
To investigate organic C dynamics in forest and shrubland soils and to partition SOC, we combined size fractionation with the analysis of a small isotopic signal introduced by relatively13C-rich pine roots. Such SOC partitioning was commonly performed using the much larger13C signal of a conversion of C3to C4vegetation or vice versa, and entering
δ13C of soils and vegetation into an isotope mixing model (Balesdent and Mariotti, 1996; Six and Jastrow, 2002). De-spite the small isotopic signal in our C3-only system, the two mixing models (Eqs. 1 and 2) produced only moderately dif-ferent values for SOC partitioning and MRT (Table 5). Our approach indicated three potential factors involved in SOC accumulation in the pine forest. First, net C input into forest soil seemed to be large, with new forest-derived SOC con-tributing a major fraction of total SOC (68%). This value was higher than new organic C in agricultural soil afforested with broad-leaved deciduous species in a temperate region after 20 years (43%) (Del Galdo et al., 2003). Second, 53% of the original shrubland SOC stock remained in the forest soil after 35 years. Third, a significant amount of SOC was pro-tected in the mineral-associated fraction (<50 µm; Fig. 4), thus enhancing long-term storage in the soil. Similar protec-tion of both new and old SOC in mineral-associated pools were found following afforestation of agricultural soil (Del Galdo et al., 2003). Protection of old and/or new SOC in mi-croaggregates was reported as an additional factor contribut-ing to long-term SOC storage (Six et al., 2002; Del Galdo et al., 2003), a factor that was not tested in the current study.
The investigation of short-term decomposition indicated an additional mechanism for organic C storage in the for-est soil. The experiment with standard litter suggfor-ested that the forest provided a better environment for litter decompo-sition than the shrubland, particularly during the wet season. Reduced runoff following afforestation (Farley et al., 2005; Safriel and Moshe, 2005) and slowed dehydration under the forest canopy (Safriel and Moshe, 2005; I. Gelfand, unpub. res.) apparently provided more moisture to the forest soil, thus enhancing litter decomposition. Despite improved con-ditions in the forest compared with the shrubland, tree
lit-ter decomposed more slowly than shrubland litlit-ter. This was probably caused by lower tissue quality, as indicated by a wider C/N ratio of tree leaf and root litter. Moreover, shrub-land litter appeared to be adapted to decomposition in the dry environment. Considering the lack of moisture during the dry season, mass-loss was surprisingly high for local shrub-land leaf litter compared with standard litter on the soil sur-face. This might be explained by an assumingly high suscep-tibility of local litter to photodegradation by UV radiation, a mechanism active in drought-stressed and high-radiation re-gions (Austin and Vivanco, 2006). Standard litter seemed to be less prone to degradation by UV radiation, and forest lit-ter was less exposed to short-wave radiation by about 60% under the tree canopy during the dry season (E. Rotenberg, personal communication).
5 Conclusions
In conclusion, afforestation of a hot semi-arid shrubland resulted in significant C sequestration, particularly below-ground, which can have an economic potential in the frame-work of the Kyoto Protocol, e.g. for poorer countries (Perez et al., 2007). In contrary to the global cooling potential of the CO2uptake, it should also be considered that afforestation can result in increased heat uptake as a consequence of a de-crease in albedo (Betts, 2000; Bala et al., 2007). Enhanced C sequestration could be attributed to the following factors: (1) increase in N use efficiency reflected by widening of the soil and plant C/N ratio and translocation of N from soil organic matter to tree biomass; (2) production of considerable stocks of live and dead root C; (3) large input of new forest-derived C into the overall forest SOC, and protection of both new and old SOC in mineral-associated fractions; (4) reduced decay rates of tree leaf and root litter, probably as a consequence of reduced litter quality. Compared with C sequestration un-der a more humid climate, soils in semi-arid regions have a large potential for C storage. This potential could be used by proper management for increased C sequestration in dry regions of the world.
Appendix A
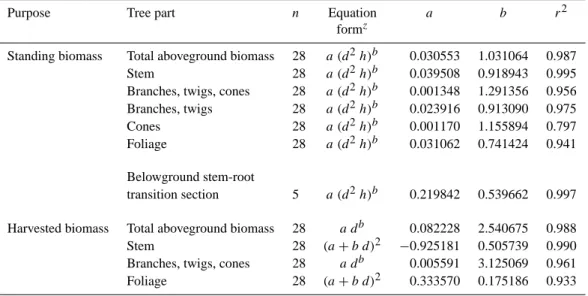
Table A1. Allometric equations for biomass (kg d.m.) of P. halepensis trees.
Purpose Tree part n Equation a b r2
formz
Standing biomass Total aboveground biomass 28 a (d2h)b 0.030553 1.031064 0.987 Stem 28 a (d2h)b 0.039508 0.918943 0.995 Branches, twigs, cones 28 a (d2h)b 0.001348 1.291356 0.956 Branches, twigs 28 a (d2h)b 0.023916 0.913090 0.975 Cones 28 a (d2h)b 0.001170 1.155894 0.797 Foliage 28 a (d2h)b 0.031062 0.741424 0.941 Belowground stem-root
transition section 5 a (d2h)b 0.219842 0.539662 0.997 Harvested biomass Total aboveground biomass 28 a db 0.082228 2.540675 0.988 Stem 28 (a + b d)2 −0.925181 0.505739 0.990 Branches, twigs, cones 28 a db 0.005591 3.125069 0.961 Foliage 28 (a + b d)2 0.333570 0.175186 0.933
za and b are regression coefficients, d is stem diameter at 1.3 m height (cm), h is tree height (m), n is the number of trees used for the
generation of the equation.
Acknowledgements. We thank Y. Moshe and the JNF for
coopera-tion and logistics at the field site, D. Hemming for assistance with the allometric equations, and M. Sternberg and Y. Navon for assis-tance with the litter-decomposition study. We also acknowledge the technical help of E. Negreanu, P. Harel, O. Migdal, N. Kaufmann, N. Zehariah and S. Ben Ari in various parts of this study.
Edited by: F. X. Meixner
References
Austin, A. T. and Vivanco, L.: Plant litter decomposition in a semi-arid ecosystem controlled by photodegradation, Nature, 442, 555–558, 2006.
Balesdent, J. and Mariotti, A.: Measurement of soil organic matter turnover using13C natural abundance, in: Mass Spectrometry of Soils, edited by: Boutton, T. W. and Yamasaki, S.-I., 83–111, Marcel Dekker, New York, 1996.
Bala, G., Caldeira, K., Wickett, M., Phillips, T. J., Lobell, D. B., Delire, C., and Mirin, A.: Combined climate and carbon-cycle effects of large-scale deforestation, Proc. Natl. Acad. Sci. U. S. A., 104, 6550–6555, 2007.
Betts, R. A.: Offset of the potential carbon sink from boreal foresta-tion by decreases in surface albedo, Nature, 408, 187–190, 2000. Cambardella, C. A. and Elliott, E. T.: Particulate soil organic-matter changes across a grassland cultivation sequence, Soil Sci. Soc. Am. J., 56, 777–783, 1992.
Chapela, I. H., Osher, L. J., Horton, T. R., and Henn, M. R.: Ecto-mycorrhizal fungi introduced with exotic pine plantations induce soil carbon depletion, Soil Biol. Biochem., 33, 1733–1740, 2001.
Charley, J. L. and West, N. E.: Plant-induced soil chemical pat-terns in some shrub-dominated semi-desert ecosystems of Utah, J. Ecol., 63, 945–963, 1975.
Collins, H. P., Blevins, R. L., Bundy, L. G., Christenson, D. R., Dick, W. A., Huggins, D. R., and Paul, E. A.: Soil carbon dy-namics in corn-based agroecosystems: results from carbon-13 natural abundance, Soil Sci. Soc. Am. J., 63, 584–591, 1999. Conant, R. T., Klopatek, J. M., Malin, R. C., and Klopatek, C.
C.: Carbon pools and fluxes along an environmental gradient in northern Arizona, Biogeochemistry, 43, 43–61, 1998.
Connin, S. L., Virginia, R. A., and Chamberlain, C. P.: Carbon isotopes reveal soil organic matter dynamics following arid land shrub expansion, Oecologia, 110, 374–386, 1997.
Del Galdo, I., Six, J., Peressotti, A., and Cotrufo, M. F.: Assessing the impact of land-use change on soil C sequestration in agricul-tural soils by means of organic matter fractionation and stable C isotopes, Glob. Change Biol., 9, 1204–1213, 2003.
Farley, K. A., Jobb´agy, E. G., and Jackson, R. B.: Effects of af-forestation on water yield: a global synthesis with implications for policy, Glob. Change Biol., 11, 1565–1576, 2005.
Farley, K. A., Kelly, E. F., and Hofstede, R. G. M.: Soil organic carbon and water retention after conversion of grasslands to pine plantations in the Ecuadorian Andes, Ecosystems, 7, 729–739, 2004.
Geesing, D., Felker, P., and Bingham, R. L.: Influence of mesquite (Prosopis glandulosa) on soil nitrogen and carbon development: Implications for global carbon sequestration, J. Arid Environ., 46, 157–180, 2000.
Goberna, M., S´anchez, J., Pascual, G., and Garc´ıa, C.: Pinus
halepensis Mill. plantations did not restore organic carbon,
soil, Appl. Soil Ecol., 36, 107–115, 2007.
Gr¨unzweig, J. M. and K¨orner, C.: Growth, water and nitrogen re-lations in grassland model ecosystems of the semi-arid Negev of Israel exposed to elevated CO2, Oecologia, 128, 251–262, 2001.
Gr¨unzweig, J. M., Lin, T., Rotenberg, E., Schwartz, A., and Yakir, D.: Carbon sequestration in arid-land forest, Glob. Change Biol., 9, 791–799, 2003.
Gr¨unzweig, J. M., Sparrow, S. D., and Chapin III, F. S.: Impact of forest conversion to agriculture on carbon and nitrogen min-eralization in subarctic Alaska, Biogeochemistry, 64, 271–296, 2003.
Gr¨unzweig, J. M., Sparrow, S. D., Yakir, D., and Chapin III, F. S.: The impact of agricultural land-use change on carbon storage in boreal Alaska, Glob. Change Biol., 10, 452–472, 2004. Guo, L. B. and Gifford, R. M.: Soil carbon stocks and land use
change: a meta analysis, Glob. Change Biol., 8, 345–360, 2002. Halliday, J. C., Tate, K. R., McMurtrie, R. E., and Scott, N. A.:
Mechanisms for changes in soil carbon storage with pasture to
Pinus radiata land-use change, Glob. Change Biol., 9, 1294–
1308, 2003.
Harmon, M. E., Nadelhoffer, K. J., and Blair, J. M.: Measuring de-composition, nutrient turnover, and stores in plant litter, in: Stan-dard Soil Methods for Long-Term Ecological Research, edited by: Robertson, G. P., Coleman, D. C., Bledsoe, C. S., and Sollins, P., pp. 202-240, Oxford University Press, New York, 1999. Harrison, A. F., Harkeness, D. D., Rowland, A. P., Garnett, J. S.,
and Bacon, P. J.: Annual carbon and nitrogen fluxes in soils along the European forest transect, determined using the14C-bomb, in: Carbon and Nitrogen Cycling in European Forest Ecosystems, edited by: Schulze, E.-D., 257–275, Springer Verlag, Berlin, 2000.
Hooker, T. D. and Compton, J. E.: Forest ecosystem carbon and nitrogen accumulation during the first century after agricultural abandonment, Ecol. Appl., 13, 299–313, 2003.
Houghton, J. T., Meira Filho, L. G., Lim, B., Treanton, K., Mamaty, I., Bonduki, Y., Griggs, D. J., and Callender, B. A.: Revised 1996 IPCC Guidelines for National Greenhouse Gas Inventories, Re-porting Instructions, UK Meteorological Office, Bracknell, UK, 1996.
Houghton, R. A.: Changes in the storage of terrestrial carbon since 1850, in: Soils and Global Change, edited by: Lal, R., Kimble, J., Levine, E., and Stewart, B. A., 45–65, CRC Lewis Publishers, Boca Raton, 1995.
Jackson, R. B., Banner, J. L., Jobb´agy, E. G., Pockman, W. T., and Wall, D. H.: Ecosystem carbon loss with woody plant invasion of grasslands, Nature, 418, 623–626, 2002.
Jackson, R. B. and Schlesinger, W. H.: Curbing the U.S. carbon deficit, Proc. Natl. Acad. Sci. U. S. A., 101, 15 827–15 829, 2004. KKL-JNF: A Guide for Wood Volume of the Main Species in Israel, Keren Kayemeth Leisrael-Jewish National Fund, Kiryat Haim, (in Hebrew), 1999.
Lal, R.: Carbon sequestration in dryland ecosystems, Environ. Man-age., 33, 528–544, 2004.
Maestre, F. T. and Cortina, J.: Are Pinus halepensis plantations use-ful as a restoration tool in semiarid Mediterranean areas?, Forest Ecol. Manag., 198, 303–317, 2004.
Midwood, A. J. and Boutton, T. W.: Soil carbonate decomposi-tion by acid has little effect on δ13C of organic matter, Soil Biol. Biochem., 30, 1301–1307, 1998.
Nosetto, M. D., Jobb´agy, E. G., and Paruelo, J. M.: Carbon seques-tration in semi-arid rangelands: Comparison of Pinus ponderosa plantations and grazing exclusion in NW Patagonia, J. Arid En-viron., 67, 142–156, 2006.
Pacala, S. W. and Socolow, R.: Stabilization wedges: solving the climate problem for the next 50 years with current technologies, Science, 305, 968–972, 2004.
Paul, E. A., Morris, S. J., Six, J., Paustian, K., and Gregorich, E. G.: Interpretation of soil carbon and nitrogen dynamics in agricul-tural and afforested soils, Soil Sci. Soc. Am. J., 67, 1620–1628, 2003.
Paul, K. I., Polglase, P. J., Nyakuengama, J. G., and Khanna, P. K.: Change in soil carbon following afforestation, Forest Ecol. Manag., 168, 241–257, 2002.
Perez, C., Roncoli, C., Neely, C., and Steiner, J. L.: Can carbon sequestration markets benefit low-income producers in semi-arid Africa? Potentials and challenges, Agr. Syst., 94, 2–12, 2007. Post, W. M., and Kwon, K. C.: Soil carbon sequestration and
land-use change: processes and potential, Glob. Change Biol., 6, 317– 327, 2000.
Quideau, S. A., Chadwick, O. A., Trumbore, S. E., Johnson-Maynard, J. L., Graham, R. C., and Anderson, M. A.: Vege-tation control on soil organic matter dynamics, Org. Geochem., 32, 247–252, 2001.
Rathore, S. K. S., Singh, S. P., Singh, J. S., and Tiwari, A. K.: Changes in forest cover in a central Himalayan catchment: in-adequacy of assessment based on forest area alone, J. Environ. Manage., 49, 265–276, 1997.
Safriel, U. N. and Moshe, I.: Monitoring and Evaluating Afforesta-tion in a Semiarid Watershed (Yatir Region, Israel), Annual Sci-entific Report, Middle East Watershed Monitoring and Evalua-tion Project, US-AID MERC, 2005.
Scarascia-Mugnozza, G., Bauer, G. A., Persson, H., Matteucci, G., and Masci, A.: Tree biomass, growth and nutrient pools, in: Car-bon and Nitrogen Cycling in European Forest Ecosystems, edited by: Schulze, E.-D., 49–62, Springer Verlag, Berlin, 2000. Schlesinger, W. H.: Evidence from chronosequence studies for
a low carbon-storage potential of soils, Nature, 348, 232–234, 1990.
Schulze, E.-D., Wirth, C., and Heimann, M.: CLIMATE CHANGE: Managing forests after Kyoto, Science, 289, 2058–2059, 2000. Shaver, G., Billings, W., Chapin, F. I., Giblin, A., Nadelhoffer, K.,
Oechel, W., and Rastetter, E.: Global change and the carbon bal-ance of arctic ecosystems, Bioscience, 42, 433–441, 1992. Sheldrick, B. H. and Wang, C.: Particle size distribution, in: Soil
Sampling and Methods of Analysis, edited by: Carter, M. R., 499–511, Canadian Society of Soil Science, Lewis Publishers, Boca Raton, 1993.
Six, J., Callewaert, P., Lenders, S., De Gryze, S., Morris, S. J., Gre-gorich, E. G., Paul, E. A., and Paustian, K.: Measuring and un-derstanding carbon storage in afforested soils by physical frac-tionation, Soil Sci. Soc. Am. J., 66, 1981–1987, 2002.
Six, J. and Jastrow, J. D.: Organic matter turnover, in: Encyclope-dia of Soil Science, edited by: Lal, R., 936–942, Marcel Dekker, New York, 2002.
Smith, D. L. and Johnson, L. C.: Expansion of Juniperus virginiana L. in the Great Plains: Changes in soil organic carbon dynamics, Global Biogeochem. Cy., 17, 1062, 2003.
Heil, J. W., and Elliott, E. T.: Soil carbon and nitrogen. Pools and fractions, in: Standard Soil Methods for Long-Term Eco-logical Research, edited by: Robertson, G. P., Coleman, D. C., Bledsoe, C. S., and Sollins, P., 89–105, Oxford University Press, New York, 1999.
Thuille, A., Buchmann, N., and Schulze, E.-D.: Carbon stocks and soil respiration rates during deforestation, grassland use and sub-sequent Norway spruce afforestation in the Southern Alps, Italy, Tree Physiol., 20, 849–857, 2000.
Thuille, A. and Schulze, E.-D.: Carbon dynamics in successional and afforested spruce stands in Thuringia and the Alps, Glob. Change Biol., 12, 325–342, 2006.
Ulery, A. L., Graham, R. C., Chadwick, O. A., and Wood, H. B.:
Decade-scale changes of soil carbon, nitrogen and exchangeable cations under chaparral and pine, Geoderma, 65, 121–134, 1995. Ussiri, D. A. N., Lal, R., and Jacinthe, P. A.: Soil properties and carbon sequestration of afforested pastures in reclaimed mine-soils of Ohio, Soil Sci. Soc. Am. J., 70, 1797–1806, 2006. Vesterdal, L., Ritter, E., and Gundersen, P.: Change in soil organic
carbon following afforestation of former arable land, Forest Ecol. Manag., 169, 137–147, 2002.
Watson, R. T., Noble, I. R., Bolin, B., Ravindranath, N. H., Verardo, D. J., and Dokken, D. J. (Eds.): Land Use, Land-use Change, and Forestry, Intergovernmental Panel on Climate Change – Cam-bridge University Press, CamCam-bridge, 2000.