HAL Id: insu-01539519
https://hal-insu.archives-ouvertes.fr/insu-01539519
Submitted on 17 Jul 2020
HAL is a multi-disciplinary open access
archive for the deposit and dissemination of
sci-entific research documents, whether they are
pub-lished or not. The documents may come from
teaching and research institutions in France or
abroad, or from public or private research centers.
L’archive ouverte pluridisciplinaire HAL, est
destinée au dépôt et à la diffusion de documents
scientifiques de niveau recherche, publiés ou non,
émanant des établissements d’enseignement et de
recherche français ou étrangers, des laboratoires
publics ou privés.
Megan D. Willis, Franziska Köllner, Julia Burkart, Johannes Bozem, Jennie
L. Thomas, Johannes Schneider, Amir A. Aliabadi, Peter M. Hoor, Hannes
Schulz, Andreas B. Herber, et al.
To cite this version:
Megan D. Willis, Franziska Köllner, Julia Burkart, Johannes Bozem, Jennie L. Thomas, et al..
Ev-idence for marine biogenic influence on summertime Arctic aerosol. Geophysical Research Letters,
American Geophysical Union, 2017, 44 (12), pp.6460-6470. �10.1002/2017gl073359�. �insu-01539519�
Evidence for marine biogenic influence on summertime
Arctic aerosol
Megan D. Willis1 , Franziska Köllner2, Julia Burkart1, Heiko Bozem3 , Jennie L. Thomas4 , Johannes Schneider2 , Amir A. Aliabadi5 , Peter M. Hoor3 , Hannes Schulz6 ,
Andreas B. Herber6, W. Richard Leaitch7, and Jonathan P. D. Abbatt1
1Department of Chemistry, University of Toronto, Toronto, Ontario, Canada,2Max Planck Institute for Chemistry, Mainz,
Germany,3Institute for Atmospheric Physics, Johannes Gutenberg University of Mainz, Mainz, Germany,4LATMOS/IPSL, UPMC, UVSQ, CNRS, Paris, France,5School of Engineering, University of Guelph, Guelph, Ontario, Canada,6Alfred Wegener
Institute Helmholtz-Center for Polar and Marine Research Bremerhaven, Bremerhaven, Germany,7Environment and Climate Change Canada, Toronto, Ontario, Canada
Abstract
We present vertically resolved observations of aerosol composition during pristine summertime Arctic background conditions. The methansulfonic acid (MSA)-to-sulfate ratio peaked near the surface (mean 0.10), indicating a contribution from ocean-derived biogenic sulfur. Similarly, the organic aerosol (OA)-to-sulfate ratio increased toward the surface (mean 2.0). Both MSA-to-sulfate and OA-to-sulfate ratios were significantly correlated with FLEXPART-WRF-predicted air mass residence time over open water, indicating marine-influenced OA. External mixing of sea salt aerosol from a larger number fraction of organic, sulfate, and amine-containing particles, together with low wind speeds (median 4.7 m s−1), suggests a role for secondary organic aerosol formation. Cloud condensation nuclei concentrations were nearly constant (∼120 cm−3) when the OA fraction was<60% and increased to 350 cm−3when the organic fraction was larger and residence times over open water were longer. Our observations illustrate the importance of marine-influenced OA under Arctic background conditions, which are likely to change as the Arctic transitions to larger areas of open water.1. Introduction
The climate impacts of aerosol depend strongly on particle number, size, and chemical composition [e.g.,
Boucher et al., 2013]. In the Arctic, interactions between aerosol, clouds, and climate are complicated by a
com-bination of high surface albedo; the dependence of cloud emissivity on droplet size and aerosol properties [e.g., Curry, 1995; Lubin and Vogelmann, 2006; Kay and Gettelman, 2009]; and the seasonal cycle in aerosol concentration, size, and composition [e.g., Shaw, 1995; Quinn et al., 2007; Sharma et al., 2012; Breider et al., 2014; Croft et al., 2016a]. Aerosol can exert a strong influence on Arctic climate, and changes in anthropogenic aerosol concentrations likely contributed to the magnitude of Arctic warming and impacted sea ice concen-trations in recent decades [Najafi et al., 2015; Acosta Navarro et al., 2016; Gagné et al., 2017]. In parallel with changing anthropogenic inputs, Arctic warming and decreasing sea ice extent [e.g., Stroeve et al., 2012] are expected to impact atmospheric composition due to changes in atmosphere-ocean interactions. The com-plex implications of sea ice loss for atmospheric dynamics, clouds, and aerosol remain poorly constrained [e.g., Struthers et al., 2011; Liu et al., 2012; Browse et al., 2014], owing to both the complexity of the aerosol system and to a paucity of observations in autumn and summer.
In the Arctic lower troposphere, nucleation and Aitken mode particles dominate the size distribution dur-ing summer, in contrast to the accumulation mode-dominated winter and sprdur-ing [Engvall et al., 2008a; Ström
et al., 2011; Heintzenberg and Leck, 2012; Tunved et al., 2013; Kupiszewski et al., 2013; Leaitch et al., 2013; Croft et al., 2016a]. Enhanced wet removal and less frequent long-range transport at lower altitudes combine in late
spring to suppress the condensation sink and facilitate this shift in the aerosol size distribution [e.g., Stohl, 2006; Engvall et al., 2008b]. This seasonal cycle and late-spring transition have been characterized in terms of aerosol number and size not only at Arctic ground sites [e.g., Ström et al., 2003; Tunved et al., 2013; Leaitch
et al., 2013] but also in the lower troposphere [Engvall et al., 2008b]. In summer, low concentrations of particles
at cloud condensation nuclei (CCN)-active sizes [e.g., Leck et al., 2002; Martin et al., 2011; Burkart et al., 2017]
RESEARCH LETTER
10.1002/2017GL073359
Key Points:
• OA and MSA, relative to sulfate, correlated with time spent over open water, indicating a marine source in Arctic background conditions • Organic-rich particles contributed
significantly to boundary layer aerosol mass and were externally mixed from components of sea spray
• Elevated cloud condensation nuclei concentrations occurred when the organic fraction was large and residence times over open water were long Supporting Information: • Supporting Information S1 Correspondence to: M. D. Willis, [email protected] Citation:
Willis, M. D., et al. (2017), Evidence for marine biogenic influence on summertime Arctic aerosol, Geophys.
Res. Lett., 44, 6460–6470,
doi:10.1002/2017GL073359.
Received 9 MAR 2017 Accepted 12 JUN 2017
Accepted article online 14 JUN 2017 Published online 29 JUN 2017
©2017. American Geophysical Union. All Rights Reserved.
can lead to low cloud droplet number concentrations and to a high sensitivity of clouds to available CCN [Mauritsen et al., 2011; Leaitch et al., 2016]. Arctic clouds exert a strong influence on the surface energy bal-ance [Intrieri et al., 2002; Lubin and Vogelmann, 2006] and can influence the thickness, melting, and freezing of sea ice [Kay and Gettelman, 2009; Tjernström et al., 2015]. Despite their importance for Arctic climate, the composition and sources of summer aerosol are not well characterized.
Long-range transport from lower latitudes can be an important source of aerosol and gas phase species to the Arctic during summer, especially in the middle and upper troposphere. However, wet removal within and out-side Arctic regions results in less efficient transport of aerosol compared to other times of the year [e.g., Stohl, 2006; Garrett et al., 2011; Croft et al., 2016a]. Episodic transport of biomass burning and other low-latitude emissions have been characterized previously by both aircraft and ground-based measurements during sum-mer [Warneke et al., 2009, 2010; Hecobian et al., 2011; Kupiszewski et al., 2013; Lathem et al., 2013; Law et al., 2014]. Significant differences in aerosol concentration, composition, and hygroscopicity have been observed between Arctic background and transported aerosol over the North American Arctic [e.g., Brock et al., 2011;
Lathem et al., 2013].
New particle formation, growth, and emission of sea spray are important Arctic aerosol sources in the absence of transport [e.g., Orellana et al., 2011; Leaitch et al., 2013; Croft et al., 2016a] and result in diverse aerosol chemical composition. Under the relatively clean conditions of Arctic summer, ocean-derived dimethyl sul-fide (DMS) can play a significant role in aerosol formation and growth, through its oxidation to sulfuric acid and methansulfonic acid (MSA) [Chang et al., 2011a; Leaitch et al., 2013]. Recent measurements have illustrated the role of regional ammonia emissions from sea bird colonies in particle formation and growth [Wentworth
et al., 2015; Giamarelou et al., 2016; Croft et al., 2016b]. In addition, oxidized iodine species can play a role,
but their sources in Arctic regions remain unclear [Mahajan et al., 2010; Allan et al., 2015]. Organic aerosol in the summertime Arctic is likely the complex result of primary marine emissions and secondary chemical pro-cesses. Wind-driven formation of sea spray is associated with primary emission of organic aerosol from the sea surface [e.g., Shaw et al., 2010; Frossard et al., 2011; Orellana et al., 2011; Karl et al., 2013; Frossard et al., 2014a]. Polysaccharides, protein, and humic-like substances have been observed in aerosol at Alert, Nunavut, and over the Beaufort Sea, suggesting a contribution from primary marine emissions [Fu et al., 2013, 2015]. Marine-influenced organic aerosol, associated with MSA, has been observed over the central Arctic Ocean during summer and could arise from some combination of primary and secondary sources [Chang et al., 2011b]. Detection of molecular tracers for secondary organic aerosol (SOA) has indicated a contribution from secondary processes. In particular, tracers of isoprene, terpene, and fatty acid oxidation have been detected in summer aerosol at several Arctic sites, including Alert, Nunavut; Station Nord, Greenland; and Zeppelin, Svalbard [Fu et al., 2009; Kawamura et al., 2012; Fu et al., 2013; Hansen et al., 2014]. Sources of gas phase pre-cursors to SOA are poorly characterized in Arctic summer but could include Arctic terrestrial [Schollert et al., 2014; Kramshoj et al., 2016] and marine emissions [Willis et al., 2016; Kim et al., 2017; Mungall et al., 2017]. Our understanding of Arctic aerosol-climate interactions is still incomplete, in part due to a lack of observa-tions that can relate aerosol composition to sources during summer. This work focuses on vertically resolved measurements of aerosol composition in the Canadian High Arctic, made during a time period of clean Arc-tic background conditions and over an area where high biological activity was observed in the surface ocean [Gosselin et al., 2015; Mungall et al., 2016]. We use these observations to study the impact of regional sources on Arctic aerosol composition and cloud condensation nuclei.
2. Measurements and Modeling
2.1. Aerosol and Trace Gas Measurements
Measurements of aerosol physical and chemical properties, trace gases, and meteorological parameters were made aboard the AWI Polar6 aircraft based in Resolute Bay, Nunavut, Canada (74∘41’N, 94∘52’W) during 4–21 July 2014. Figure 1a illustrates flight tracks on a map of the average sea ice concentration during July 2014. Relevant measurements are described briefly here; detailed descriptions are presented in Leaitch
et al. [2016], Willis et al. [2016], Burkart et al. [2017], and Köllner et al. [2017]. State parameters and winds
were measured with an AIMMS-20 (Aventech Inc., Barrie, ON, Canada). Carbon monoxide was sampled through a Teflon inlet using an Aerolaser ultrafast CO monitor (model AL 5002). Aerosol was sampled near isokinetically through a stainless steel shrouded diffuser inlet. Leaitch et al. [2010] characterized aerosol inlet performance and for typical airspeeds (∼75 m s−1) it provides near-unity transmission of particles
Figure 1. (a) Map of the Canadian Arctic Archipelago showing the July average sea ice fraction in 2014 from the National Snow and Ice Data Center [Cavalieri et al., 1996; nsidc.org]. Resolute Bay, NU, is marked with a star. (inset) Map of the study area with flight tracks from 4 to 12 July 2014. (b) Seven day integrated total column potential emission sensitivity predicted by FLEXPART-WRF, plotted as a residence time. The color scale indicates the average origin of air sampled along the flight tracks shown in Figure 1a and represents the residence time of air at a particular location before arriving at the aircraft position. The mean residence time is shown for each model grid cell, the magnitude of which is dependent on spatial averaging.
20 nm to 1 μm. Measurements included number concentrations of particles>5 nm (TSI ultrafine condensation particle counter (UCPC) 3787, TSI Inc., Shoreview, MN, USA), particle size distributions for 20–100 nm (Scanning Mobility Spectrometer, Brechtel Manufacturing Inc., Hayward, CA, USA, and TSI CPC 3010), parti-cle size distributions for 100 nm to 1 μm (Ultra-high Sensitivity Aerosol Spectrometer, Droplet Measurement Technologies (DMT), Longmount, CO, USA), cloud condensation nuclei concentrations (DMT CCNC, 0.6% supersaturation, operated at constant pressure [Leaitch et al., 2016]), refractory black carbon mass concen-trations (DMT SP2, 75–700 nm), single-particle aerosol composition using the Aircraft-based Laser Ablation Aerosol Mass Spectrometer (ALABAMA, 200 nm to 1 μm), and nonrefractory aerosol composition using a time-of-flight aerosol mass spectrometer (70–700 nm, Aerodyne ToF-AMS, Billerica, MA, USA).
2.1.1. Aerosol Composition
Operation of the ToF-AMS during this campaign is described in Willis et al. [2016]. The ToF-AMS [DeCarlo et al., 2006] was operated in “V mode” with a mass range of m/z 3–250, a vaporizer temperature of ∼650∘C, and a time resolution of 20 or 30 s. The ToF-AMS sampled behind a pressure-controlled inlet system [Bahreini et al., 2008; DeCarlo et al., 2008], which was characterized by Willis et al. [2016]. Detection limits for sulfate, nitrate, ammonium, methansulfonic acid, and organics were 0.009, 0.008, 0.004, 0.005, and 0.08 μg m−3, respectively, at standard pressure. Methansulfonic acid was quantified using the method of Zorn et al. [2008] and is further described in Figures S1 and S2 in the supporting information and Willis et al. [2016]. The ToF-AMS signal for sea salt, NaCl+(m/z 57.96), can be used to detect sea salt mass concentrations [Ovadnevaite et al., 2012] and is used here as an indication of sea salt. Aerosol mass concentrations were derived from raw mass spectral data using the Igor Pro-based ToF-AMS Analysis Toolkits (v.1.57 and v.1.16) [Seuper, 2010]. A composition-dependent collection efficiency (CDCE) can be applied to correct for nonunity particle detection [Middlebrook et al., 2012]; particles were largely acidic (Figure S3), and application of CDCE led to corrections of 18 ± 10%. Owing to uncertainties arising from mixing state, presence of sea salt (requiring low CE [e.g., Frossard et al., 2014b]), and validation of ToF-AMS mass concentrations by comparison with other instruments (Figure S4), we use relative quantities derived from ToF-AMS measurements in the following analysis.
Single-particle mass spectra were obtained from the ALABAMA [Brands et al., 2011], which uses laser ablation (266 nm) to detect ambient aerosol in a bipolar time-of-flight aerosol mass spectrometer. Particles entering the ALABAMA are detected optically, and owing to limitations in optical detection combined with transmis-sion efficiency in the aerodynamic lens, the ALABAMA detects particles between ∼200 and 1000 nm (vacuum aerodynamic diameter, dva). A total of 6970 particle spectra with size information were collected by the
ALABAMA, and these particles are classified into five main categories (secondary, Na/Cl, Na, EC, and levoglu-cosan containing) based on marker peaks. Pronounced peaks at m/z multiples of 12 (C+∕−n : 12, 24, … , 108) identify elemental carbon (EC). Sodium chloride is identified by peaks at m/z 23, 35, 37, 81, 83, 93, and 95 (Na+, Cl−, Na
2Cl+, and NaCl−2). Potassium is identified by m/z 39 and 41 (K+). Levoglucosan is identified by m/z 45 (CHO−2), 59 (C2H3O−2), 71 (C3H3O−2), and 73 (C3H5O−2). Particles identified as secondary (Figure S5) contain a mixture of sulfate (m/z 97 (HSO−4) and m/z 96 (SO−4)), potassium, MSA (m/z 95 (CH3SO−3)), organic carbon (m/z 27, 37, and 43 (C2H+3, C3H+, and CH3CO+or C3H+7)), and trimethylamine (TMA, m/z 58 and 59 (C3H8N+and C3H9N+)). All secondary particle spectra may not contain peaks for each species. TMA was identified based on laboratory measurements of TMA particles [Köllner et al., 2017] and previously published measurements [e.g., Rehbein et al., 2011; Healy et al., 2015].
2.2. Identifying Air Mass History With FLEXPART-WRF
The Lagrangian particle dispersion model FLEXible PARTicle dispersion model driven by meteorology from the Weather Research and Forecasting model (FLEXPART-WRF) [Brioude et al., 2013] (https://www.flexpart.eu/ wiki/FpLimitedareaWrf) was used to study air mass histories during NETCARE 2014 [Wentworth et al., 2015]. FLEXPART-WRF is based on FLEXPART [Stohl et al., 2005] and uses the limited area meteorological forecast from WRF [Skamarock et al., 2001]. The FLEXPART-WRF simulation is driven by a WRF simulation at 12 × 12 km horizontal resolution. We use FLEXPART-WRF run in backward mode to study the origin of air influencing aircraft-based aerosol measurements. Model output provides a residence time of air prior to sampling that can be used to calculate a potential emission sensitivity (PES) integrated over a period of time prior to sampling. We use backward mode FLEXPART-WRF output, in conjunction with sea ice concentrations from Nimbus 7 SMMR and DMSP SSM/ISSMIS passive microwave data [Cavalieri et al., 1996], to calculate the average residence time of sampled air masses over open water (≤30% sea ice concentration) in the lowest model levels (up to 300 m) and over the last 5 days prior to sampling. For these calculations, we present the average residence time in each model grid cell. One FLEXPART-WRF PES was calculated every 10 min along flight tracks for all flights during 5–12 July 2014; therefore, aerosol observations from 4 July are not included in the analysis with FLEXPART-WRF. Aerosol observations were subsampled to the FLEXPART-WRF time resolution by taking a 2 min average of measurements around the model release time, when the aircraft altitude was within ±100 m of the model release altitude.
3. Results and Discussion
3.1. Overview of Meteorological Situation
We focus on observations made in a period of Arctic background conditions (4–12 July 2014). Air masses sam-pled by the aircraft had resided in the middle-to-northern Canadian Arctic Archipelago for at least the 7 days prior to sampling (Figure 1b). During this period, meteorological observations and measurements of trace gases and black carbon indicated a thermodynamically stable and clean atmosphere, characteristic of Arctic background conditions (Figure S6). The median (interquartile range) wind speed from near the surface to 3 km was 4.7 (2.7–6.3) m s−1(Figure S7). Temperature profiles indicated a surface-based temperature inversion of ∼5∘C up to an altitude of 300–400 m (Figure S6). Aliabadi et al. [2016] made similar observations using Polar6 observations and radiosondes to estimate a boundary layer height of 275 ± 164 m. We will refer to the por-tion of the lower troposphere with a positive vertical gradient in temperature profile as the boundary layer. The median boundary layer wind speed was 4.0 m s−1compared to 5.1 m s−1aloft (Figure S8). WRF wind fields indicate relatively homogeneous low wind speeds during this period (Figure S9). Carbon monoxide concen-trations were generally low (78.4 ± 2.5 ppbv, average ± standard deviation) and showed little variation with altitude (Figure S6). Refractory black carbon concentrations were below thresholds suggested for defining clean marine air [e.g., Gantt and Meskhidze, 2013], with an average concentration of 2.0±1.4 ng m−3(Figure S6). While this stable and clean Arctic background regime is not the only important state of the summertime Arctic, it provides a unique opportunity to study regional sources of Arctic aerosol.
3.2. Secondary Marine Influence on Aerosol Composition
Under Arctic background conditions, average vertical profiles of aerosol composition suggest a surface source of methanesulfonic acid (MSA) and organic aerosol (OA). MSA is not a conservative tracer for dimethyl sulfide (DMS) influence on aerosol sulfur [e.g., Bates et al., 1992], but its enhanced presence in the boundary layer rel-ative to sulfate demonstrates marine influence on submicron aerosol. We consider changes in relrel-ative aerosol composition with altitude to distinguish variations related to absolute source strengths of aerosol and precur-sors, available oxidants, and wet deposition in the boundary layer. The mean OA-to-sulfate and MSA-to-sulfate
Figure 2. (a) Profile of MSA-to-sulfate ratio derived from ToF-AMS measurements. Symbols show the mean profile across flights, and shading represents the range (5th to 95th percentiles). (b) Profile of the OA-to-sulfate ratio. (c) Linear correlation between observed MSA-to-sulfate ratio and FLEXPART-WRF predicted air mass residence time over open water (<30% sea ice concentration) in the lowest 300 m. The color scale represents observed wind speed. Each point represents an average of ToF-AMS observations near the point of each FLEXPART-WRF release, which were available at 10 min intervals along flight tracks. Shading represents the 95% confidence interval for the linear regression. (d) Linear correlation between observed OA-to-sulfate ratio and FLEXPART-WRF predicted air mass residence time over open water.
ratios peaked in the boundary layer, largely below ∼400 m (Figures 2a and 2b), and decreased with altitude. Absolute mass concentrations of MSA and OA were relatively constant or increased in the lowest altitudes, while sulfate decreased toward the surface within the boundary layer (Figure S3). This change in composition was coincident with a shift in the particle size distribution toward smaller sizes [Burkart et al., 2017]. Of the species detected by the ToF-AMS, organic aerosol accounted for ∼65% of the total nonrefractory aerosol mass near the surface, on average. This contribution decreased distinctly above the boundary layer (Figure 2b). The mean OA-to-sulfate ratio vertical profile, showing higher ratios near the surface and a decrease with altitude, suggests a surface source of organic species.
To gain further insight into OA sources, we use FLEXPART-WRF to investigate air mass history and its relation-ship to aerosol composition. The fraction of OA and MSA in submicron aerosol was significantly correlated (p< 0.001) with FLEXPART-WRF predicted air mass residence time over open water (Figures 2c and 2d). Here we have defined open water as sea ice concentrations≤30% and have considered air mass residence times in the lower 300 m as a best estimate for the boundary layer height. Similar results were obtained with the sea ice concentrations ranging from 0% to≤50% and model heights from 100 to 500 m. The relationship between MSA-to-sulfate ratio and residence time over open water (R2= 0.64, Figure 2c) is consistent with our current understanding of a marine DMS source in the Canadian Arctic summer where strong biological activity was observed in the surface ocean [Gosselin et al., 2015; Mungall et al., 2016]. Likewise, the relationship between OA-to-sulfate and residence time over water (R2= 0.74, Figure 2d) suggests a regional marine source of OA.
Figure 3. Relationship between the ToF-AMS estimated oxygen-to-carbon (O/C) and hydrogen-to-carbon (H/C) ratios of organic species [Canagaratna et al., 2015] colored by the MSA-to-sulfate ratio, above 300 m (triangles) and below 300 m (circles). All observations above ToF-AMS detection limits are shown for the period 4–12 July. Grey lines represent the ambient range of O/C and H/C observed by Ng et al. [2011]. Elemental composition ofC8–C30saturated alcohols, C8–C32saturated acids,C2–C11saturated diacids, aC4unsaturated diacid (maleic and fumaric acid),C4–C12 carbohydrates (e.g., trehalose, erythritol, arabitol, mannitol, sucrose, galactose, glucose, and fructose), andC5andC10 ketoacids (levulinic and pinonic acid, respectively) are shown for reference [Kawamura et al., 1996; Fu et al., 2013;
Jayarathne et al., 2016].
Air mass residence times over open water were less than ∼5 h at sampling altitudes above 1000 m (Figure S10) and ranged from near 0 to ∼45 h below 1000 m. Air masses aloft (i.e., above 1000 m) had resided over the Canadian Arctic Archipelago for at least the last 5 days prior to sampling, while likely not entering the bound-ary layer during that time. Sulfate was the dominant component of submicron aerosol above the boundbound-ary layer and especially above 1000 m (Figure S3). While these results suggest marine influence on boundary layer aerosol, it is also possible that aerosol aloft was influenced by marine emissions more than 5 days prior to sampling.
When marine influence was strong, as indicated by residence time over open water, organic species were less oxygenated. The wide range in both hydrogen-to-carbon (H/C) and oxygen-to-carbon (O/C) ratios (∼1 to 1.9 and ∼0.2 to>1, respectively) could indicate a diverse extent of aerosol aging [Jimenez et al., 2009] and/or vari-ation in sources (Figure 3). Less oxygenated organics are present when the MSA-to-sulfate ratio is high within the boundary layer and are coincident with larger residence times over open water, suggesting a marine source of organic species with an H/C ratio approaching 2. Consistent with these observations, O/C ratios decreased, while H/C ratios increased with increasing residence time over open water (Figure S11). While we lack measurements of specific molecular tracers, when the MSA-to-sulfate ratio is high our observed elemen-tal composition is consistent with molecules such as saturated acids, diacids and ketoacids that have been measured in summertime Arctic aerosol and inconsistent with molecules such as saturated alcohols and car-bohydrates [Kawamura et al., 1996; Fu et al., 2013; Jayarathne et al., 2016]. Our observations of high H/C and low O/C organic aerosol could be consistent with expectations about primary marine organics [e.g., Rinaldi et al., 2010; Decesari et al., 2011]; however, single-particle measurements indicate that sea salt-containing aerosol made a relatively small contribution to detected particles (Figure 4).
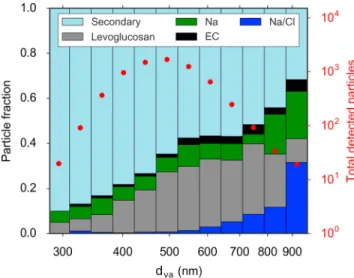
Measurements of single-particle mixing state indicate a dominant number fraction of secondary particles that do not contain sea salt (Figure 4). Secondary particles, containing mixtures of sulfate, ammonium, potassium, MSA, trimethylamine, and other organic species (Figure S5) accounted for 67% of particles detected by the ALABAMA and were externally mixed from sodium chloride-containing particles. Sea salt particles account
Figure 4. Size-resolved single-particle aerosol composition from 6970 particles detected by the ALABAMA, in terms of vacuum aerodynamic diameter (dva), for the period 4–12 July. Particle types are defined based on marker peaks in the bipolar mass spectra and are defined as Na/Cl-containing (blue), Na-containing (green), levoglucosan-containing (gray), elemental carbon-containing (black), and secondary particles containing peaks for potassium, sulfate, ammonium, trimethylamine, methanesulfonic acid, and other organic compounds (light blue). Na/Cl-containing particles also contained detectable organic carbon signals, likely from carbohydrates. The mean mass spectrum of 4665 secondary particle spectra is shown in Figure S5. The total number of particles detected by the ALABAMA in each size bin is shown in red dots.
for ∼1% of detected particles and were mixed with sulfate and carbohydrate-like OA [Köllner et al., 2017]. This external mix-ing is consistent with the lack of corre-lation between ToF-AMS OA and NaCl+ (R2 = 0.003, Figure S12). Although we cannot rule out processes occurring in marginal ice zones, wind speeds were generally below those expected to pro-duce significant primary marine aerosol (PMA, Figures 2c and 2d color scale and Figure S8) when both the OA-to-sulfate ratio and residence time over open water were high [e.g., de Leeuw et al., 2011;
Lewis and Schwartz, 2013; Grythe et al.,
2014]. Consistent with this observation, concentrations of particles larger than 200 nm (an upper bound for PMA [Modini
et al., 2015]) were small in the boundary
layer (6.9 ± 3.8 cm−3) and accounted for at most 1.3 ± 0.8% of particle number concentrations and 33 ± 14% of particle volume (Text S1 and Figure S13). In addi-tion, the majority of OA-to-sulfate ratios greater than 1.5 occurred on flights dur-ing which aerosol growth was observed [Willis et al., 2016; Burkart et al., 2017]. Together, these observations suggest that marine-influenced secondary organic aerosol formation con-tributes to the growth of particles into the ToF-AMS size range (i.e.,>70 nm).
3.3. Aerosol Composition and Cloud Condensation Nuclei
Cloud condensation nuclei (CCN) concentrations were as high as 350 cm−3when aerosol was marine influ-enced and the organic fraction (mfOrg) was greater than ∼60%. Elevated organic fractions and CCN concentra-tions were associated with high FLEXPART-WRF predicted air mass residence time over open water (Figure 5).
Figure 5. Relationship between cloud condensation nuclei measured at 0.6% supersaturation and the ToF-AMS derived mass fraction of organic aerosol. All observations for the period 4–12 July are shown with open circles. Points where FLEXPART-WRF predictions were available (i.e., every 10 min along flight tracks) are shown with colored circles.
In contrast, CCN concentrations were relatively constant (∼120 cm−3) when organic aerosol contributed less than 60% of nonrefractory submicron aerosol mass (Figure 5). These low CCN con-centrations are consistent with those previously observed in other Arctic regions during summer [e.g., Leck et al., 2002; Martin et al., 2011; Mauritsen
et al., 2011]. Very low CCN
concentra-tions, below 50 cm−3, likely result from recent wet removal and were associated with very low total particle concen-trations [Burkart et al., 2017]. Since organic species and sulfate constitute the majority of nonrefractory aerosol mass, higher CCN concentrations also correspond to times when the frac-tion of sulfate was below 40%. Using the method described in Willis et al. [2016], we estimated the hygroscopicity
parameter for organic species (𝜅Org[Petters and Kreidenweis, 2007]) for three conditions:>150 CCN cm−3and mfOrg> 0.6, 50–150 CCN cm−3and mf
Org> 0.6, and 50–150 CCN cm−3and mfOrg < 0.6 (Table S1). Under all three conditions,𝜅Orgwas less than 0.1, indicating an organic component with low hygroscopicity. Few studies of Arctic CCN have concurrent measurements of aerosol composition. Our observations are broadly consistent with those of Martin et al. [2011] who inferred𝜅Org< 0.2 (0.1% supersaturation) for CCN measured over the Arctic Ocean that were 36% organic aerosol. The relationship between elevated CCN concentrations and organic fraction therefore does not arise due to a strongly hygroscopic organic component; instead, the hygroscopicity arises from the nonnegligible amount of sulfate present. Consistent with the results of Willis
et al. [2016], when CCN concentrations were elevated, particle number concentrations between 20 and 40 nm
and above 50 nm were moderately correlated (R2 = 0.25, p < 0.001, Figure S14), suggesting that growth of particles below 40 nm exerted some control on the numbers of CCN active particles. Since we observe enhancements in CCN numbers with higher fractions of nonhygroscopic OA, we hypothesize that the OA participated in growth of particles to CCN active sizes (i.e.,> ∼ 70 nm, Table S1) and thus contribute to CCN activity through reduction of the Kelvin effect.
4. Conclusions
We present three pieces of evidence for a secondary source of marine biogenic OA in the Canadian High Arctic, during a summertime period of pristine Arctic background conditions. First, in a clean and stable atmo-sphere we observed MSA-to-sulfate and OA-to-sulfate ratios that peaked near the surface and decreased aloft. Second, these ratios were significantly correlated with a measure of the air mass residence time over open water predicted by FLEXPART-WRF, in a regime with spatially and temporally homogeneous low wind speeds. Third, sea salt particles were externally mixed from a larger population of organic, MSA, and amine-containing particles. When marine influence was strong, organic species had low O/C and high H/C ratios. Together, low wind speeds in the region, evidence for aerosol growth [Burkart et al., 2017; Willis et al., 2016], and exter-nal mixing of sea salt from organic and amine-containing particles indicates a role for secondary organic aerosol formation; however, we emphasize that sea salt particles were mixed with carbohydrate-like OA [Köllner et al., 2017] that also contributes to total OA in this marine environment. We observed an association between elevated CCN concentrations, high organic fractions, and long air mass residence time over open water, consistent with secondary organic aerosol processes driving the elevated CCN concentrations. Our understanding of aerosol impacts in Arctic summer and the potential for change in a warming Arctic remains incomplete, in part owing to a paucity of measurements in this remote region. This work provides insight into regional aerosol sources in the summertime Arctic, which are likely to change as sea ice retreats. Future measurements of small particle composition coupled to detailed chemical characterization of gas phase species will improve our understanding of aerosol sources and transformations in remote regions, aiding in our ability to understand resulting aerosol-cloud-climate interactions.
References
Acosta Navarro, J. C., V. Varma, I. Riipinen, O. Seland, A. Kirkevag, H. Struthers, T. Iversen, H. C. Hansson, and A. M. L. Ekman (2016), Amplification of Arctic warming by past air pollution reductions in Europe, Nat. Geosci., 9(4), 277–281.
Aliabadi, A. A., R. Staebler, M. Liu, and A. Herber (2016), Characterization and parameterization of Reynolds stress and turbulent heat flux in the stably-stratified lower Arctic troposphere using aircraft measurements, Boundary Layer Meteorol., 161, 99–126, doi:10.1007/s10546-016-0164-7.
Allan, J. D., et al. (2015), Iodine observed in new particle formation events in the Arctic atmosphere during ACCACIA, Atmos. Chem. Phys.,
15(10), 5599–5609, doi:10.5194/acp-15-5599-2015.
Bahreini, R., E. J. Dunlea, B. M. Matthew, C. Simons, K. S. Docherty, P. F. DeCarlo, J. L. Jimenez, C. A. Brock, and A. M. Middlebrook (2008), Design and operation of a pressure-controlled inlet for airborne sampling with an aerodynamic aerosol lens, Aerosol Sci. Technol., 42(6), 465–471, doi:10.1080/02786820802178514.
Bates, T. S., J. A. Calhoun, and P. K. Quinn (1992), Variations in the methanesulfonate to sulfate molar ratio in submicrometer marine aerosol particles over the south Pacific Ocean, J. Geophys. Res., 97(D9), 9859–9865, doi:10.1029/92JD00411.
Boucher, O., et al. (2013), Clouds and aerosols, in Climate Change 2013: The Physical Science Basis. Contribution of Working Group I to the
Fifth Assessment Report of the Intergovernmental Panel on Climate Change, edited by T. F. Stocker et al., book section 7, pp. 571–658,
Cambridge Univ. Press, Cambridge, U. K., and New York, doi:10.1017/CBO9781107415324.016.
Brands, M., et al. (2011), Characterization of a newly developed Aircraft-Based Laser Ablation Aerosol Mass Spectrometer (ALABAMA) and first field deployment in urban pollution plumes over Paris during MEGAPOLI 2009, Aerosol Sci. Technol., 45(1), 46–64, doi:10.1080/02786826.2010.517813.
Breider, T. J., L. J. Mickley, D. J. Jacob, Q. Q. Wang, J. A. Fisher, R. Y. W. Chang, and B. Alexander (2014), Annual distributions and sources of Arctic aerosol components, aerosol optical depth, and aerosol absorption, J. Geophys. Res. Atmos., 119, 4107–4124, doi:10.1002/2013JD020996.
Acknowledgments
Funding for this work was provided by the Natural Sciences and Engineering Research Council of Canada through the NETCARE project (http://www.netcare-project.ca) of the Climate Change and Atmospheric Research Program, the Alfred Wegener Institute (AWI), and Environment and Climate Change Canada (ECCC). Logistical support in Resolute Bay was provided by the Polar Continental Shelf Project (PCSP) of Natural Resources Canada. We gratefully acknowledge Kenn Borek Air Ltd., the UofT Chemistry machine shop, Lake Central Air Services, and many contributors at AWI, ECCC, PCSP, LATMOS, MPIC, and UofT for their support before and during the study. NETCARE data will be archived on the Government of Canada open data portal in collaboration with ECCC. Until that time and for the model data, please contact the NETCARE PI, J. Abbatt ([email protected]), for data access. Sea ice data are available from the National Snow and Ice Data Center (http://www.nsidc.org). Data were analyzed in Igor Pro 6.37 (http://www.wavemetrics.com/ index.html) and Python 3.5.2 (http://www.python.org/downloads/ release/python-352/).
Brioude, J., et al. (2013), The Lagrangian particle dispersion model FLEXPART-WRF version 3.1, Geosci. Model Dev., 6(6), 1889–1904, doi:10.5194/gmd-6-1889-2013.
Brock, C. A., et al. (2011), Characteristics, sources, and transport of aerosols measured in spring 2008 during the Aerosol, Radiation, and Cloud Processes Affecting Arctic Climate (ARCPAC) Project, Atmos. Chem. Phys., 11(6), 2423–2453.
Browse, J., K. S. Carslaw, G. W. Mann, C. E. Birch, S. R. Arnold, and C. Leck (2014), The complex response of Arctic aerosol to sea-ice retreat,
Atmos. Chem. Phys., 14(14), 7543–7557, doi:10.5194/acp-14-7543-2014.
Burkart, J., et al. (2017), Summertime observations of elevated levels of ultrafine particles in the High Arctic marine boundary layer,
Atmos. Chem. Phys., 17(8), 5515–5535, doi:10.5194/acp-17-5515-2017.
Canagaratna, M. R., et al. (2015), Elemental ratio measurements of organic compounds using aerosol mass spectrometry: Characterization, improved calibration, and implications, Atmos. Chem. Phys., 15(1), 253–272, doi:10.5194/acp-15-253-2015.
Cavalieri, D. J., C. Parkinson, P. Gloersen, and H. Zwally (1996), Sea Ice Concentrations From Nimbus-7 SMMR and DMSP SSM/I-SSMIS Passive
Microwave Data, NASA Natl. Snow and Ice Data Cent. Distrib. Act. Arch. Cent., Boulder, Colo.
Chang, R. Y.-W., S. J. Sjostedt, J. R. Pierce, T. N. Papakyriakou, M. G. Scarratt, S. Michaud, M. Levasseur, W. R. Leaitch, and J. P. D. Abbatt (2011a), Relating atmospheric and oceanic DMS levels to particle nucleation events in the Canadian Arctic, J. Geophys. Res., 116, D00S03, doi:10.1029/2011JD015926.
Chang, R. Y. W., et al. (2011b), Aerosol composition and sources in the central Arctic Ocean during ASCOS, Atmos. Chem. Phys., 11(20), 10619–10636.
Croft, B., R. V. Martin, W. R. Leaitch, P. Tunved, T. J. Breider, S. D. D’Andrea, and J. R. Pierce (2016a), Processes controlling the annual cycle of Arctic aerosol number and size distributions, Atmos. Chem. Phys., 16(6), 3665–3682, doi:10.5194/acp-16-3665-2016.
Croft, B., G. R. Wentworth, R. V. Martin, W. R. Leaitch, J. G. Murphy, B. N. Murphy, J. K. Kodros, J. P. D. Abbatt, and J. R. Pierce (2016b), Contribution of Arctic seabird-colony ammonia to atmospheric particles and cloud-albedo radiative effect, Nat. Commun., 7, 13444. Curry, J. A. (1995), Interactions among aerosols, clouds and climate of the Arctic Ocean, Sci. Total Environ., 160, 777–791.
de Leeuw, G., E. L. Andreas, M. D. Anguelova, C. W. Fairall, E. R. Lewis, C. O’Dowd, M. Schulz, and S. E. Schwartz (2011), Production flux of sea spray aerosol, Rev. Geophys., 49, RG2001, doi:10.1029/2010RG000349.
DeCarlo, P. F., et al. (2006), Field-deployable, high-resolution, time-of-flight aerosol mass spectrometer, Anal. Chem., 78(24), 8281–8289, doi:10.1021/ac061249n.
DeCarlo, P. F., et al. (2008), Fast airborne aerosol size and chemistry measurements above Mexico City and central Mexico during the MILAGRO campaign, Atmos. Chem. Phys., 8(14), 4027–4048, doi:10.5194/acp-8-4027-2008.
Decesari, S., et al. (2011), Primary and secondary marine organic aerosols over the North Atlantic Ocean during the MAP experiment,
J. Geophys. Res., 116, D22210, doi:10.1029/2011JD016204.
Engvall, A.-C., R. Krejci, J. Ström, A. Minikin, R. Treffersen, A. Stohl, and A. Herber (2008a), In-situ airborne observations of the microphysical properties of the Arctic tropospheric aerosol during late spring and summer, Tellus B, 60(3), 392–404, doi:10.1111/j.1600-0889.2008.00348.x.
Engvall, A. C., R. Krejci, J. Strom, R. Treffeisen, R. Scheele, O. Hermansen, and J. Paatero (2008b), Changes in aerosol properties during spring-summer period in the Arctic troposphere, Atmos. Chem. Phys., 8(3), 445–462, doi:10.5194/acp-8-445-2008.
Frossard, A. A., P. M. Shaw, L. M. Russell, J. H. Kroll, M. R. Canagaratna, D. R. Worsnop, P. K. Quinn, and T. S. Bates (2011), Springtime Arctic haze contributions of submicron organic particles from European and Asian combustion sources, J. Geophys. Res., 116, D05205, doi:10.1029/2010JD015178.
Frossard, A. A., L. M. Russell, S. M. Burrows, S. M. Elliott, T. S. Bates, and P. K. Quinn (2014a), Sources and composition of submicron organic mass in marine aerosol particles, J. Geophys. Res. Atmos., 119, 12,977–13,003, doi:10.1002/2014JD021913.
Frossard, A. A., L. M. Russell, P. Massoli, T. S. Bates, and P. K. Quinn (2014b), Side-by-side comparison of four techniques explains the apparent differences in the organic composition of generated and ambient marine aerosol particles, Aerosol Sci. Technol., 48(3), 5–10, doi:10.1080/02786826.2013.879979.
Fu, P. Q., K. Kawamura, J. Chen, and L. A. Barrie (2009), Isoprene, monoterpene, and sesquiterpene oxidation products in the High Arctic aerosols during late winter to early summer, Environ. Sci. Technol., 43(11), 4022–4028, doi:10.1021/es803669a.
Fu, P. Q., K. Kawamura, J. Chen, B. Charrière, and R. Sempéré (2013), Organic molecular composition of marine aerosols over the Arctic Ocean in summer: Contributions of primary emission and secondary aerosol formation, Biogeosciences, 10(2), 653–667, doi:10.5194/bg-10-653-2013.
Fu, P. Q., et al. (2015), Fluorescent water-soluble organic aerosols in the High Arctic atmosphere, Sci. Rep., 5, 9845, doi:10.1038/srep09845. Gagné, M.-E., J. C. Fyfe, N. P. Gillett, I. V. Polyakov, and G. M. Flato (2017), Aerosol-driven increase in Arctic Sea ice over the middle of the 20th
century, Geophys. Res. Lett., doi:10.1002/2016GL071941, in press.
Gantt, B., and N. Meskhidze (2013), The physical and chemical characteristics of marine primary organic aerosol: A review, Atmos. Chem.
Phys., 13(8), 3979–3996, doi:10.5194/acp-13-3979-2013.
Garrett, T. J., S. Brattström, S. Sharma, D. E. J. Worthy, and P. Novelli (2011), The role of scavenging in the seasonal transport of black carbon and sulfate to the Arctic, Geophys. Res. Lett., 38, L16805, doi:10.1029/2011GL048221.
Giamarelou, M., K. Eleftheriadis, S. Nyeki, P. Tunved, K. Torseth, and G. Biskos (2016), Indirect evidence of the composition of nucleation mode atmospheric particles in the High Arctic, J. Geophys. Res. Atmos., 121, 965–975, doi:10.1002/2015JD023646.
Gosselin, M., J. Charette, M. Blais, M. Gourdal, M. Lizotte, M. Levasseur, J. Tremblay, and Y. Gratton (2015), Phytoplankton dynamics at receding ice edges in the Canadian High Arctic, paper presented 3rd Annual NETCARE Workshop, Univ. of Toronto, Toronto, Ontario, Canada. [Available at http://www.netcare-project.ca/workshops/netcare-workshop-2015/, last access: 18 February 2016.]
Grythe, H., J. Ström, R. Krejci, P. Quinn, and A. Stohl (2014), A review of sea-spray aerosol source functions using a large global set of sea salt aerosol concentration measurements, Atmos. Chem. Phys., 14(3), 1277–1297, doi:10.5194/acp-14-1277-2014.
Hansen, A. M. K., et al. (2014), Organosulfates and organic acids in Arctic aerosols: Speciation, annual variation and concentration levels,
Atmos. Chem. Phys., 14(15), 7807–7823, doi:10.5194/acp-14-7807-2014.
Healy, R. M., G. J. Evans, M. Murphy, B. Sierau, J. Arndt, E. McGillicuddy, I. P. O’Connor, J. R. Sodeau, and J. C. Wenger (2015), Single-particle speciation of alkylamines in ambient aerosol at five European sites, Anal. Bioanal. Chem., 407(20), 5899–5909.
Hecobian, A., et al. (2011), Comparison of chemical characteristics of 495 biomass burning plumes intercepted by the NASA DC-8 aircraft during the ARCTAS/CARB-2008 field campaign, Atmos. Chem. Phys., 11(24), 13,325–13,337, doi:10.5194/acp-11-13325-2011. Heintzenberg, J., and C. Leck (2012), The summer aerosol in the central Arctic 1991–2008: Did it change or not?, Atmos. Chem. Phys., 12(9),
3969–3983, doi:10.5194/acp-12-3969-2012.
Intrieri, J. M., C. W. Fairall, M. D. Shupe, P. O. G. Persson, E. L. Andreas, P. S. Guest, and R. E. Moritz (2002), An annual cycle of Arctic surface cloud forcing at SHEBA, J. Geophys. Res., 107(C10), 8039, doi:10.1029/2000JC000439.
Jayarathne, T., et al. (2016), Enrichment of saccharides and divalent cations in sea spray aerosol during two phytoplankton blooms, Environ.
Sci. Technol., 50(21), 11,511–11,520, doi:10.1021/acs.est.6b02988.
Jimenez, J. L., et al. (2009), Evolution of organic aerosols in the atmosphere, Science, 326(5959), 1525–1529, doi:10.1126/science.1180353. Karl, M., C. Leck, E. Coz, and J. Heintzenberg (2013), Marine nanogels as a source of atmospheric nanoparticles in the High Arctic, Geophys.
Res. Lett., 40, 3738–3743, doi:10.1002/grl.50661.
Kawamura, K., H. Kasukabe, and L. Barrie (1996), Source and reaction pathways of dicarboxylic acids, ketoacids and dicarbonyls in Arctic aerosols: One year of observations, Atmos. Environ., 30(10–11), 1709–1722, doi:10.1016/1352-2310(95)00395-9.
Kawamura, K., K. Ono, E. Tachibana, B. Charriere, and R. Sempere (2012), Distributions of low molecular weight dicarboxylic acids, ketoacids and alpha-dicarbonyls in the marine aerosols collected over the Arctic Ocean during late summer, Biogeosciences, 9(11), 4725–4737, doi:10.5194/bg-9-4725-2012.
Kay, J. E., and A. Gettelman (2009), Cloud influence on and response to seasonal Arctic sea ice loss, J. Geophys. Res., 114, D18204, doi:10.1029/2009JD011773.
Kim, M. J., G. A. Novak, M. C. Zoerb, M. Yang, B. W. Blomquist, B. J. Huebert, C. D. Cappa, and T. H. Bertram (2017), Air-sea exchange of biogenic volatile organic compounds and the impact on aerosol particle size distributions, Geophys. Res. Lett., 44, 3887–3896, doi:10.1002/2017GL072975.
Köllner, F., et al. (2017), Particulate trimethylamine in the summertime Canadian High Arctic lower troposphere, Atmos. Chem. Phys. Discuss.,
2017, 1–28, doi:10.5194/acp-2017-505.
Kramshoj, M., I. Vedel-Petersen, M. Schollert, A. Rinnan, J. Nymand, H. Ro-Poulsen, and R. Rinnan (2016), Large increases in Arctic biogenic volatile emissions are a direct effect of warming, Nat. Geosci., 9(5), 349–352.
Kupiszewski, P., et al. (2013), Vertical profiling of aerosol particles and trace gases over the central Arctic Ocean during summer, Atmos.
Chem. Phys., 13(24), 12,405–12,431, doi:10.5194/acp-13-12405-2013.
Lathem, T. L., A. J. Beyersdorf, K. L. Thornhill, E. L. Winstead, M. J. Cubison, A. Hecobian, J. L. Jimenez, R. J. Weber, B. E. Anderson, and A. Nenes (2013), Analysis of CCN activity of Arctic aerosol and Canadian biomass burning during summer 2008, Atmos. Chem. Phys., 13(5), 2735–2756, doi:10.5194/acp-13-2735-2013.
Law, K. S., et al. (2014), Arctic air pollution: New insights from POLARCAT-IPY, Bull. Am. Meteorol. Soc., 95(12), 1873–1895. Leaitch, W. R., et al. (2010), Cloud albedo increase from carbonaceous aerosol, Atmos. Chem. Phys., 10(16), 7669–7684,
doi:10.5194/acp-10-7669-2010.
Leaitch, W. R., et al. (2013), Dimethyl sulfide control of the clean summertime Arctic aerosol and cloud, Elementa, 1, 00017, doi:10.12952/journal.elementa.000017.
Leaitch, W. R., et al. (2016), Effects of 20–100 nm particles on liquid clouds in the clean summertime Arctic, Atmos. Chem. Phys., 16(17), 11,107–11,124, doi:10.5194/acp-16-11107-2016.
Leck, C., M. Norman, E. K. Bigg, and R. Hillamo (2002), Chemical composition and sources of the High Arctic aerosol relevant for cloud formation, J. Geophys. Res., 107(D12), 4135, doi:10.1029/2001JD001463.
Lewis, E. R., and S. E. Schwartz (2013), Measurements and models of quantities required to evaluate sea salt aerosol production fluxes, in Sea Salt Aerosol Production: Mechanisms, Methods, Measurements and Models—A Critical Review, pp. 119–297, AGU, Washington, D. C., doi:10.1002/9781118666050.ch4.
Liu, Y., J. R. Key, Z. Liu, X. Wang, and S. J. Vavrus (2012), A cloudier Arctic expected with diminishing sea ice, Geophys. Res. Lett., 39, L05705, doi:10.1029/2012GL051251.
Lubin, D., and A. M. Vogelmann (2006), A climatologically significant aerosol longwave indirect effect in the Arctic, Nature, 439(7075), 453–456.
Mahajan, A. S., et al. (2010), Evidence of reactive iodine chemistry in the Arctic boundary layer, J. Geophys. Res., 115, D20303, doi:10.1029/2009JD013665.
Martin, M., R. Y. W. Chang, B. Sierau, S. Sjogren, E. Swietlicki, J. P. D. Abbatt, C. Leck, and U. Lohmann (2011), Cloud condensation nuclei closure study on summer Arctic aerosol, Atmos. Chem. Phys., 11(22), 11,335–11,350, doi:10.5194/acp-11-11335-2011.
Mauritsen, T., J. Sedlar, M. Tjernström, C. Leck, M. Martin, M. Shupe, S. Sjogren, B. Sierau, P. O. G. Persson, I. M. Brooks, and E. Swietlicki (2011), An Arctic CCN-limited cloud-aerosol regime, Atmos. Chem. Phys., 11(1), 165–173, doi:10.5194/acp-11-165-2011.
Middlebrook, A. M., R. Bahreini, J. L. Jimenez, and M. R. Canagaratna (2012), Evaluation of composition-dependent collection efficiencies for the aerodyne aerosol mass spectrometer using field data, Aerosol Sci. Technol., 46(3), 258–271, doi:10.1080/02786826.2011.620041. Modini, R. L., et al. (2015), Primary marine aerosol-cloud interactions off the coast of California, J. Geophys. Res. Atmos., 120, 4282–4303,
doi:10.1002/2014JD022963.
Mungall, E. L., B. Croft, M. Lizotte, J. L. Thomas, J. G. Murphy, M. Levasseur, R. V. Martin, J. J. B. Wentzell, J. Liggio, and J. P. D. Abbatt (2016), Dimethyl sulfide in the summertime Arctic atmosphere: Measurements and source sensitivity simulations, Atmos. Chem. Phys., 16(11), 6665–6680, doi:10.5194/acp-16-6665-2016.
Mungall, E. L., et al. (2017), Microlayer source of oxygenated volatile organic compounds in the summertime marine Arctic boundary layer,
Proc. Natl. Acad. Sci. U.S.A., 114, 6203–6208, doi:10.1073/pnas.1620571114.
Najafi, M. R., F. W. Zwiers, and N. P. Gillett (2015), Attribution of Arctic temperature change to greenhouse-gas and aerosol influences,
Nat. Clim. Change, 5(3), 246–249.
Ng, N. L., M. R. Canagaratna, J. L. Jimenez, P. S. Chhabra, J. H. Seinfeld, and D. R. Worsnop (2011), Changes in organic aerosol composition with aging inferred from aerosol mass spectra, Atmos. Chem. Phys., 11(13), 6465–6474, doi:10.5194/acp-11-6465-2011.
Orellana, M. V., P. A. Matrai, C. Leck, C. D. Rauschenberg, A. M. Lee, and E. Coz (2011), Marine microgels as a source of cloud condensation nuclei in the High Arctic, Proc. Natl. Acad. Sci. U.S.A., 108(33), 13,612–13,617.
Ovadnevaite, J., D. Ceburnis, M. Canagaratna, H. Berresheim, J. Bialek, G. Martucci, D. R. Worsnop, and C. O’Dowd (2012), On the effect of wind speed on submicron sea salt mass concentrations and source fluxes, J. Geophys. Res., 117, D16201, doi:10.1029/2011JD017379. Petters, M. D., and S. M. Kreidenweis (2007), A single parameter representation of hygroscopic growth and cloud condensation nucleus
activity, Atmos. Chem. Phys., 7(8), 1961–1971, doi:10.5194/acp-7-1961-2007.
Quinn, P. K., G. Shaw, E. Andrews, E. G. Dutton, T. Ruoho-Airola, and S. L. Gong (2007), Arctic haze: Current trends and knowledge gaps,
Tellus Ser. B, 59(1), 99–114.
Rehbein, P. J. G., C.-H. Jeong, M. L. McGuire, X. Yao, J. C. Corbin, and G. J. Evans (2011), Cloud and fog processing enhanced gas-to-particle partitioning of trimethylamine, Environ. Sci. Technol., 45(10), 4346–4352, doi:10.1021/es1042113.
Rinaldi, M., S. Decesari, E. Finessi, L. Giulianelli, C. Carbone, S. Fuzzi, C. D. O’Dowd, D. Ceburnis, and M. C. Facchini (2010), Primary and secondary organic marine aerosol and oceanic biological activity: Recent results and new perspectives for future studies,
Schollert, M., S. Burchard, P. Faubert, A. Michelsen, and R. Rinnan (2014), Biogenic volatile organic compound emissions in four vegetation types in High Arctic Greenland, Polar Biol., 37(2), 237–249, doi:10.1007/s00300-013-1427-0.
Seuper, D. (2010), ToF-AMS analysis software downloads. [Available at http://cires.colorado.edu/jimenez-group/ToFAMSResources/ ToFSoftware/index.html, accessed Dec 2015.]
Sharma, S., et al. (2012), Influence of transport and ocean ice extent on biogenic aerosol sulfur in the Arctic atmosphere, J. Geophys. Res.,
117, D12209, doi:10.1029/2011JD017074.
Shaw, G. E. (1995), The Arctic haze phenomenon, Bull. Am. Meteorol. Soc., 76(12), 2403–2413.
Shaw, P. M., L. M. Russell, A. Jefferson, and P. K. Quinn (2010), Arctic organic aerosol measurements show particles from mixed combustion in spring haze and from frost flowers in winter, Geophys. Res. Lett., 37, L10803, doi:10.1029/2010GL042831.
Skamarock, W. C., J. B. Klemp, J. Dudhia, D. O. Gill, D. M. Barker, W. Wang, and J. G. Powers (2001), A description of the advanced research WRF version 2, NCAR/TN-468+STR, vol. 88, pp. 7–25, NCAR, Boulder, Colo.
Stohl, A. (2006), Characteristics of atmospheric transport into the Arctic troposphere, J. Geophys. Res., 111, D11306, doi:10.1029/2005JD006888.
Stohl, A., C. Forster, A. Frank, P. Seibert, and G. Wotawa (2005), Technical note: The Lagrangian particle dispersion model FLEXPART version 6.2, Atmos. Chem. Phys., 5(9), 2461–2474, doi:10.5194/acp-5-2461-2005.
Stroeve, J., M. Serreze, M. Holland, J. Kay, J. Malanik, and A. Barrett (2012), The Arctic’s rapidly shrinking sea ice cover: A research synthesis,
Clim. Change, 110(3–4), 1005–1027, doi:10.1007/s10584-011-0101-1.
Ström, J., J. Umegard, K. Tørseth, P. Tunved, H.-C. Hansson, K. Holmen, V. Wismann, A. Herber, and G. König-Langlo (2003), One year of particle size distribution and aerosol chemical composition measurements at the Zeppelin Station, Svalbard, March 2000–March 2001, Phys. Chem. Earth Parts A/B/C, 28(28), 1181–1190, doi:10.1016/j.pce.2003.08.058.
Ström, J., A.-C. Engvall, F. Delbart, R. Krejci, and R. Treffeisen (2011), On small particles in the Arctic summer boundary layer: Observations at two different heights near Ny-Alesund, Svalbard, Tellus B, 61(2), 473–482.
Struthers, H., A. M. L. Ekman, P. Glantz, T. Iversen, A. Kirkevag, E. M. Martensson, O. Seland, and E. D. Nilsson (2011), The effect of sea ice loss on sea salt aerosol concentrations and the radiative balance in the Arctic, Atmos. Chem. Phys., 11(7), 3459–3477, doi:10.5194/acp-11-3459-2011.
Tjernström, M., et al. (2015), Warm-air advection, air mass transformation and fog causes rapid ice melt, Geophys. Res. Lett., 42, 5594–5602, doi:10.1002/2015GL064373.
Tunved, P., J. Ström, and R. Krejci (2013), Arctic aerosol life cycle: Linking aerosol size distributions observed between 2000 and 2010 with air mass transport and precipitation at Zeppelin station, Ny-Alesund, Svalbard, Atmos. Chem. Phys., 13(7), 3643–3660, doi:10.5194/acp-13-3643-2013.
Warneke, C., et al. (2009), Biomass burning in Siberia and Kazakhstan as an important source for haze over the Alaskan Arctic in April 2008,
Geophys. Res. Lett., 36, L02813, doi:10.1029/2008GL036194.
Warneke, C., et al. (2010), An important contribution to springtime Arctic aerosol from biomass burning in Russia, Geophys. Res. Lett., 37, L01801, doi:10.1029/2009GL041816.
Wentworth, G. R., et al. (2015), Ammonia in the summertime Arctic marine boundary layer: Sources, sinks and implications, Atmos. Chem.
Phys. Discuss., 15(21), 29,973–30,016, doi:10.5194/acpd-15-29973-2015.
Willis, M. D., et al. (2016), Growth of nucleation mode particles in the summertime Arctic: A case study, Atmos. Chem. Phys., 16(12), 7663–7679, doi:10.5194/acp-16-7663-2016.
Zorn, S. R., F. Drewnick, M. Schott, T. Hoffmann, and S. Borrmann (2008), Characterization of the South Atlantic marine boundary layer aerosol using an aerodyne aerosol mass spectrometer, Atmos. Chem. Phys., 8(16), 4711–4728.
![Figure 1. (a) Map of the Canadian Arctic Archipelago showing the July average sea ice fraction in 2014 from the National Snow and Ice Data Center [Cavalieri et al., 1996; nsidc.org]](https://thumb-eu.123doks.com/thumbv2/123doknet/14759407.584240/4.918.260.862.132.429/figure-canadian-arctic-archipelago-showing-fraction-national-cavalieri.webp)

![Figure 3. Relationship between the ToF-AMS estimated oxygen-to-carbon (O/C) and hydrogen-to-carbon (H/C) ratios of organic species [Canagaratna et al., 2015] colored by the MSA-to-sulfate ratio, above 300 m (triangles) and below 300 m (circles)](https://thumb-eu.123doks.com/thumbv2/123doknet/14759407.584240/7.918.331.795.135.494/figure-relationship-estimated-hydrogen-organic-species-canagaratna-triangles.webp)