Development of In Vivo Raman Spectroscopy for the Diagnosis
of Breast Cancer and Intra-Operative Margin Assessment
by
Abigail Susan Haka A.B. Chemistry Bryn Mawr College
(1998)
SUBMITTED TO THE HARVARD/MIT DIVISION OF HEALTH SCIENCES AND TECHNOLOGY
IN PARTIAL FULFILLMENT OF THE REQUIREMENTS FOR THE DEGREE OF
DOCTOR OF PHILOSOPHY IN CHEMISTRY AND MEDICAL PHYSICS at the
OFTECHNOLOGY Massachusetts Institute of Technology
-wCFe
~,,st.~ :~...
APR 0 5 2005
January 2005 _
LIBRARIES
© Massachusetts Institute of Technology 2005. All rights reserved.Signature of Author
-Division of Health Sciences and Technology January 5, 2005 Certified by Michael S. Feld Professor of Physics Thesis Supervisor Accepted by -? "k,.' (,/" I Martha L. Gray Co-Director off Health Sciences and Technology Edward Hood Taplin Professor of Iv edical and Electrical Engineering Professor of Electrical E gineering and Computer Science Chairman, Departmental Committee on Graduate Students i
A "
Development of In Vivo Raman Spectroscopy for the Diagnosis of Breast Cancer and Intra-Operative Margin Assessment
by
Abigail Susan Haka
Submitted to the Harvard/MIT Division of Health Sciences and Technology on January 5, 2005 in Partial Fulfillment of the Requirements for the Degree of
Doctor of Philosophy in Medical Physics
ABSTRACT
Breast cancer is the most commonly diagnosed cancer among women in the United States. It is the most common cause of death in women ages 45-55. Optical techniques can potentially play a diagnostic role in several aspects of breast cancer evaluation and treatment. This thesis outlines progress on the use of Raman spectroscopy to diagnose breast cancer. Laboratory studies on fresh-frozen tissues are used to demonstrate that the detailed information provided by Raman spectroscopy yields accurate breast disease diagnosis. A Raman spectroscopic-based diagnostic algorithm was developed which classifies samples into four categories according to specific pathological diagnoses: normal, fibrocystic change, fibroadenoma, and infiltrating carcinoma. Cancerous lesions were separated from non-cancerous tissues with a sensitivity of 94% and a specificity of 95%. Further, use of a spectral model based on the morphological structures that comprise breast tissue allows increased understanding of the relationship between a Raman spectrum and tissue disease state. Based on the excellent results of our laboratory work, two clinical studies were undertaken. These studies translate Raman spectroscopy from a laboratory technique into a clinically useful tool. The first study tests the diagnostic algorithm in a prospective manner on freshly excised tissue. Preliminary results are promising. The second study is the first demonstration of in vivo data acquisition of Raman spectra of breast tissue. The culmination of this research is the demonstration of accurate intra-operative margin status assessment during partial mastectomy surgeries. Application of our previously developed diagnostic algorithm resulted in perfect sensitivity and specificity in this small in vivo data set. These preliminary findings indicate that Raman spectroscopy has the potential to lessen the need for re-excision surgeries resulting from positive margins and thereby reduce the recurrence rate of breast cancer following partial mastectomy surgeries. The experiments and theory presented throughout this thesis demonstrate that Raman spectroscopy is a viable clinical tool that can be used to accurately diagnosis breast cancer and breast disease.
Thesis Supervisor: Michael S. Feld, Ph.D. Title: Professor of Physics
-3-ACKNOWLEDGEMENTS
"He who seeks knowledge begins with humbleness. "
-- Buju Banton
I would like to thank my parents, Cliff and Sue, for their continual guidance, support, and love. They have devoted so much time, effort and thought to my development. It is often overwhelming but always appreciated. I love you mom and dad. I am also grateful to Josh. He endures my times of stress and provides me with much needed perspective on life. I love you very much and I can't wait to begin our lives together (finally). I would like to give a shout out to Aaron, I don't know what I would have done without you during my time at MIT. From late nights in the lab to blowing off steam, Aaron was my partner in crime during graduate school.
I would also like to thank Michael Feld. Michael has devoted innumerable hours (I never knew meetings could be so long) to my scientific development and taught me to think critically about my research. He encouraged me to venture into areas of science where I was less comfortable and patiently helped me to succeed once I was there. For someone who always claims to not know what he is talking about, I have certainly learned a great deal from Michael. Ramachandra Dasari has been an invaluable resource and friend. Maryann Fitzmaurice has been a second advisor to me. She has provided guidance and assistance in all aspects of my research as well as valuable and thoughtful career advice. I am also appreciative to my entire committee for generously giving their time and expertise.
Karen Shafer-Peltier provided much of my early training in the laboratory and I am grateful for her patience and trust. Jason Motz was a close friend and colleague throughout my time at MIT. From anatomy, to lab gossip, to support and advice, we have been through a lot and I cannot thank him enough. Joe Gardecki was my go-to-guy in the lab and endured hours of venting. Thanks to Karen, Jason, Joe, Tae-Woong, Obrad, Zoya, Saumil, Wei and Fran for making 6-018 so much fun. Tae-Woong's dancing, Obrad's gyrations and impressions, and everyone's open minds and hearts make the Raman crew the best group to work with in the lab. Finally, I would like to thank the entire Spectroscopy Laboratory. As a result of our interactions, I have grown as a scientist in my time at MIT.
TABLE OF CONTENTS
Abstract ... 3
Acknowledgements ... 4
List of Figures ... 9
List of Tables ... 12
Abbreviations Used Throughout the Thesis ... 13
Chapter I. Introduction...14
I. A. Objectives ... 15
I. B. Accomplishments ... 17
I. C. Outline ... 18
Chapter II. Breast Cancer ... 23
II. A. Breast Anatomy ... 24
II. A. 1. Normal Breast Tissue ... 25
II. A. 2. Menstrual Cycle, Pregnancy & Menopause ... 27
II. B. Breast Pathology ... 28
II. B. 1. Benign Breast Lesions ... 28
II. B. 2. Breast Cancer ... 31
II. C. Breast Cancer Risk Factors ... 38
II. D. Breast Cancer Screeing ... 40
II. E. Breast Cancer Diagnosis ... 41
II. E. 1. Clinical Examination ... 42
II. E. 2. Imaging Techniques ... 42
II. E. 3. Biopsy ... 52
II. F. Breast Cancer Treatment ... 59
II. F. 1. Staging & Prognosis ... 59
II. F. 2. Surgery...62
II. F. 3. Radiation Therapy ... 65
II. F. 4. Chemotherapy ... 65
II. F. 5. Hormone Therapy ... 66
II. F. 6. Immunotherapy ... 68
II. G. Summary ... 69
Acknowledgements ... 69
References ... 69
Chapter III. Raman Spectroscopy ... 74
III. A. General Theory ... 75
III. A. 1. Raman Spectroscopy ... 75
III. A. 2. Raman Selection Rules & Intensities ... 78
III. A. 3. Resonance Enhanced Raman Scattering ... 80
III. A. 4. Surface Enhanced Raman Spectroscopy ... 81
III. B. Biomedical Considerations ... 83
III. C. Raman Spectroscopy for Breast Cancer Diagnosis: Previous Studies... 88
III. C. 1. Raman Spectroscopy of Breast: Other Laboratories ... 88
-5-III. C. 2. Raman Spectroscopy of Breast: Our Laboratory ... 93
III. D. Research Technologies for Breast Cancer Diagnosis ... 96
III. D. 1. Ductal Lavage ... 97
III. D. 2. Ductoscopy ... 98
III. D. 3. Magnetic Resonance Imaging ... 100
III. D. 4. Positron Emission Tomography ... 102
III. D. 5. Diffuse Optical Tomography ... 103
III. D. 6. Fluorescence & Diffuse Reflectance Spectroscopies... 104
III. E. Raman Instrumentation ... 106
III. E. 1. General Considerations ... 106
III. E. 2. Laboratory NIR Raman System: Confocal Microscope and M acroscopic System ... 106
III. E. 3. Clinical Raman System: Raman Optical Fiber Probe... 110
Acknowledgements ... 115
References ... 116
Chapter IV. Data Processing ... 120
IV. A. Data Preprocessing ... 121
IV. A. 1. Wavenumber Calibration ... 121
IV. A. 2. Spectral Response Correction ... 122
IV. A. 3. Filtering ... 123
IV. A. 4. Fluorescent Background Removal ... 124
IV. A. 5. Normalization ... 125
IV. A. 6. M ean Centering ... 126
IV. A. 7. System Specific Calibrations ... 126
IV. B. Chemometric Techniques ... 127
IV. B. 1. Principal Component Analysis ... 130
IV. B. 2. Ordinary Least Squares Regression ... 132
IV. C. Spectral Modeling: A Morphologic Assay of Breast Tissue ... 133
IV. C. 1. Motivation & Assumptions ... 133
IV. C. 2. Sample Preparation & Data Acquisition ... 135
IV. C. 3. Epithelial Cell Cytoplasm & Cell Nucleus ... 138
IV. C. 4. Fat ... 141
IV. C. 5. [3-Carotene ... 141
IV. C. 6. Collagen ... 141
IV. C. 7. M icrocalcifications ... 142
IV. C. 8. Cholesterol-like Lipid Deposits ... 143
IV. C. 9. W ater ... 144
IV. C. 10. Inter-Patient Variation of Elements ... 145
IV. C. 11. Future Directions: Quantitative Analysis ... 145
IV. D. Diagnostic Algorithm Development ... 147
IV. D. 1. Calibration ... 147
IV. D. 2. Logistic Regression ... 148
IV. D. 3. Validation ... 150
IV. E. Real-Time Analysis ... 151
IV. F. Analytical Method of Estimating Predicition Error: Ac ... 152
IV. F. 1. Introduction ... 153
-6-IV. F. 2. Sample Preparation & Data Acquisition ... 155
IV. F. 3. Theory ... 157
IV. F. 4. Comparison with Chi-Square Analysis ... 161
IV. F. 5. Simulated Data ... 162
IV. F. 6. Experimental Data ... 164
IV. F. 7. Conclusions ... 165
Acknowledgements ... 166
References ... 166
Chapter V. Raman Spectroscopic Breast Cancer Diagnosis: Ex Vivo Studies ... 169
V. A. Raman Spectroscopy of Fresh-Frozen Breast Tissue ... 170
V. A. 1. Sample Preparation & Data Acquisition ... 171
V. A. 2. Model Fits ... 174
V. A. 3. Spectral Fit Coefficients & Tissue Morphology ... 176
V. A. 4. Diagnostic Algorithm ... 181
V. A. 5. Effect of Age/Menopause on Diagnostic Algorithm ... 187
V. B. Raman Spectroscopy of Fresh Breast Tissue ... 188
V. B. 1. Sample Preparation & Data Acquisition ... 189
V. B. 2. Agreement with Fresh-Frozen Diagnostic Algorithm ... 191
V. B. 3. Diagnostic Algorithm Encompassing New Pathologies 194 V. B. 4. Stereotactic Needle Biopsy To Target Calcifications .... 195
V. B. 5. Future Directions ... 198
V. C. Summary ... 199
Acknowledgements ... 199
References ... 199
Chapter VI. Raman Microscopy of Microcalcifications ... 201
VI. A. Microcalcifications ... 202
VI. B. Sample Preparation & Data Acquisition ... 203
VI. C. Raman Spectra ... 205
VI. D. Principal Component Analysis ... 208
VI. E. Diagnostic Algorithm ... 209
VI. F. Chemical Analysis ... 211
VI. G. Summary & Discussion ... 215
Acknowledgements ... 217
References ... 217
Chapter VII. Raman Spectroscopic Breast Cancer Diagnosis: In Vivo Studies ... 220
VII. A. Introduction ... 221
VII. B. Data Acquisition ... 221
VII. B. 1. Raman Optical Fiber Probes ... 223
VII. C. Margins ... 225
VII. C. 1. Introduction ... 225
VII. C. 2. Sample Preparation ... 228
VII. C. 3. Model Fits ... ... 229
VII. C. 4. Diagnostic Algorithm ... 231
VII. C. 5. Discussion ... 233
VII. D. Mastectomies ... 234
-7-VII. D. 1. Sample Preparation ... 234
VII. D. 2. Model Fits ... 236
VII. D. 3. Diagnostic Algorithm ... 237
Acknowledgements ... 239
References ... 239
Chapter VIII. Other Applications of Raman & Fluorescence Spectroscopies ... 242
VIII. A. Fluorescence & Reflectance of Breast ... 243
VIII. A. 1. Introduction ... 244
VIII. A. 2. [-Carotene Absorption ... 248
VIII. A. 3. Data Acquired at the Cleveland Clinic Foundation .. 250
VIII. A. 4. Data Acquired at University Hospitals of Cleveland 253 VIII. A. 5. Future Directions ... 257
VIII. B. Effects of Tissue Freeze-Thaw on Fluorescence ... 257
VIII. B. 1. Sample Preparation & Data Acquisition ... 258
VIII. B. 2. Preliminary Results . ... 259
VIII. C. Fluorescence Lifetime Measurements ... 262
VIII. C. 1. Sample Preparation & Data Acquisition ... .. 262
VIII. C. 2. Preliminary Results . ... 263
VIII. D. Surface Enhance Raman Spectroscopy ... 265
VIII. D. 1. SERS Cell Studies ... 266
VIII. D. 2. SERS Tissue Studies ... 274
VIII. E. Mechanism of Ceroid Formation in Atherosclerotic Plaques: Studies Using a Combination of Raman & Fluorescence Spectroscopies ... 276
VIII. E. 1. Introduciton ... 277
VIII. E. 2. Sample Preparation & Data Acquisition ... 283
VIII. E. 3. Results ... 287
VIII. E. 4. Conclusions ... 296
Acknowledgements ... 297
References ... 298
Chapter IX. Future Directions ... 304
IX. A. The Future of Raman Spectroscopy in Breast Cancer Diagnosis ... 305
IX. A. 1. Transdermal Needle Measurements ... 305
IX. A. 2. Intra-Operative Margin Assessment ... 307
IX. A. 3. Real-Time Analysis ... 308
IX. A. 4. Diagnostic Algorithm Validation & Extension ... 309
IX. B. Spectral Model Refinement ... 309
IX. B. 1. Quantitative Studies ... 309
IX. B. 2. Microscopy Studies ... 310
IX. C. Combining Fluorescence, Reflectance & Raman Spectroscopies .311 References ... 312
Chapter X. Conclusion ... 313
X. A. Review of Goals and Accomplishments ... 313
X. B. Final Remarks ... 314
-8-LIST OF FIGURES
Figure .1. Schematic of the female breast ... 24
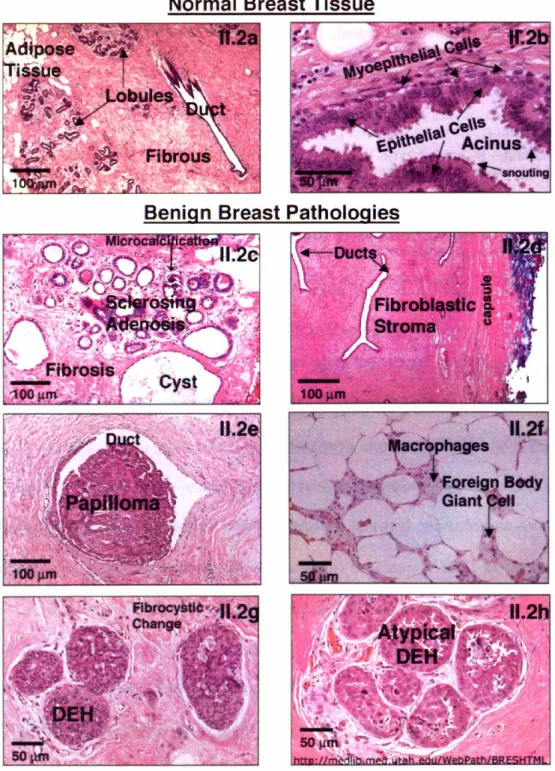
Figure 11.2. Histological images of breast with varying pathologies ... 32
Figure 11.3. Schematic of uncontrolled cell growth and monomorphic expansion ...34
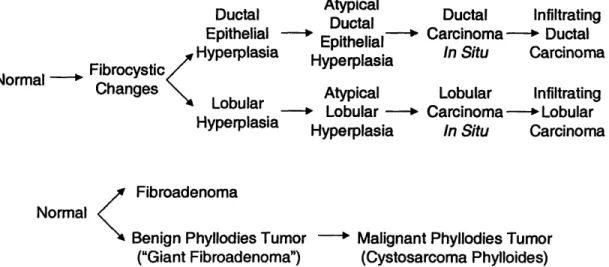
Figure 11.4. Flowchart describing the breast cancer 'continuum' ... 34
Figure 11.5. Flowchart depicting the relationship between the breast lesions encountered in our studies ... 37
Figure II.6. Mammograms exhibiting asymmetric densities ... 44
Figure II.7. Mammogram showing a cyst ... 45
Figure II.8. Mammographic manifestations of microcalcifications ... 45
Figure II.9. Mammograms demonstrating suspicious lesions ... 46
Figure II.10. Mammogram demonstrating a spiculated mass ... 47
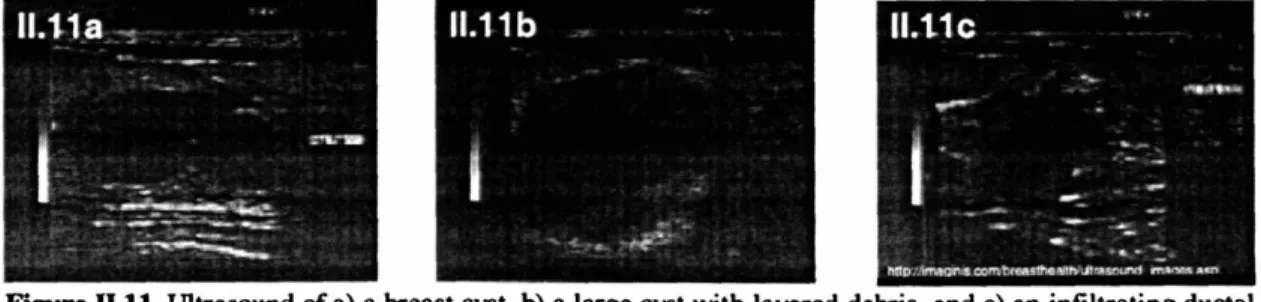
Figure II.11. Ultrasounds of breast lesions ... 51
Figure II.12. A specimen radiograph ... 52
Figure 11.13. Instrumentation used in stereotactic biopsy procedures ... 54
Figure II.14. Biopsy needle and scehmatic of the tissue removal procedure ... 55
Figure 11II.15. Vacuum assisted biopsy schematic ... 56
Figure 11II.16. Schematic representations of mastectomy surgeries ... 63
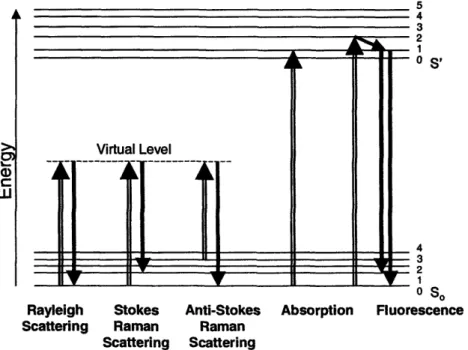
Figure III.1. Molecular energy level diagram depicting several light-matter interactions .... 76
Figure 111.2. Predominant absorption spectra in tissue ...84
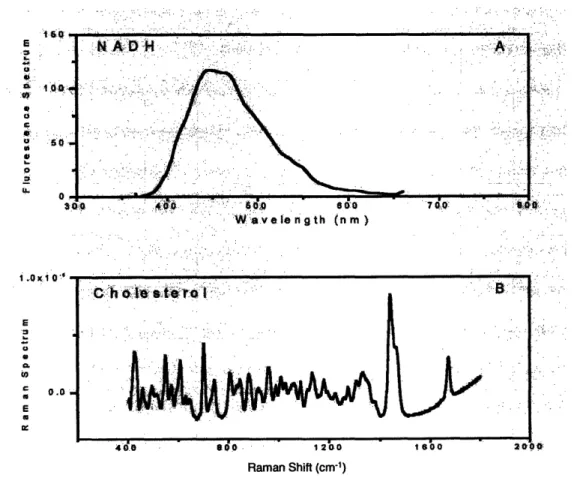
Figure III.3. Comparison of Raman and fluorescence spectra ... 86
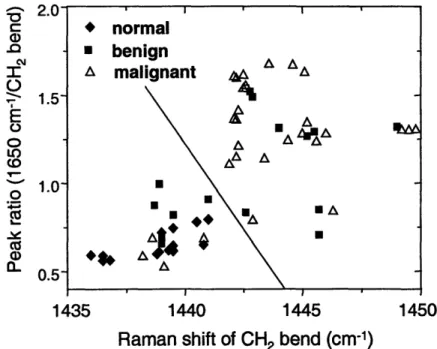
Figure III.4. Elementary breast cancer diagnostic plot ... 94
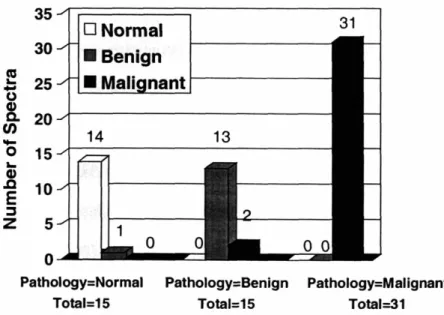
Figure 111I.5. Comparison of pathology and the PCA based Raman diagnosis ... 95
Figure III.6. Ductal lavage schematic ... 97
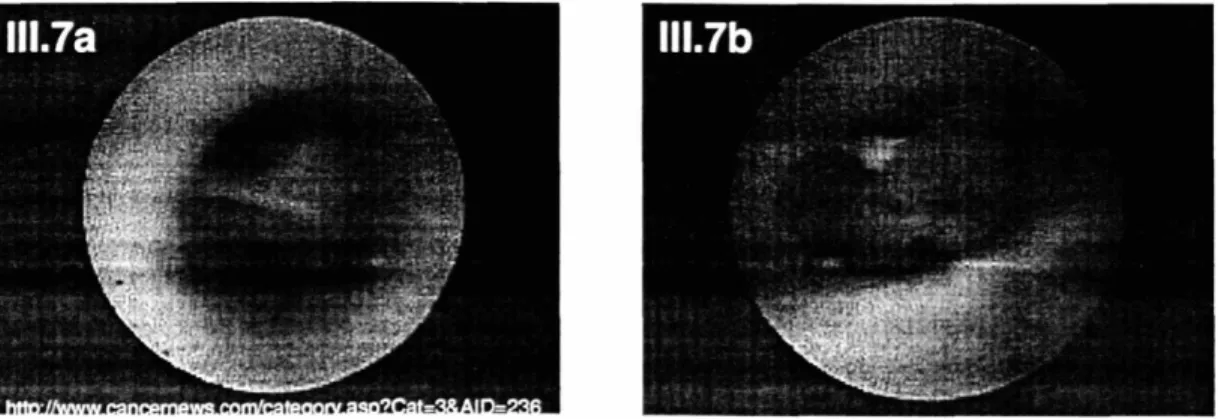
Figure 111.7. Ductoscopy images ... 99
Figure 111.8. Laboratory Raman system ... 107
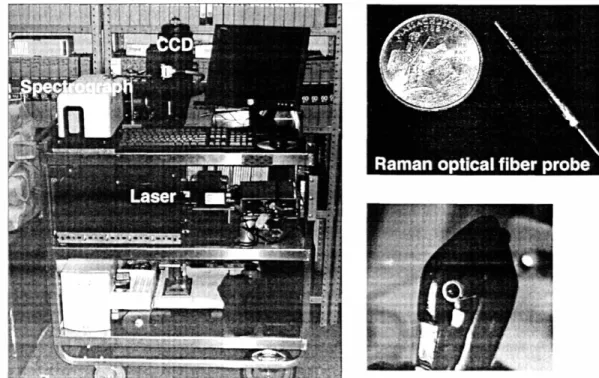
Figure 111.9. Clinical Raman system and Raman optical fiber probe ... 110
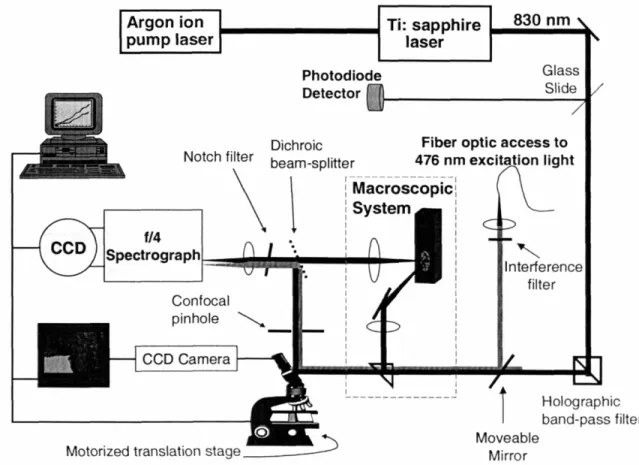
Figure III.10. Schematic of the clinical Raman system ... 111
Figure III.11. Schematic of the Raman optical fiber probe ... 113
Figure IV.1. Raman spectra of species used for wavenumber calibration ...122
Figure IV.2. White light spectra acquired with different instruments ... 123
Figure IV.3. Background removal ... 124
Figure IV.4. Principal component basis spectra of fresh-frozen breast data set ...132
Figure IV.5. Raman map of a normal breast duct ... 137
Figure IV.6. Morphological spectral model of breast tissue ... 138
Figure IV.7. Raman spectra of different cells occuring in the breast ...139
Figure IV.8. Raman spectra of cell nucleus, DNA, cell cytoplasm and actin ...140
Figure IV.9. Raman spectra of collagen ... 142
Figure IV.10. Raman spectra of water ... 144
Figure IV.11. Comparison of simulated and experimental noise ...160
Figure IV.12. Chi-square error analysis ... 161
Figure IV.13. Simulation to validate the prediction error equation, high olf ... 162
Figure IV.14. Simulation to validate the prediction error equation, low olf ... 163
Figure V.1. Raman spectra, fit coefficients and H&E images of fresh-frozen breast tissue. ... 175
-9-Figure V.2. Histogram displaying the average fit coefficients for breast pathologies ... 178
Figure V.3. Diagnostic plot separating infiltrating carinoma and normal ... 181
Figure V.4. Diagnostic plot separating infiltrating carcinoma and fibrocystic change ... 182
Figure V.5. Diagnostic plot separating infiltrating carcinoma and fibroadenoma ... 183
Figure V.6. Diagnostic algorithm encompassing all pathologies ... 184
Figure V.7. ROC curves for breast cancer diagnosis and lesion excision ... 186
Figure V.8. Prospective validation of the diagnostic algorithm on fresh breast tissue ... 192
Figure V.9. Diagnostic plot of data acquired from specimens affected by pre-operative chemotherapy ... 193
Figure V.10. Diagnostic plot of data acquired from re-excision specimens. ... 194
Figure V.11. Diagnostic plot with DCIS samples ... 195
Figure V.12. Raman spectrum with structure indicating microcalcifications ... 196
Figure VI.1. Specimen radiograph and Raman spectrum of a type I microcalcification... 205
Figure VI.2. Specimen radiograph and Raman spectrum of a type II microcalcification. .. 206
Figure VI.3. PCA based diagnostic algorithm separating type II microcalcifications ... 210
Figure VI.4. ROC curve for microcalcifications occuring in benign and malignant lesions. ... 211 Figure VI.5. Diagnostic PC spectrum ... ... 212
Figure VI.6. Diagnostic PC spectrum ... 214
Figure VI.7. Diagnostic PC spectrum. ... 215
Figure VII.1. In vivo Raman spectra and fit coefficients of margin specimens ... 229
Figure VII.2. Diagnostic algorithm in vivo margin sampels ...232
Figure VII.3. Schematic of a mastectomy surgery ... 234
Figure VII.4. Raman spectra exhibiting light contamination ... 235
Figure VII.5. In vivo Raman spectra and fit coefficients of mastectomy specimens ... 236
Figure VII.6. Diagnostic algorithm in vivo mastectomy sampels ... 237
Figure VII.7. Schematic of the ductal system distribution ... 238
Figure VIII.1. Correction of fluorescence for the effects of scattering and absorption ... 246
Figure VIII.2. FastEEM clinical spectrophotometer ... 247
Figure VIII.3. -Carotene absorption spectra ... ....249
Figure VIII.4. Diffuse reflectance data exhibiting -carotene absorption ... 249
Figure VIII.5. Diffuse reflectance spectra of breast tissue and model fits ... 252
Figure VIII.6. Fluorescence spectra of breast collected at CCF ... 252
Figure VIII.7. Fluorescence spectra of breast collected at UHC ... 254
Figure VIII.8. Fluorescence spectra of collagen and NADH . ... 255
Figure VIII.9. Diagnostic plots from FastEEM data separating cancer and fibroadenoma. 256 Figure VIII.10. Fluorescence as a function of time following tissue excision ... 259
Figure VIII.11. Changes in fluorescence with tissue freeze-thaw ... 260
Figure VIII.12. Changes in porphyrin fluorescence with tissue freeze-thaw ... 260
Figure VIII.13. Changes in the hemoglobin oxygen saturation with tissue freeze-thaw. ... 261
Figure VIII.14. Laser system for fluorescence lifetime measurements ... 263
Figure VIII.15. Fluorescence decay of NADH ... 263
Figure VIII.16. Fluorescence decay of cervical tissue ... 264
Figure VII.17. SERS spectra of cells ... 269
Figure VIII.18. Electron micrograph of colloidal gold particles inside a cell ... 271
Figure VIII.19. SERS map of cells ... 271
-10-Figure VIII.20. SERS maps of the distribution of phenylalanine and DNA in cells ...272
Figure VIII.21. SERS spectum of homogenized breast tissue ... 274
Figure VIII.22. SERS map of breast tissue ... 275
Figure VIII.23. SERS spectra exhibiting time dependent fluctuations ... 276
Figure VIII.24. Phase contrast images and fluorescence spectrum of ceroid ...288
Figure VIII.25. Raman spectra of ceroid ... 289
Figure VIII.26. Histogram showing the composition of ceroid deposits in coronary artery. ... 29···0
Figure VIII.27. Histogram showing the composition of ceroid deposits in aorta ...292
Figure VIII.28. Phase contrast images of intra- and extra-cellular ceroid deposits ...294
Figure VIII.29. Histogram showing the composition of intra- and extra-cellular ceroid deposits ... 295
Figure IX.1. Transdermal needle measurements with the front- and side-viewing Raman optical fiber probes ... 306
-II-LIST OF TABLES
Table II.1. Distribution of findings in women seeking evaluation of breast lumps ...28
Table 11.2. Frequency of histologic types of breast cancer ... 37
Table II.3. Bloom-Richardson grade system ... 61
Table II.1. Raman band assignments for morphological structures ... 87
Table III.2. Trends in Raman spectra with breast pathology ... 88
Table IV.1. Comparison of theoretical, simulated and experimental error ... 164
Table V.1. Fit coefficient errors in the fresh-frozen Raman breast data ... 180
Table V.2. Comparison of pathology and the spectral model based Raman diagnosis of fresh-frozen breast tissues ... 185
Table V.3. Comparison of pathology and the prospective spectral model based Raman diagnosis of fresh breast tissues ... 191
Table VII.1. Throughput of the probes used in the in vivo studies ... 223
Table VII.2. Probe throughputs with different laser coupling alignments ... 224
Table VII.3. Fit coefficient errors for the in vivo Raman data ... 231
Table VII.4. Comparison of pathology and the prospective spectral model based Raman diagnosis of in vivo margin tissues ... 233
Table VII.5. Comparison of pathology and the prospective spectral model based Raman diagnosis of in vivo mastectomy tissues ... ... 238
Table VIII.1. Sensitivities and specificities for distinguishing individual pathological categories using IFS and DRS ... 256
Table VIII.2. Fit coefficient errors for the ceroid data ... 286
-12-ABBREVIATIONS USED THROUGHOUT THE THESIS
AGE: Advanced Glycation End-Products
a: Polarizability
BSE: Breast Self-Examination
BRCA1: BReast CAncer 1 BRCA2: BReast CAncer 2 CBE: Clinical Breast Examination CCD: Charge Coupled Device CLS: Classical Least Squares DCIS: Ductal Carcinoma In Situ DEH: Ductal Epithelial Hyperplasia DOT: Diffuse Optical Tomography DNA: Deoxyribonucleic Acid
DRS: Diffuse Reflectance Spectroscopy
EEM: Excitation-Emission Matrix
FDA: Food and Drug Administration
FDG: F-fluorodeoxyglucose
FT: Fourier Transform
FWHM: Full Width at Half Maximum
H&E: Hematoxylin and Eosin HDL: High Density Lipoprotein
Io: Intensity of the excitation laser [W-cm2]
IDC: Invasive Ductal Carcinoma
IFS Intrinsic Fluorescence Spectroscopy
ILC: Invasive Lobular Carcinoma IR: Infrared
KD: Kilodalton
LCIS: Lobular Carcinoma In Situ LDL: Low Density Lipoprotein
LSS: Light Scattering Spectroscopy
MCR: Multivariate Curve Resolution
MRI: Magnetic Resonance Imaging VL: Excitation laser frequency [s1]
NA: Numerical Aperture
NAD(P)H: Nicotinamide Adenine Dinucleotide (Phosphate)
NIR: Near-Infrared
NMBA: N-nitrosomethylbenzylamine
OCT: Optical Coherence Tomography OLS: Ordinary Least Squares
OR: Operating Room ORO: Oil Red O
OxLDL: Oxidized Low Density Lipoprotein P: Dipole Moment
PBS: Phosphate Buffered Saline PC: Principal Component
PCA: Principal Component Analysis PCR: Principal Component Regression
PET: Positron Emission Tomography
PLS: Partial Least-Squares
PUFA: Polyunsaturated Fatty Acid
Q: Normal coordinate of the vibration
RMSEP: Root Mean Standard Error of Prediction
ROC: Receiver Operator Characteristic
Std: Standard Deviation
SERM: Selective Estrogen Receptor Modulator
SERS: Surface Enhanced Raman Scattering SNR: Signal-to-Noise Ratio
SVD: Singular Value Decomposition
T: temperature (K) t: Time [s]
TMS: Tri-Modal Spectroscopy UV: Ultraviolet
VLDL: Very Low Density Lipoprotein
-13-Chapter I. Introduction
The work in this thesis develops analytical Raman spectroscopy into a tool for the diagnosis of breast cancer. Laboratory studies on fresh-frozen tissues are used to demonstrate that the detailed information provided by Raman spectroscopy yields accurate breast disease diagnosis. Further, use of a spectral model based on the morphological structures that comprise breast tissue allows increased understanding of the relationship between a Raman spectrum and tissue disease state. Based on the excellent results of our laboratory work, two clinical studies were undertaken. These studies translate Raman spectroscopy from a laboratory technique into a clinically useful tool. The first study tests the diagnostic algorithm in a prospective manner on freshly excised tissue. Preliminary results are promising. In the second study, data was acquired in vivo during partial mastectomy surgeries. This is the first demonstration of in vivo collection of Raman spectra of breast tissue. These advances culminated in an approach that was employed intra-operatively during partial mastectomy surgeries to accurately assess margin status.
-14-I. A. Objectives
Develop a Spectral Model for Diagnosing Breast Disease
Statistical interpretations of the Raman spectra acquired from biological tissue can diagnose disease. Indeed, previous investigations using principal component analysis demonstrated that Raman spectroscopy is capable of accurately diagnosing breast cancer. Although it is possible to use statistical methods of analysis to provide diagnoses, there is a wealth of information in Raman spectra that enables enhanced understanding of disease etiology. One goal of this research is the development of a spectroscopic model based on tissue morphology. We utilize confocal Raman microscopy to examine the various morphological structures present in normal and diseased breast tissues. Our model identifies the morphological components present in breast tissue through their unique Raman spectra and uses them as basis spectra to describe the morphology of macroscopic data. Such a model translates spectroscopic analysis into terminology commonly used by pathologists and can be used to diagnose breast cancer.
Derive of an Analytical Method of Estimating Chemometric Prediction Error
Another aim of the research is the derivation and validation of an analytical formula that estimates the uncertainty in concentrations predicted by our spectral model. In biological samples, such as tissue, obtaining reference concentrations to assess measurement error is not straightforward. The ability to make predictions concerning the concentration error is valuable to the process of developing and refining analytical measurements.
Develop an Algorithm for Breast Cancer Diagnosis Using our Spectral Model
Development of an algorithm to diagnose breast cancer is a central objective of this thesis.
-15-We employ our spectral model to diagnose normal, benign and malignant lesions in specimens of fresh-frozen human breast tissue, based on their morphological compositions.
Assess the Diagnostic Importance of Microcalcifications
In our ex vivo studies, we see relatively little contribution from the two types of calcifications found in breast tissue and included in our spectral model, calcium hydroxyapatite and calcium oxalate dihydrate. Due to their diagnostic importance, microcalcifications in fresh breast tissue are not typically made available for scientific research and thus our studies did not include lesions containing microcalcifications. For this reason, we investigate the diagnostic power of Raman microscopy of microcalcifications in thin sections of deparaffinized fixed breast tissue. Results can be coupled with the diagnostic algorithm developed using fresh-frozen tissues to create a powerful new tool for the diagnosis of benign and malignant breast lesions.
Prospective Validation of the Diagnostic Algorithm
The main goal of this study is to validate our diagnostic algorithm developed on fresh-frozen tissues with a large data set that closely mimics an in vivo environment. In this work, we utilize freshly excised tissues. Further, we aim to elucidate differences between the Raman spectra of fresh-frozen and fresh breast tissues. Additional goals include expanding our diagnostic algorithm to include pathologies not seen in our ex vivo laboratory data and incorporating microcalcifications into our diagnostic scheme.
Demonstrate In Vivo Application of Raman Spectroscopy to Breast Cancer Diagnosis
-16-Ultimately, this thesis culminates in the translation of Raman spectroscopy from a laboratory technique to a clinical tool. To collect the first in vivo Raman spectra of breast tissue, we employ our Raman optical fiber probe to acquire data from patients undergoing partial mastectomy procedures. This study serves to demonstrate the feasibility of in vivo Raman
spectroscopy for the diagnosis of breast cancer.
I. B. Accomplishments
The experiments and theory presented throughout this thesis demonstrate that Raman spectroscopy can be used to accurately diagnosis breast cancer and breast disease. Furthermore, we have demonstrated extension of the technique to in vivo clinical applications with excellent results. We have developed a spectral model based on the major morphological structures in breast tissue, including epithelial cell cytoplasm, the cell nucleus, fat, -carotene, collagen, calcium hydroxyapatite, calcium oxalate dihydrate, cholesterol-like lipid deposits and water. A diagnostic algorithm, which utilizes this spectral model, was developed in the laboratory with samples of fresh-frozen breast tissue. This diagnostic algorithm, which encompasses all data and classifies samples according to specific pathological diagnoses, results in high sensitivity and specificity.
Based on the excellent results of these laboratory studies, we sought to employ Raman spectroscopy clinically. Studies were undertaken to validate our algorithm on a large data set of freshly excised tissue as well as demonstrate in vivo data acquisition. Preliminary results in which the diagnostic algorithm is used in a prospective manner to examine fresh tissue are encouraging, although further data analysis is necessary. This thesis culminates in a demonstration of in vivo data acquisition during partial mastectomy surgeries. The study
-17-was the first in vivo acquisition of Raman spectra of breast tissue and thus extends the technique from a laboratory to a clinical setting. Further, using our diagnostic algorithm developed on ex vivo tissues, we were able to accurately provide intra-operative margin assessment. The work demonstrates that Raman spectroscopy can be used for real-time breast cancer diagnosis in a clinical setting.
I. C. Outline
The goals and accomplishments of this thesis are further elucidated as follows: Chapter II. Breast Cancer
Raman spectroscopy can potentially play a diagnostic role in several aspects of breast cancer evaluation and treatment. Research to develop new diagnostic modalities must be grounded in knowledge of both the disease progression and current medical practices. Only with this information as a basis can diagnostic schemes be created that provide relevant information and are easily incorporated into clinical practice. This chapter details fundamentals of breast cancer. Anatomy and pathology of the breast are discussed, along with a critique of the current methods used for disease diagnosis.
Chapter III. Raman Spectroscopy
The Raman effect and its application to biomedical spectroscopy are presented along with the previous work that has been accomplished in this field. Competing research technologies for breast cancer diagnosis are also discussed. The experimental instrumentation used
throughout this research is presented.
-18-Chapter IV. Data Processing
This chapter presents approaches that we use to analyze Raman spectra. The motivation for the development of a Raman spectroscopic morphological model is explained. Techniques for the development of this model and its application to disease diagnosis are described. In addition, an analytical formula that estimates the uncertainty in concentrations predicted by our spectral model is derived and validated. By understanding the sources of prediction error, efforts can be made to reduce it scientifically. Further analytic methods for calculating the concentration error allow smart experimental design to detect moieties of interest with the appropriate accuracy.
Chapter V. Raman Spectroscopic Breast Cancer Diagnosis: Ex Vivo Studies
We employ Raman spectroscopy to diagnose normal, benign and malignant lesions in specimens of human breast tissue, based on their morphological compositions. The morphologic makeup of the tissue is determined through the application of our spectral model. A diagnostic algorithm is presented that was developed in the laboratory with samples of fresh-frozen human breast tissue. The diagnostic algorithm, which encompasses all data and classifies samples according to specific pathological diagnoses, is used to identify those lesions that would need to be excised. This algorithm results in a positive predictive value of 85% and a negative predictive value of 100%, indicating that no malignant lesions in our data set are left unexcised. The excellent results of this study thus supported moving the technique to a clinical setting for further testing of its efficacy in breast cancer diagnosis. Preliminary results in which the diagnostic algorithm is used in a prospective manner to examine fresh tissue are also presented.
-19-Chapter VI. Raman Microscopy of Microcalcifications
In our ex vivo studies, we see relatively little contribution from the two types of calcifications found in breast tissue and included in our spectral model, calcium hydroxyapatite and calcium oxalate dehydrate. Microcalcifications are a feature of particular diagnostic significance on a mammogram. However, due to their diagnostic importance, microcalcifications in fresh breast tissue are not typically made available for scientific research and thus our studies did not include lesions containing them. For this reason, we have investigated the diagnostic power of Raman microscopy of microcalcifications in thin sections of deparaffinized fixed breast tissue. We were able to distinguish microcalcifications occurring in benign and malignant ducts with a sensitivity of 88% and a specificity of 93%. This is a significant improvement over current X-ray mammography techniques which are unable to reliably differentiate microcalcifications in benign and malignant lesions.
Chapter VII. Raman Spectroscopic Breast Cancer Diagnosis: In Vivo Studies
The final objective of this thesis, the in vivo application of Raman spectroscopy for diagnosing breast cancer, is described in this chapter. The culmination of this work is the demonstration of accurate intra-operative margin status assessment. Application of our previously developed diagnostic algorithm resulted in perfect sensitivity and specificity in this small data set. Significantly, we detected a grossly invisible cancer that, upon pathological review, required the patient to undergo a second surgical procedure. Had Raman spectroscopy been employed in a real-time fashion during the procedure, the additional re-excision surgery would have been avoided. These preliminary findings indicate that Raman spectroscopy has the potential to lessen the need for re-excision surgeries
-20-resulting from positive margins and thereby reduce the recurrence rate of breast cancer following partial mastectomy surgeries.
Chapter VIII. Other Applications of Raman and Fluorescence Spectroscopies
Although there are many advantages to Raman spectroscopy, other optical techniques may also play a role in breast cancer diagnosis. Preliminary investigations have examined the diagnostic potential of fluorescence and reflectance spectroscopies. Studies have also been conducted using spectroscopic techniques that have only recently been applied to tissue, such as surface enhanced Raman spectroscopy and fluorescence lifetime measurements. Finally, Raman and fluorescence spectroscopies are used in a synergistic manner to elucidate the mechanism of ceroid formation in situ. Ceroid is an insoluble lipid-protein complex characteristic of atherosclerotic plaques. The mechanism of ceroid formation has been extensively studied but despite intensive research, ceroid is only defined empirically through its fluorescence properties and its behavior during various staining processes. The synergy of these two types of spectroscopy allows for the identification of ceroid via its fluorescence signature and the subsequent elucidation of its chemical composition through the acquisition of a Raman spectrum. A better understanding of the mechanism of ceroid formation may suggest avenues to induce regression or prevent progression of atherosclerotic plaques with medical therapy
Chapter IX. Future Directions
Future directions, comprised of both clinical and basic studies, are presented. With the successful demonstration of in vivo Raman spectroscopy for breast cancer diagnosis, there are many clinical applications that can be addressed. Clinical studies to further investigate
-21-the role of Raman spectroscopy for intra-operative margin assessment are discussed. Also, development of a side-looking optical fiber Raman probe for transdermal needle measurements is detailed. Basic research will focus on quantitative analysis and spectral model refinement. Our current spectral model only provides relatively quantitative data and does not utilize the intensity information contained within the spectra. Studies to incorporate intensity information into our diagnostic schemes and to extract quantitative morphological information are presented. These studies simultaneously provide a basis for model refinement as well as insight into the lower detection limits of the approach. Finally, approaches to combining Raman spectroscopy with fluorescence and reflectance data are presented. The combination of these spectroscopic modalities may provide an even more powerful tool for guiding patient care.
-22-Chapter II. Breast Cancer
Breast cancer is the most common female cancer in the United States, the second most common cause of cancer death in women (after lung cancer), and the main cause of death in women ages 45 to 55 [Jemal et al. 2004]. Optical techniques can potentially play a diagnostic role in several aspects of breast cancer evaluation and treatment. Numerous spectroscopic modalities are currently under investigation for this purpose. This thesis outlines progress on the use of Raman spectroscopy to diagnose breast cancer. Research to develop new diagnostic modalities must be grounded in knowledge of both the disease progression and current medical practices. Only with this information as a basis, can diagnostic schemes be created that provide relevant information and are easily incorporated into a clinical setting. This chapter details fundamentals of breast cancer. Both breast anatomy and pathology are described, thereby providing a framework for interpretation of spectroscopic data. To astutely apply spectroscopy to breast cancer diagnosis, an extensive understanding of breast pathology and the morphologic changes associated with each disease is imperative. Also summarized in this chapter are current diagnostic strategies for breast cancer as well as breast cancer staging, prognosis, and treatment. With knowledge of the current biopsy and surgical approaches, areas where spectroscopic modalities can play beneficial roles in breast cancer diagnosis and treatment are evident. As spectroscopic techniques move into the clinic, a through understanding of surgical procedures also allows smart study designs that utilize existing procedures. Further, tissue changes induced by therapy and the effect this will have on spectroscopic data must be considered. Knowledge of the strengths and limitations of breast cancer diagnosis and treatment is key for developing new diagnostic modalities.
-23-II. A. Breast Anatomy
The mature breast serves as:a secretory, milk producing, gland [Cotran et al. 1999]. Breast
tissue extends from below the collarbone to the level of the sixth or seventh rib, and from the
breastbone to the axilla. In the center of the breast are the nipple and areola. Fibrous
connective tissue, called fascia, lies between the breast tissue and the skin, and separates
breast tissue from the chest muscles. Cooper's ligaments, made of elastin, run from the deep
fascia throughout the breast tissue and attach to the dennis providing a supportive network
schematic of the female breast. The
from the breasts. The surface veins of the
for the breast. Figure 11.1 shows a
and axillary,
mammary,
blood; and the internal mammary, axillary, intercostal arteries supply the breasts with internal
to the internal mammary, axillary, and breast encircle the nipple and carry blood and intercostal veins carry blood away
intercostal veins, and to the lungs. Breast Figure 11.1. Schematic of the female breast.@Bristol-Myers Squibb
cancer cells can travel to the lungs via surface veins and form metastatic tumors. The
intercostal veins join a complex network of vertebral veins in and around the spine, providing
a path for breast cancer cells to spread to bone tissue. Most lYmphatic vessels in the breast
drain into a network of lymph nodes located around the breast's edges, in the underarm, and
near the coJ1arbone. Axillary lymph nodes are often the first site of breast cancer metastasis.
The skin of the upper breast is innervated by nerves that branch from a network of nerves in
-24-the neck. The long thoracic nerve innervates -24-the muscle that helps move -24-the upper arm. Surgeons must be careful not to sever or injure this nerve when operating near underarm lymph nodes. Chest muscles located under the breasts include the major and minor pectorals, the serratus magnus and the rectus abdominus. Some mastectomy procedures, excision of the entire breast, involve removing the fascia overlying the chest muscles, while others involve removing the muscles themselves.
II. A. 1. Normal Breast Tissue
The breast itself is composed of three types of tissue; adipose, fibrous, and glandular. A microscopic image of a thin section of normal breast tissue stained with hematoxylin and eosin (H&E) is shown in Figure II.2a. The three tissue types comprising normal breast can be visualized in this image. In the histopathological diagnosis routine, tissue is fixed, sectioned, stained, visually examined by a pathologist and evaluated for abnormalities [Burkitt et al. 1996]. H&E is applied to tissues fixed in formalin or alcohol and is the most commonly used technique in routine pathology. The basic dye, hematoxylin, stains acidic structures a purplish blue. Nuclei, ribosomes and the rough endoplasmic reticulum have a strong affinity for this dye owing to their high DNA and RNA content, respectively. In contrast, eosin is an acidic dye that stains basic structures red or pink. Most cytoplasmic proteins are basic and hence the cytoplasm usually stains pink or pinkish red. Fibrous tissue is also composed of basic proteins and thus stains pink, as can be seen in Figure II.2a. Also seen in the image, are the purplish appearing ducts and lobules that are lined with glandular epithelium. Epithelium is membranous tissue composed of one or more layers of cells separated by very little intercellular substance. It forms the covering of most internal and
-25-external surfaces of the body and its organs. The epithelium appears purple due to the abundance of cell nuclei. Adipose tissue can be visualized as clear spaces in Figure II.2a because fat is washed away during the tissue processing.
The primary composition of normal breast is fatty tissue interspersed with fibrous or connective tissue. Together, these two types of tissue make up the stroma, or tissue lying between the glands. The fatty tissue contains cells, called adipocytes, which harbor copious amounts of cytoplasmic fat. The fibrous tissue is mainly composed of collagen and small amounts of glycosaminoglycans. The stroma also contains fibroblasts and blood vessels [Sternberg, 1997]. Fibroblasts are stellate or spindle-shaped cells capable of producing connective tissue by forming collagen fibers. The glandular tissue is comprised of several lobes or milk glands connected to a conduit of ducts that carry milk to the nipples. Each lobe is autonomous and empties into its own excretory duct. The lobes themselves are divided into smaller units called lobules, which in turn are made up of acini. The lobules are the functional, milk producing, units of the mammary parenchyma. The lobular units and the ducts that connect them are separated from the stroma by a basement membrane, primarily composed of collagen. Figure II.2b depicts the high magnification appearance of a normal breast acinus. In the image, a low, flattened layer of contractile cells, some slightly vacuolated, can be identified beneath the more prominent lining epithelium. Indeed, the larger ducts in the breast consist of a double layer of cuboidal cells, an inner layer of epithelial cells surrounded by a layer of myoepithelial cells. The myoepithelial cells are smooth muscle like cells found in between the epithelium and the basement membrane. They contain myofilaments, are flatter than epithelial cells and are oriented parallel to the
-26-long axis of the duct, enabling them to control the transport of milk. As the ducts become smaller, they are reduced to a single layer of epithelial cells.
II. A. 2. Menstrual Cycle, Pregnancy and Menopause
The breast undergoes significant changes in response to hormonal influences, such as during the menstrual cycle, pregnancy, and menopause [Cotran et aL 1999]. In the first half of the menstrual cycle, the lobules are relatively quiescent. After ovulation, under the influence of estrogen and rising progesterone levels, cell proliferation increases as does the number of acin per lobule. When menstruation occurs, the fall in estrogen:and progsterone levels is followel:byapoptosis, a form of programmed epithelial cell death. It-is only with the onset
. . ." , -:''. . .... . . . .
of plregnay:t hat the breast assumes its complete morphboloi maturation and functional:
activity. During pregnancy, the female breast underges lobar hyiertrophy, resulting in dense; clusters of epithelial cells, so that following birthlatation can occur.- As such, there is a reversal'of the usual stromal-epithelial relationship so- that by the end of the pregnancy the breast is cmposed almost entirely of lobules. The breast, w h istologically is a modified sweat giand, secretes milk by budding off portions of cell cytplasm. The epithelial cells lining the lumen in Figure II.2b demonstrate apocrine secretion: with:snouting, or cytoplasmic extrusions, into the lumen. About 15 to 20 ducts come togethernear the areola to form reservoirs of milk to be drawn from the nipple. After cessation of lactation, the lobules regress and atrophy, and the total breast size diminishes remarkably. Female breast also undergoes substantial biochemical alterations at menopause. The ducts and lobules atrophy with concurrent shrinkage of the stroma and a large amount of collagen is replaced by fat. The lobular acini and stroma may almost disappear in the very aged, leaving only ducts to
-27-create a morphologic pattern that resembles that of the male breast. Males have a small amount of breast tissue, but it consists of just a few ducts, without lobules, in a fibrous
stroma.-II. B. Breast Pathology
II. B. 1. Benign Breast Lesions
Fibrocystic changes account for the majority of "breast lumps" that are found in women of reproductive years, particularly between age 30 and menopause [Cotran et al., 1999]. Table II.1 displays the typical distribution of findings in women seeking evaluation of breast lumps, an important consideration when developing a No Disease 30% diagnostic modality. Fibrocystic change is a benign
Benign 60% condition which can manifest itself as fibrosis
Fibrocystic Change 40%
Miscellaneous Benign 13% (formation of fibrous tissue), adenosis (increase in
Fibroadenoma 7%
Cancer 10% the number of ductules) or cyst formation (dilation Table II.1. Distribution of the findings in of ducts and lobules with semi-transparent fluid). women seeking evaluation of breast lumps.
Each of these changes can occur with or without the presence of others. Figure II.2c depicts the histologic appearance of fibrocystic changes in the breast. Cystically dilated ducts lined by a single layer of epithelial cells can be seen. There are also areas of lobules that are laced with abundant fibrous connective tissue (sclerosing adenosis), and stromal fibrosis. Additionally, there is a small area of microcalcification, highlighted with an arrow. Microcalcifications form as a result of either calcified secretory material or necrotic debris. No atypical changes are seen in Figure II.2c.
-28-Atypia refers to abnormality of a cell, which may or may not be associated with later malignancy.
Fibroadenoma, illustrated in Figure II.2d, is the most common benign tumor of the human female breast. Its growth is induced by estrogen and often stimulated by lactation and pregnancy. Most cases of fibroadenoma arise in younger women. Because of the lack of estrogen after menopause, regression occurs which can result in mucoid degeneration, hyalinization, involution of the epithelial component and calcification. On physical examination, the mass feels firm because of proliferative fibrous stroma and its glandular composition. The tumor is relatively mobile because it does not induce peripheral fibroblast proliferation, and is rarely tender and painful. To the right in Figure II.2d, compressed breast connective tissue forming a "capsule" to the mass can be seen. The tumor itself is composed of a fibroblastic stroma that contains elongated compressed ducts lined by benign appearing epithelium. Lesions diagnosed as fibroadenoma show an accumulation of collagen due to fibroblast proliferation which results in expansion of the stroma. Thus, although fibroadenoma is a benign lesion, it often grows rapidly resulting in significant morbidity, and thus is typically excised [Khan et al. 2001]. Fibroadenoma is most closely related to phylloides tumors, the malignant counterpart of which is not carcinoma but cystosarcoma phylloides, in which the stroma rather than the epithelium is malignant.
Intraductal papilloma, a benign epithelial tumor projecting from the ductal surface, is often associated with a serous or bloody nipple discharge. In Figure II.2e, a small intraductal papilloma appears in a breast duct. They are typically in one of the main lactiferous ducts beneath the areola and thus may cause some nipple retraction. Figure II.2e demonstrates a
-29-fine pink collagenous stroma within the papilloma and epithelial cells that do not show atypia.
Fat necrosis of the breast is a less prevalent benign pathology descriptive of focal areas of fat destruction. The most common etiology is trauma but fat necrosis can also occur with surgery and radiation therapy. It can be a localized, firm area with scarring that may mimic a breast carcinoma. Microscopically, fat necrosis consists of irregular steatocytes with no peripheral nuclei and intervening pink amorphous necrotic material. Steatosis refers to abnormal accumulation of triglycerides within a parenchymal cell, in this case the adipocyte. Inflammatory cells, including foreign body giant cells, responding to the necrotic fat cells are also present. A foreign body giant cell is a very large cell, containing several nuclei and formed by the fusion of multiple macrophages. Macrophages are large, phagocytic cells that engulf dead and dying cells as well as antigens that enter the body. Figure II.2f shows fat necrosis at high magnification. Some lipid-laden macrophages can be seen between the necrotic adipose tissue cells.
Ductal epithelial hyperplasia (DEH), shown in Figure II.2g, is a pathology characterized by intraductal proliferation of epithelial cells. In DEH, the epithelial cells encroach into the duct lumen, producing solid masses, whereas in sclerosing adenosis, also characterized by epithelial cell proliferation, the epithelial cells continue to form well-defined glandular units despite somewhat distorted cells. Epithelial hyperplasia is defined by an increase in the layers of cells and may be due to increased proliferation or, more likely, failure of cells to undergo apoptosis. Here it is florid and occurs in the setting of fibrocystic change. DEH confers a slightly increased risk, 1.5 to 2 times normal, for breast carcinoma [Page et al. 1990]. Figure II.2h shows atypical DEH of the breast. Atypical DEH is
---recognized by its histologic resemblance to ductal carcinoma in situ. However, the lesions are characteristically limited in extent, and the cells are not completely monomorphic in type or fail to completely fill ductal spaces. Monomorphic refers to cells that have the same phenotype. This occurs in tumors as the neoplastic cells often arise from a single progenitor cancerous cell. In breasts with invasive cancer, multiple independent atypical clones may be present, suggesting that this is a multicentric process and that only a minority of these lesions progress to malignancy [Cotran et al. 19991. However, a significantly increased risk, 5 times normal, for breast carcinoma occurs with cytologically atypical epithelial hyperplasia Page
et al. 19901.
Like the female breast, the male breast is subject to hormonal influences which can cause gynecomastia, a benign condition characterized by enlargement of the male breast. It is estimated that 15% of men have gynecomnastia ICotran et al. 19991. It can be characterized by DEH or prominent periductular edema and may be unilateral or bilateral. Gynecomastia results from an imbalance between estrogens, which stimulate breast tissue, and androgens, which counteract these effects. It can occur at puberty or with aging. Gynecomastia may also occur as a result of cirrhosis of liver, Leydig cell tumors of the testis, or drugs.
II. B. 2. Breast Cancer
The incidence of breast carcinoma increases with age, with 85% of cases arising in women older than 30 years. The largest proportion of cases, 50% of breast carcinomas, occur in the upper outer quadrant of the breast. Most breast cancer develops in glandular tissue, epithelium, and is classified as adenocarcinoma. Cancer is characterized by abnormal cell proliferation as well as abnormal maturation of cells. Genetic mutations often override the
-Figure 11.2. H&E images of a-b) normal and c-h) benign tissues.
normal cell signaling system allowing cellular proliferation and growth to occur in the absence of any external stimulus. Thus, unlike normal cells, malignant cells do not stop reproducing after they have doubled 50 or 60 times. They may also become more resistant to
-32-MaliQnant Breast PatholoQies
apoptosis than normal cells, thereby ultimately forming a monomorphic tumor that is made
up of billions of copies of the original cancerous cell. A schematic illustrating the start of
this process is shown in Figure 11.3. Differentiation, a feature of normal tissue growth, refers
-33-to the maturation of cells into a form
differentiated, whereas stem cells are adapted to a specific function. Thus, a
highly as
described
IS
line
fully mature cell of any particular cell
Figure 11.3. Schematic illustrating uncontrolled
relatively undifferentiated. Cancerous neoplastic cell growth and monomorphic expansion.
cells exhibit variable states of differentiation and often fail to achieve a highly differentiated
state. Poorly differentiated cancers typically confer a worse prognosis. In general, the cells
Normal
~
Hyperplasia
(increase in number of cells)
~
Atypical Hyperplasia
(increase in number of cells, cells exhibit abnormalities)
~
Carcinoma in situ
(cancer exists but is confined to the ducts or lobules)
~
Invasive Cancer
(cancer exists and has spread beyond the breast ducts or lobules)
Figure 11.4. Rowchart describing the breast cancer 'continuum'.
of benign lesions are well differentiated. A simple flowchart detailing the breast cancer
"continuum" is shown in Figure 11.4.
-34-The earliest form of breast cancer, ductal carcinoma in situ (DCIS), develops solely in the milk ducts. Figure II.2i is a high power microscopic view demonstrating DCIS. Malignant cells are still within the ductules and have not broken through the basement membrane and into the stroma. The two large lobules in the center contain microcalcifications. The classic cribriform pattern of DCIS of the breast, shown in Figure II.2j, is characterized by holes with sharp margins as though punched out by a cookie cutter. The neoplastic epithelial cells within the duct show minimal hyperchromatism and pleomorphism. Hyperchromatism is an increase in the chromatin content in the cell nucleus. It can be visualized as an increased staining capacity of the cell nuclei for hematoxylin. Pleomorphism refers to cells of the same species which occur in more than one morphological form, in other words cells which have a variety of shapes and sizes. Hyperchromatism, pleomophism, atypical mitoses, DNA aneuploidy and nuclear enlargement are all hallmarks of cancer. However, they are not observed in this tissue section because cribriform DCIS is typically a low grade lesion. Tumor grade is an important indicator of prognosis, with low grade cancers behaving less aggressively than high grade tumors. Comedocarcinoma, shown in Figure II.2k, is a less common type of intraductal carcinoma characterized by the presence of rapidly proliferating, high grade malignant cells. The cells in the center of ducts with comedocarcinoma are often necrotic and calcify, as can be seen in Figure 1.2k. This central necrosis leads to the gross characteristic of extrusion of cheesy material from the ducts with pressure, comedone-like. Comedocarcinoma is much more likely to exhibit hyperchromatism, pleomorphism, atypical mitoses, DNA aneuploidy and nuclear enlargement than cribriform DCIS due to its high grade.
-35-The most common type of breast cancer, invasive ductal carcinoma (IDC), develops from DCIS, spreads through the duct walls, and invades the breast tissue. Lesions diagnosed as infiltrating carcinoma exhibit increases in cellularity and often increases in collagen due to fibroblast proliferation in response to stromal invasion by the malignant epithelial cells. IDC arises from breast ducts and accounts for 70-80% of cases of breast cancer [Cotran et al. 1999]. The IDC of the breast, shown in Figure II.21, is poorly differentiated with very pleomorphic cells.
Lobular carcinoma in situ (LCIS) consists of neoplastic proliferation in the terminal breast ducts and acini. The cells are small and round. LCIS is seen in Figure II.2m. Though these lesions are low grade, they confer a 30% risk for development of invasive carcinoma in the same or the opposite breast [Cotran et al. 1999]. Invasive lobular carcinoma (ILC) accounts for 5-15% of invasive breast cancers. ILC of the breast is shown in Figure II.2n. There is roughly a 20% chance that the opposite breast will also be involved, and many ILCs arise multicentrically in the same breast. ILCs often have a diffusely invasive pattern causing tumors to be difficult to detect by either physical examination or mammography.
There are several less common types of breast cancer. A phyllodes tumor of the breast, the malignant counterpart to fibroadenoma, is shown in Figure II.2o. They arise from interlobular stroma, but unlike fibroadenomas are not common and are much larger. They are low-grade neoplasms which are more cellular than fibroadenomas but rarely metastasize. From the Greek word phyllodes, meaning leaf-like, these tumors are characterized by projections of stroma into the ducts which create a leaf-like pattern. Inflammatory carcinoma, shown in Figure II.2p, tends to spread quickly. It is characterized by breast tissue that is warm and appears red. The hallmark of inflammatory carcinoma can be seen in the
-`---skin overlying the breast which has prominent lymphatic spaces filled with small metastases from breast carcinoma. Medullary carcinoma originates in central breast tissue. Interestingly, it has a slightly better prognosis than do most carcinomas, despite the almost universal presence of poor
Histologic Type Total Cancers
In Situ Carcinoma 15°/o-30%
Ductal carcinoma in situ 80%
Lobular carcinoma in situ 20%
Invasive Carcinoma 70%85% Ductal carcinoma 79% Lobular carcinoma 10% Tubular/cribriform carcinoma 6% Mucinous carcinoma 2% Medullary carcinoma 2% Papillary carcinoma 1%
Table 1.2. Frequency of histologic types of breast cancer. prognostic factors. Mucinous carcinoma, also called colloid carcinoma, is a rare type of
invasive cancer that usually occurs in postmenopausal women. It arises from mucin producing cells and tends to grow slowly. Mucinous carcinoma is characterized by abundant extracellular mucin surrounding nests of carcinoma cells. Paget's disease of the nipple originates in the milk ducts and spreads to the skin of the nipples or areola. Table 11.2 shows
Atypical Ductal Epithelial tal ~Hyperplasia Fibrocystic Hyperplasia Normal
Changes Lobular Atypical
Noma Lobular
-Hyperplasia HyperplasiaHyperplasia
Ductal Infiltrating Carcinoma -~ Ductal In Situ Carcinoma Lobular Infiltrating Carcinoma o- Lobular In Situ Carcinoma Normal Fibroadenoma Normal <
Benign Phyllodies Tumor - Malignant Phyllodies Tumor
("Giant Fibroadenoma") (Cystosarcoma Phylloides)
Figure 11.5. Flowchart depicting the relationship between the breast lesions encountered in our studies.
-37-the distribution of -37-the histologic types of breast cancer. Tubular carcinoma is a small tumor that is often undetectable by palpation. It is a well differentiated form of invasive breast carcinoma and is usually associated with foci of DCIS. Tubular carcinomas are almost always less than 2 cm in greatest dimension. Sarcomas, cancer of the connective tissue, and lymphomas, cancer of the lymph tissue, rarely develop in the breasts. Figure II.5 shows a flowchart depicting the relationship of breast lesions encountered in our studies.
Although the majority of breast cancers are confined to women, carcinoma in the male breast does arise. It is a rare occurrence, with a frequency ratio to breast cancer in the female of less than 1:100. The dearth of glandular tissue in the male breast is a significant reason for the rarity of male breast cancer. However, the scant amount of breast tissue in men also results in malignant neoplasms that rapidly infiltrate to become attached to the overlying skin and underlying thoracic wall. Metastasis follows the same pattern as in women, and axillary lymph node involvement is present in about half of the cases of male breast cancer at the time of lesion discovery. Although men present at higher stages, when they are matched by stage, prognosis is similar in men and women [Cotran et al. 1999].
II. C. Breast Cancer Risk Factors
Most women who develop breast cancer have no identifiable risk factors other than their gender. The growth of breast cancer tumors is often affected by the presence of estrogen and progesterone. The following risk factors result from exposure to these hormones: age greater than 50 years, first pregnancy after age 30 years, long-term hormone replacement therapy (more than 5 years), menstruation before age 12 years, menopause after age 50 years, and nulliparity (not bearing children). Other risk factors include a family history of the disease,