HAL Id: hal-03167927
https://hal.archives-ouvertes.fr/hal-03167927
Submitted on 12 Mar 2021
HAL is a multi-disciplinary open access
archive for the deposit and dissemination of
sci-entific research documents, whether they are
pub-lished or not. The documents may come from
teaching and research institutions in France or
abroad, or from public or private research centers.
L’archive ouverte pluridisciplinaire HAL, est
destinée au dépôt et à la diffusion de documents
scientifiques de niveau recherche, publiés ou non,
émanant des établissements d’enseignement et de
recherche français ou étrangers, des laboratoires
publics ou privés.
objectives realistic? Case studies from Queensland,
Australia
M. Greenway, C. Polson
To cite this version:
M. Greenway, C. Polson. Protecting aquatic ecosystem health: are water quality objectives realistic?
Case studies from Queensland, Australia. Novatech 2007 - 6ème Conférence sur les techniques et
stratégies durables pour la gestion des eaux urbaines par temps de pluie / Sixth International
Confer-ence on Sustainable Techniques and Strategies in Urban Water Management, Jun 2007, Lyon, France.
pp.1747-1754. �hal-03167927�
NOVATECH 2007 1747
Protecting aquatic ecosystem health: are water
quality objectives realistic? Case studies from
Queensland, Australia.
Pour la protection des écosystèmes aquatiques : les objectifs de
qualité de l'eau sont-ils réalistes ? Études de cas du Queensland,
Australie.
Margaret Greenway and Carolyn Polson
School of Engineering, Griffith University, Brisbane, Queensland 4111, Australia
(E-mail: [email protected])
RESUME
Beaucoup d’autorités de réglementation ont établi des objectifs ou des seuils de qualité de l'eau sur la base de concentrations nutritives pour sauvegarder la santé des écosystèmes aquatiques. Mais ces critères reflètent-ils avec précision l’état biologique et écologique ? Notre recherche s'est concentrée sur le comportement de zones humides artificielles destinée à l’amélioration de la qualité de l'eau et à la santé des écosystèmes. Dans cet article nous présentons des données sur la richesse d'espèces de macroinvertébrés de deux zones humides de traitement d'eaux d'égout et de deux zones humides de traitement des eaux pluviales. En dépit des concentrations en nutriments supérieures aux objectifs de qualité de l'eau, chacune des 4 zones humides abritait un assemblage divers des macroinvertébrés y compris des taxa sensibles. De notre étude nous avons conclu que les objectifs de qualité de l'eau peuvent être trop rigoureux et que les plantes aquatiques sont plus importantes pour la richesse de macroinvertébrés. Ainsi, les zones humides artificielles sont efficaces pour l'amélioration de qualité de l'eau et la biodiversité aquatique.
ABSTRACT
Many regulatory authorities set water quality objectives or thresholds based on nutrient concentrations to safeguard aquatic ecosystem health. But do these criteria adequately assess the biological and ecological status? Our research has been focussing on the performance of constructed wetlands for water quality improvement and ecosystem health. In this paper we present data on macroinvertebrate species richness from two wastewater treatment wetlands and two stormwater treatment wetlands. Despite nutrient concentrations exceeding water quality objectives all four wetlands supported a diverse assemblage of macroinvertebrates, including sensitive taxa. From our study we concluded that water quality objectives may be too stringent and that aquatic plants are more important for macroinvertebrate richness. Thus, constructed wetlands are effective for both water quality improvement and aquatic biodiversity.
KEYWORDS
Constructed wetlands, macroinvertebrates, nutrients, sewage effluent, stormwater, water quality.
1748 NOVATECH 2007
1 INTRODUCTION
Municipal wastewater discharged from point sources such as sewage treatment plants or sewer overflows, as well as urban stormwater runoff and combined sewer overflows, contain a variety of potential pollutants that may cause detrimental effects to aquatic ecosystem health in the receiving waters. Suspended solids (sediment and organic particles) and soluble nutrients (ammonium, nitrate, nitrite, phosphate) can be particularly damaging to aquatic ecosystems if present in large quantities. Suspended solids increase water turbidity, which reduces light penetration and photosynthesis and, if there is a high proportion of organic particles, then biochemical oxygen demand (BOD) increases. Excessive nutrients cause algal blooms and eutrophication.
In the 1970’s there was recognition of the need for legislation to assist in the protection and restoration of aquatic ecosystems by eliminating or reducing point source discharges from sewage treatment plants. Davis (1997) observed recovery of macrobenthic communities following improvements in sewage treatment providing habitat was not physically limiting. However, it wasn’t until the 1990’s that recognition was given to the need to control diffuse source pollution such as stormwater runoff and combined sewer overflows (CSO’s) into receiving waters.
So, what are the threshold concentrations or loads of these pollutants to ecosystem health? Whilst excess organic matter and nutrients can be detrimental to aquatic ecosystem health, both are essential resources for ecosystem functions. Organic matter provides a food source for heterotrophic microorganisms and macroinvertebrates while nitrogen and phosphorus are vital for autotrophic microorganisms (phytoplankton, periphytic algae) and macrophytes, which in turn provide a food source for macroinvertebrates.
The concentrations, or loads of contaminants, reaching the receiving waters from sewage discharge or urban stormwater runoff depends on several variables. In the case of sewage discharge this will depend on the pre-treatment processes (primary, secondary, tertiary) - in particular tertiary treatment – Biological Nutrient Removal, waste stabilisation ponds, lagoons and wetlands, the population size (person equivalent) “catchment”, and peak usage times. In the case of stormwater runoff this will depend on size of catchment, land use within catchment, extent of vegetated cover versus impervious areas, rainfall intensity and duration, time between rainfall events, flow pathways (drains versus natural channels, wetlands).
The municipal wastewater industry has had regulatory legislative requirements for water quality discharge for the past 30 years. As a point source discharge the quality of sewage effluent can easily be monitored. In Australia acceptable discharge standards for sewage effluent are 30mgL-1 Total Suspended Solids (TSS), 20mgL-1
BOD, 5-15mgL-1 Total Nitrogen (TN) and 2-10mgL-1 Total Phosphorus (TP). Though
more recently treatment performance expectations are < 5mgL-1 TN and < 2mgL-1 TP.
It is only relatively recently that regulatory authorities in Australia have set “water quality objectives” for receiving waters (ANZECC, 1992; Qld Gov., 1997) (Table 1). These water quality objectives have been implemented in response to perceived environmental degradation using measures such as decreases in the biodiversity of aquatic flora and fauna and increases in number of algal and cyanobacterial blooms. Regulatory authorities continue to set these threshold water quality objectives for broad geographical regions.
Water Quality Guidelines TN NH4-N NOx-N TP PO4-P TSS
Queensland 0.5 0.02 0.06 0.05 0.02 6 Brisbane City Council 0.65 0.035 0.13 0.07 0.035 15
NOVATECH 2007 1749 As noted by the European Union Framework Directive on eutrophication (EC, 2003) “quality status” should be assessed on the basis of observed changes in biological factors in aquatic ecosystems, not simply on the basis of nutrient concentrations. However, regulatory authorities set water quality thresholds based on nutrient concentrations, but do these criteria adequately assess ‘poor’, ‘moderate’ or ‘good’ quality status in terms of ecological disturbance and aquatic health. In estimating the condition of a biological element the following parameters should be considered (Table 2, p10):
• Presence or absence of a species or group of species • Overall richness or richness of a particular taxonomic group(s). • Relative number of taxa in a particular taxonomic group
• Abundance or relative abundance of a particular species or groups of species.
• Overall diversity, or diversity within a particular taxonomic group
Ecosystem health can be a difficult concept to define, since it can incorporate a wide range of attributes including loss of an individual species, a reduction in community species richness or diversity, dominance of an individual species to complete ecosystem dysfunction. In our study we looked at macroinvertebrate species richness and their sensitivity to pollution in four constructed wetlands – two receiving stormwater (Golden Pond and Bridgewater Creek), and two receiving secondary treated sewage effluent (Cairns and Cooroy).
2 METHODS
2.1 Site
Description
2.1.1 Stormwater Wetlands
The two stormwater wetlands are located in Brisbane, South-East Queensland, Australia. Both are retrofit structures located within existing residential areas (70% impervious area) (Table 2).
Golden Pond (180ha catchment) Bridgewater Creek (200ha catchment) Wetland 1 Wetlands 2 Pond 1 Ponds 2-6 water lilies, aquatic creepers,
submerged pond weeds emergent sedges and rushes Vegetation 10 sp. 7 sp. 3 sp. (littoral zone) 10 → 4 sp. (marsh zones) % cover 80% 90% 1% 20 → 7% Dimensions 80m x 15-20m 55m x 20m 30 x 34m 40-50m x 15-20m Area 1550m2 1100m2 1000m2 7000m2
Depth 0.2 – 0.8m 0.5 – 1.2m 2m 0.2 - 1.5m Table 2. Physical attributes of Golden Pond & Bridgewater Creek Wetlands
Golden Pond “Wetland System”. Constructed in 1999 it consists of two contiguous wetlands. Both wetlands are dominated by floating-leaved emergent macrophytes: water lilies (Nymphaea, Nymphoides), aquatic creepers (Ludwigia, Paspalum,
Persicaria), and submerged pond weeds (Elodea, Ceratophyllum) (Greenway and
Polson, 2004).
Bridgewater Creek “Wetland System”. Constructed in 2001, it consists of six inter-connected ponds. Pond 1 has a 2m littoral zone dominated by Schoenoplectus
validus. Ponds 2 – 6 were designed with several macrophyte zones (ephemeral,
shallow marsh, marsh and deep marsh), the dominant marsh species being Juncus
kraussii; S.validus, S.mucronatus, Bolboschoenus fluviatalis, Baumea rubiginosa and B.articulata. However, macrophyte establishment was poor (Greenway et al. 2006;
1750 NOVATECH 2007 Jenkins & Greenway 2007) resulting in only 20% cover in year 1 (2002); 13.5% cover in year 2 (2003) and 7.5% cover in year 3(2004) in the marsh zones.
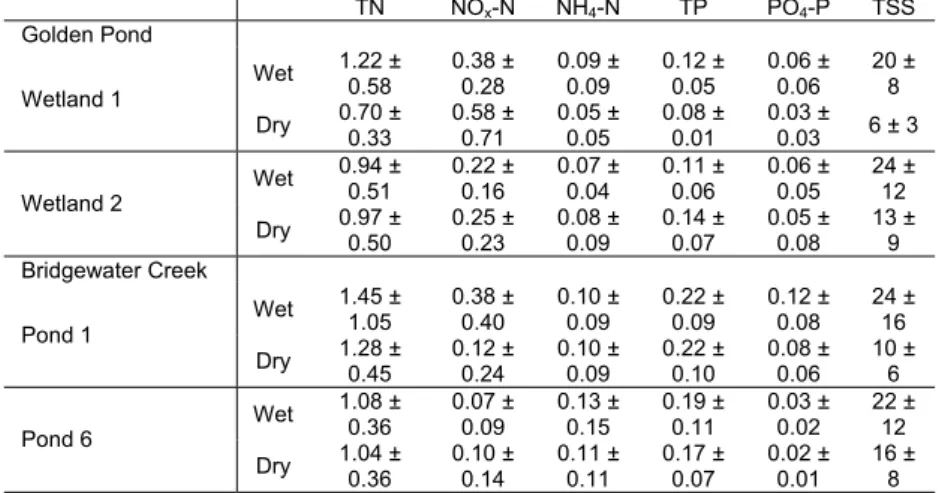
Water quality during wet weather events and dry weather between 2001 – 2003 at Golden Pond and 2002 – 2004 at Bridgewater Creek is summarised in Table 3.
TN NOx-N NH4-N TP PO4-P TSS Golden Pond Wet 1.22 ± 0.58 0.38 ± 0.28 0.09 ± 0.09 0.12 ± 0.05 0.06 ± 0.06 20 ± 8 Wetland 1 Dry 0.70 ± 0.33 0.58 ± 0.71 0.05 ± 0.05 0.08 ± 0.01 0.03 ± 0.03 6 ± 3 Wet 0.94 ± 0.51 0.22 ± 0.16 0.07 ± 0.04 0.11 ± 0.06 0.06 ± 0.05 24 ± 12 Wetland 2 Dry 0.97 ± 0.50 0.25 ± 0.23 0.08 ± 0.09 0.14 ± 0.07 0.05 ± 0.08 13 ± 9 Bridgewater Creek Wet 1.45 ± 1.05 0.38 ± 0.40 0.10 ± 0.09 0.22 ± 0.09 0.12 ± 0.08 24 ± 16 Pond 1 Dry 1.28 ± 0.45 0.12 ± 0.24 0.10 ± 0.09 0.22 ± 0.10 0.08 ± 0.06 10 ± 6 Wet 1.08 ± 0.36 0.07 ± 0.09 0.13 ± 0.15 0.19 ± 0.11 0.03 ± 0.02 22 ± 12 Pond 6 Dry 1.04 ± 0.36 0.10 ± 0.14 0.11 ± 0.11 0.17 ± 0.07 0.02 ± 0.01 16 ± 8 Table 3. Water Quality Parameters for Bridgewater Creek and Golden Pond (mgL-1; x ± SD
2.1.2 Wastewater Treatment Wetlands
The wastewater treatment wetlands are located in Cairns, northern tropical Queensland and Cooroy (Noosa Shire), South-East Queensland. The Cairns Wetland was constructed in 1994 and consists of 3 linear channels, these were originally band planted with a diversity of species however, Typha spread rapidly and now dominates (Greenway et al., 2003). It receives secondary effluent after passing through an oxidation ditch and hence water quality is low in ammonia (Greenway and Woolley, 2001).
The Cooroy Wetland consists of 2 large linear wetlands built in 1995 and 1999. Each wetland consists of 3 large cells linked by pipes, each cell is separated by septa into sections producing a sinusoidal flow path. Cell 1 is shallow (20-40 cm) throughout. Cell 2 and Cell 3 each have a deep pond (1-2 m) in the first section (30 m length), the remainder is shallow. The wetland supports a diversity of plants (Greenway et al., 2003). The secondary effluent is treated by a trickling filter followed by alum dosing (to remove phosphate by precipitation), it then flows into an open water lagoon prior to release into the wetlands. (Table 4).
Cairns Cooroy
Vegetation 26 species; Typha dominant 38 species; diverse; sedges dominant % cover 95% 70% Area 2 x 300m2 1 x 900m2 2 x 7650m 2 Depth 0.4m 0.2 – 0.4m (marsh) 1 – 2m (pond)
Table 4 Comparison of physical attributes of the Cairns and Cooroy wastewater treatment wetlands.
NOVATECH 2007 1751 Water quality data collected at Cairns and Cooroy wastewater treatment wetlands is summarised in Table 5. TN NOx-N NH4-N TP PO4-P TSS Cairns In 6.1 5.0 0.5* 7.8 7.5 4.8 Out 1.6 <0.1 0.5 7.2 6.8 4.5 Cooroy In 25.0 8.0 12.5 0.02** <0.01 10 Out 6.5 1.4 1.1 0.02 <0.01 6
* oxidation ditch pre-treatment for nitrification of NH4 ** Alum dosing pre-treatment to remove PO4
Table 5. Water Quality Parameters for Cairns and Cooroy
2.2 Aquatic
Macroinvertebrates
– Collection and Identification
Macroinvertebrate taxa were sampled at Golden Pond and Bridgewater Creek wetlands between 2001 and 2004 and at Cairns and Cooroy in 2001 and 2002. Macroinvertebrates were collected from edge habitats (marsh areas < 1.5m deep) along the bank using a triangular framed, 250µm mesh dip net. Samples preserved in 70% alcohol and identified to family level for most orders, to sub-family for Chironomidae, or to the lowest taxonomic level possible and scored as present or absent at each site.
The macroinvertebrate data set was analysed to assess the ecological health of the wetland by using the three indices of ecological condition as used by the Ecological Health Monitoring Program (EHMP) in South-East Queensland (EHMP, 2006). The three indices calculated were for Invertebrate Family Richness; Plecoptera, Ephemeroptera and Trichoptera richness (PET); and Stream Invertebrate Grade Number – Average Level (SIGNAL) – using the SIGNAL-2 grades for invertebrate families (Chessman, 2003). Taxa were also grouped according to functional feeding groups (FFG) in order to establish if there was any pattern to their distribution and abundance.
3
RESULTS AND DISCUSSION
3.1 Water
Quality
From Tables 3 and 5 it can be seen that both the stormwater wetland and wastewater treatment wetlands exceed many of the WQO. In the stormwater wetlands, Pond 6 and Wetland 2 show slightly better water quality than Pond 1 and Wetland 1 indicating improved treatment through the system. Nevertheless, nutrient concentrations and TSS in both wet and dry weather are highly variable. In the wastewater treatment wetlands influent nitrogen and phosphorus varied due to pretreatment. In Cairns most of the nitrogen was NOx-N, which was reduced to < 0.1mgL-1 producing effluent of similar quality to the stormwater wetlands. However,
phosphorus was high with little reduction in concentration. In Cooroy nitrogen was high in the influent with 50% NH4-N and 32% NOx-N. Considerable reduction in both
NH4 and NOx-N occurred, but effluent concentrations still exceeded WQO. Virtually
all phosphorus had been removed from the influent by alum dosing pre-treatment and there was no increase through the wetland, suggesting any phosphorus generated in
situ was rapidly removed by ecosystem processes. TSS was low in the wastewater
1752 NOVATECH 2007
3.2 Macroinvertebrates
3.2.1 Species Richness and Pollution Sensitivity
Macroinvertebrate species richness showed an increase over the four years since construction at the Bridgewater Creek Wetland from 12 taxa to 84 taxa, with 28% of the families having a sensitivity grade > 5 (Table 6). Golden Pond Wetland maintained approximately 55 taxa, with 24% families having a sensitivity grade of >5.
2001 2002 2003 2004 Worms & Leeches 3 6 9 8 Gastropods (water snails) 2 3 4 5 Crustaceans & Water Mites (ostracods, copepods) 1 5 4 14
Odonata (dragonflies & damselflies) 0 7 5 11 Mayflies & Caddisflies 1 2 2 2 Hemipterans (water bugs) 1 5 7 15
Dipterans (flies) 3 6 3 10 Coleopterans (water beetles) 1 6 8 19
Total Invertebrate Taxa 12 40 42 84 Table 6. Change in No. Macroinvertebrate taxa at Bridgewater Creek Wetland over time.
Macroinvertebrate species richness was also high in the Cooroy wastewater treatment wetland with a total of 81 taxa, with 20% of families having a sensitivity grade of >5. Sampling at Cairns was limited to 3 sampling events but still recorded 40 macroinvertebrate taxa (17% > 5 sensitivity grade) (Table 7).
Site Macroinvertebrate No. Taxa
% Sensitive
Families SIGNAL2 Grade No. EPT Families % Predators Golden Pond 55 24% 3.43 2 59% Bridgewater Ck 84 28% 3.60 3 54%
Cairns 40 17% 3.00 1 50% Cooroy 81 20% 3.30 4 51% Table 7.No. Macroinvertebrate taxa, % pollution sensitive families, SIGNAL grade, No. EPT
families and % no. predators at 4 constructed treatment wetlands
SIGNAL-2 grades of < 4.0 but with number of families > 20 indicate poor water quality or harsh physical conditions. Number of EPT families was lower than EHMP guidelines for lowland streams. Both of these grades are derived for running waters and many wetland species thrive in more slow flowing wetland waters where dissolved oxygen may be low and suspended solids high. Even so, the SIGNAL-2 grade and the number of EPT taxa equalled or bettered the number commonly found in streams in South-east Queensland (EHMP, 2006).
Both the stormwater wetlands and wastewater treatment wetlands maintained a diversity of macroinvertebrate taxa over time. Despite WQO not being met for stormwater treatment this did not limit the colonisation and establishment of a biodiverse aquatic ecosystem. Furthermore, the concentrations of pollutants in the wastewater treatment wetlands were considerably higher and yet still supported a high species richness of macroinvertebrates. Davis et al. (1993) showed that moderately eutrophic wetlands in Western Australia recorded the greatest number of macroinvertebrate species. Treatment wetlands provide diverse habitat and food sources for macroinvertebrate organisms.
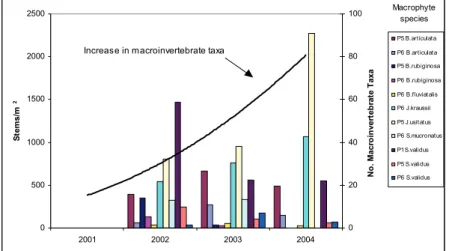
The increasing number of taxa at Bridgewater Creek Wetland appeared to be more aligned with increasing macrophyte abundance and availability of food than to water quality (Figure 1). In a study of a constructed wetland in Ohio it was found that macrophyte habitats best explained patterns of macroinvertebrate species richness (Grubh & Mitsch, 2004) and in Western Australia it was found that salinised wetlands
NOVATECH 2007 1753 dominated by macrophytes supported a higher abundance and richness of macroinvertebrates taxa (Strehlow, 2005).
Rochfort et al. (2000) noted that sediment deposited by stormwater and CSO’s would be more likely to impact stream benthic communities than water chemistry – the former being a more long term effect, the latter being only a short term effect due to the high variability in the water quality during storm events and short exposure times. Sheeder and Evans (2004) compared water quality and ecosystem health in impaired and unimpaired watersheds in Pennsylvania and found concentration thresholds of 2.01 mgL-1 N and 0.07 mgL-1 P, whereas EPA concentrations were set at 0.5 mgL-1 N and 0.02 mgL-1 P. Furthermore, most unimpaired watersheds based on biological assessment did not meet EPA nutrient criteria. Sheeder and Evans point out that variability in climate and landscape characteristics between ecoregions will also affect the variability and causes of eutrophication suggesting that nutrient and sediment thresholds are localised.
0 500 1000 1500 2000 2500 2001 2002 2003 2004 S tem s/ m 2 0 20 40 60 80 100 N o . Macr o in ver te b rat e T axa P5 B.articulata P6 B.articulata P5 B.rubiginosa P6 B.rubiginosa P6 B.fluviatalis P6 J.kraussii P5 J.usitatus P6 S.mucronatus P1 S.validus P5 S.validus P6 S.validus
Increase in macroinvertebrate taxa
Macrophyte species
Figure 1. Increase in macroinvertebrate taxa (solid line) as macrophyte shoot/stem density increases over time at Bridgewater Creek Wetland.
3.2.2 Feeding group
More than half of the taxa collected at all sites could be classified as predators based on commonly used functional feeding groups (Cummins & Klug, 1979). Predators are often highly mobile (eg. stalking) and their strategies suit the slower flow of wetlands and ponds. Very few studies classifying macroinvertebrates by food type have been conducted in subtropical Australia. Tomanova (2006) found that in neotropical streams in South America most macroinvertebrates fed on fine detritus and that traditional feeding groups did not necessarily apply. Many of the predators found in our study were odonates, which are often graded in biotic indices as being more sensitive to pollution. It could be that habitat, provided by macrophytes, and feeding strategies were a much stronger indicator of the presence or absence of particular taxa than water quality, and that water quality is not a good predictor of macroinvertebrate biodiversity in treatment wetlands. Wetzel (2001) noted that the most effective wetland ecosystems are those possessing a maximum biodiversity of macrophytes.
1754 NOVATECH 2007
4 CONCLUSION
This study has demonstrated that nutrient concentrations recommended in water quality guidelines may be too stringent. Exceeding guidelines did not limit macroinvertebrate species richness in the four constructed wetlands examined in this study. Macrophytes may be more important than water quality for determining macroinvertebrate associations because of the creation of habitats and food resources.
LIST OF REFERENCES
ANZECC (1992). Australian Water Quality Guidelines for Fresh and Marine Waters. National Water Quality Management Strategy. Australian and New Zealand Environment and Conservation Council.
Chessman, B.C. (2003). New sensitivity grades for Australian river macroinvertebrates. Marine and Freshwater Research 54(2):95-103.
Cummins, K.W. and Klug, M.J. (1979). Feeding ecology of stream invertebrates. Annual Review of Ecology and Systematics. 10:147–172.
Davis J.A., Rosich R.S., Bradley J.S., Growns J.E., Schmidt L.G. and Cheal F. (1993). Wetlands of the Swan Coastal Plain (Vol. 6). Wetland Classification on the Basis of Water Quality and Invertebrate Community Data. Water Authority of Western Australia and WA Environmental Protection Authority, Perth.
Davis, J.F. (1997). Revitalisation of north central Texas river, as indicated by benthic macroinvertebrate communities. Hydrobiologia. 346:95-117
EHMP (2006). Ecosystem Health Monitoring Program 2004-05 Annual Technical Report. Moreton Bay Waterways and Catchments Partnership, Brisbane.
European Communities (2003). Common Implementation Strategy for the Water Framework Directive (2000/60/EC) Guidance document No 13. Overall approach to the classification of ecological status and ecological potential. Luxembourg. Office for Official Publications of the European Communities, 2003
Greenway M, Jenkins G.A. and Polson C (2006). Macrophyte zonation in stormwater wetlands – getting it right! A case study from subtropical Australia. Proc. 10th IWA Int. Conf. Wetland
Systems for Water Pollution Control, Lisbon, Portugal, September 2006.
Greenway M. and Polson C. (2004): Macrophyte survival in stormwater wetlands: coping with flash flooding and fluctuating water levels. Proc. 9th IWA Conference on Wetland Systems for Water Pollution Control, Avignon, France, September 2004, pp547-564.
Greenway M., Dale P. and Chapman H. (2003). An assessment of mosquito breeding and control in four surface flow wetlands in tropical-subtropical Australia. Water Sci. Tech., 48(5):249-256.
Greenway, M. and Woolley, A. (2001). Changes in Plant Biomass and Nutrient Removal Over 3 Years in a Constructed Free Water Surface Flow Wetland in Cairns, Australia. Water Sci. Tech. 35:303-120.
Grubh A.R. and Mitsch W.J. (2004). Distribution and abundance of macroinvertebrates in created wetland ecosystems. 2003 Annual report (Olentangy River Wetland Research Park) Jenkins G.A. and Greenway M. (2007). Ecological and hydrological assessment for a constructed
stormwater wetland restoration. Submitted Novatech 2007.
Queensland Government (1997). Environmental Protection (Water) Policy 1997. Qld EPA, Brisbane.
Rochfort Q., Grapentine L., Marsalek J., Brownlee B., Reynoldson T., Thompson S., Milani D., Logan C (2000). Water Quality Research Journal of Canada. 35(3);365-397.
Sheeder, S.A. and Evans, B.M. (2004). Estimating nutrient and sediment threshold criteria for biological impairment in Pennsylvania watersheds. Journal of American Resources Association, August 2004:881.
Strehlow K., Davis, J., Sim, L., Chambers, J., Halse, S., Hamilton D., Horwitz, P., McComb A. & Froend R. (2005). Temporal changes between ecological regimes in a range of primary and secondary salinised wetlands Hydrobiologia, 552:17-31
Tomanova, S., Goitia, E. and Helesic, J. (2006). Trophic Levels and Functional Feeding Groups of Macroinvertebrates in Neotropical Streams. Hydrobiologia, 556:251-264
Wetzel, R.G. 2001. Fundamental processes within natural and constructed wetland ecosystems: short-term versus long-term objectives. Wat. Sci. Tech. 44:1-8.