HAL Id: hal-02130588
https://hal.archives-ouvertes.fr/hal-02130588
Submitted on 15 May 2019
HAL is a multi-disciplinary open access
archive for the deposit and dissemination of
sci-entific research documents, whether they are
pub-lished or not. The documents may come from
teaching and research institutions in France or
L’archive ouverte pluridisciplinaire HAL, est
destinée au dépôt et à la diffusion de documents
scientifiques de niveau recherche, publiés ou non,
émanant des établissements d’enseignement et de
recherche français ou étrangers, des laboratoires
Pneumatic Fracturing
Antoine L. Turquet, Renaud Toussaint, Fredrik Kvalheim Eriksen, Guillaume
Daniel, Olivier Lengliné, Eirik G. Flekkøy, Knut Jørgen Måløy
To cite this version:
Antoine L. Turquet, Renaud Toussaint, Fredrik Kvalheim Eriksen, Guillaume Daniel, Olivier Lengliné,
et al.. Source Localization of Microseismic Emissions During Pneumatic Fracturing. Geophysical
Research Letters, American Geophysical Union, 2019, 46 (7), pp.3726-3733. �10.1029/2019GL082198�.
�hal-02130588�
Source Localization of Microseismic Emissions during
1
Pneumatic Fracturing
2
Antoine L. Turquet1∗, Renaud Toussaint1,2,3, Fredrik Kvalheim Eriksen1,2, Guillaume
3
Daniel4, Olivier Lengliné1,3, Eirik G. Flekkøy2,3,Knut Jørgen Måløy2,3
4
1University of Strasbourg, Institut de Physique du Globe de Strasbourg, CNRS UMR7516, 5 Rue Descartes, F-67000
5
Strasbourg, France
6
2SFF PoreLab, The Njord Centre, Department of Physics, University of Oslo, PO Box 1048, Blindern, N-0316, Oslo,
7
Norway
8
3International Associate Laboratory LIA D-FFRACT, Deformation, Flow and Fracture of Disordered Materials,
9
France-Norway
10
4EDF - Direction Industrielle, Aix-en-Provence, France
11
Key Points:
12
• The pneumatic fracturing experiments in a Hele-Shaw cell are monitored using
ac-13
celerometers and a high speed camera.
14
• The acoustic emissions are localized using an energy based signal location method
15
and displacement maps are obtained from image correlation.
16
• By comparing the acoustic and the optical results we observe the motion starts in
17
porous medium and propagates towards the channel tips.
18
Abstract
19
Localization of signals is a widely applied technique used in different areas of science
20
telecommunication, medicine or seismology. In this work, we study microseismic
emis-21
sions due to stick-slip events during pneumatic fracture in a transparent setup at
labora-22
tory scale and apply a localization method "Estimated Source Energy Homogeneity". The
23
seismic location results are compared with the image correlation results for displacement
24
maps corresponding to the event times. We have observed (using optics and acoustics)
25
that the movement starts inside the porous medium and progresses towards the channel
26
tips, eventually causing channels to grow further. This finding could be of interest in
un-27
derstanding fluid-induced earthquake nucleation processes. Similar to in-site applications
28
of pneumatic or fluid-related fracturing, it shows that the area influenced extends beyond
29
the fracture tips. This also shows why even after the end of pumping, we may get
earth-30
quakes, such as in the Basel case [Haring et al. 2008].
31
1 Introduction
32
Acoustic signal localization is applied in many different areas of science [Gershman
33
et al., 1995; Valin et al., 2003; Elnahrawy et al., 2004; Malioutov et al., 2005; Zhu et al.,
34
2007; Fink, 2015; Garnier and Fink, 2015]. In robotics, speech-source tracking is done
35
to automate cameras to follow the speaker [Brandstein et al., 1997]. In electronics,
touch-36
screens are a very popular example of a signal localization. It is necessary for the system
37
to locate the touch of a user to transmit information to process a simple message [Terlizzi
38
and Minoo, 2009].
39
Similarly, in earth sciences, finding the epicenter of an earthquake is necessary to
40
understand how it was generated, where exactly the movement occurred, which region
41
is more risky for the aftershocks [Aki and Richards, 2002], [Turquet et al., 2018a]. For a
42
better quality risk assessment, it is important to know the origin of the seismicity along
43
with its location. In nature, seismic events based on gas-solid interactions are very
com-44
mon. For example, there are many existing studies about a volcano-heated fluid becomes
45
gas causing phreatic eruptions or geysers [Tazieff , 1989; Oppenheimer, 1986; Manga and
46
Brodsky, 2006; Christenson et al., 2010; Jolly et al., 2014; Sudo et al., 1998]. Moreover,
47
fast air or fluid injection deforming porous medium is used in the industrial applications
48
of pneumatic fracturing [Schuring et al., 1996; Accutech, 1994; Gao et al., 2014] or
hy-49
draulic fracturing [Charléty et al., 2007; Cuenot et al., 2008; Dorbath et al., 2009; Aochi
et al., 2011]. At very large scales (tens or hundreds of meters) and high-pressure
injec-51
tion, compressibility plays role in the interactions between the pressurized fluid and
de-52
formable solid medium similar to the gas-solid interactions mentioned earlier. This
phys-53
ical phenomenon can be observed in magma fracturing, eruptions [Rivalta and Segall,
54
2007; Poland et al., 2012], fluid injecting into rocks, or reservoir stimulations in
geother-55
mal fields [Candela et al., 2018]. Stanchits et al. [2011] have studied the acoustic
emis-56
sions on rock samples during thermo-hydro-chemo-mechanical coupled deformations.
Wa-57
ter injection into porous sandstone under applied stress induced acoustic emission events.
58
These events are generated close to the migrating waterfront. Kobchenko et al. [2013]
59
studied the transport of CO2 by diffusion and fracturing the gel layer in a Hele-Shaw cell.
60
They studied the length scales of diffusion and flow in fracture networks which are
eventu-61
ally linked to statistical properties of river networks and hierarchical-fracture networks. In
62
the very recent research of Jamtveit et al. [2018], they have found that the strike-slip lower
63
crust earthquakes are causing fluid pressure pulses towards the lower crust and fluid-driven
64
associated metamorphic and structural transformations of the lower crust follow these
65
earthquakes. More importantly, at large scales, a common way to understand and control
66
the fluid induced fracturing is to monitor the microseismicity [Holland, 2013; Valkó and
67
Economides, 1995; Cornet et al., 1998; Cornet, 2015; Fehler et al.]. The source locations
68
of seismic events are mainly focusing on the fluid-solid coupled events.
69
Even though the localization of the microseismicity due to volcanoes, and industrial
70
applications such as hydraulic fracturing has a very rich scientific literature, the locations
71
of acoustic emissions based on interactions between the injected gas and deformable the
72
solid (or gas-metal in pressure tanks [Peacock, 1996]) remains challenging. To the best
73
of our knowledge, acoustic emissions have not been studied during pneumatic fractures in
74
the scientific literature prior to this article. In this article, we are investigating the source
75
mechanics and locations of pneumatic fractures in a porous medium in a transparent
Hele-76
Shaw cell. The main focus of this work is to first locate the stick-slip events using
acous-77
tic emissions and then to compare them with the displacement field obtained from digital
78
image correlation. The main reason behind using a Hele-Shaw cell is to optically record
79
the deformations associated with the microseismic event while recording the vibrations
80
on the glass plate with accelerometers. This work is based on the similar experiments as
81
in the previous works done by Turkaya et al. [2015], Eriksen et al. [2017a], Eriksen et al.
82
[2018], and Turquet et al. [2018b].
Recently, some of the signal localization types are reviewed in the work Turkaya
84
et al.[2016]. Here in this article, we show the application of Estimation of Source Energy
85
Homogeneity (ESEH) to locate the source of the acoustic emissions during aerofracturing
86
experiments [Turkaya et al., 2015]. These localization results are compared with the
Dig-87
ital Image Correlation (details can be found in Eriksen et al. [2017a] results), as obtained
88
from the optical recordings via a high-speed camera during the experiment.
89
2 Experimental setup
90
The aerofracturing experiments analyzed here are conducted in a Hele-Shaw cell
91
made of two glass plates 80 cm × 40 cm × 1 cm with an aperture of 1 mm between them
92
- see details in Turkaya et al. [2015], Eriksen et al. [2017b], Eriksen et al. [2018], and
93
Turquet et al.[2018b]. The experimental setup is shown in Figure 1(a). The acquisition
94
chains of optical and acoustic data are presented. The system is triggered via a signal
95
generator to have synchronization between optical and acoustic data. The optical data
96
were recorded at 125 or 1000 images per second using a Photron SA5 and a flicker-free
97
Dedolight 400W projector, and for acoustic data, we use 1 MHz sampling rate. Three
98
boundaries of this cell are sealed with a double-sided tape while the fourth side is
cov-99
ered with a 40 µm mesh filter. This filter lets the air pass to the surrounding atmosphere
100
while keeping the grains inside of the cell. In this particular experiment, we used 1 bar
101
overpressure from the inlet and we used 80 µm grains having material density 1.05 g/cm3
102
in loose state inside the cell. Prior to the experiment, the cell is filled vertically before
103
sealing with a semi-permeable mesh. Then, the cell is rotated vertically so that the grains
104
free fall to the other end of the cell without any external effect. This enables that the solid
105
ratio is very close to the random loose packing with a solid fraction of φ = 0.44±0.04
106
[Eriksen et al., 2017b]. Finally, the cell is carefully placed horizontally without changing
107
this loose state. This simple preparation procedure ensures that the experiments are
repro-108
ducible. An empty space is provided between the air inlet and the solid-air interface to
109
provide a homogenous pressure over the width of the cell. The air overpressure at the inlet
110
is then raised and maintained at a constant level (1 bar in the example on Figure 1).
111
During this experiment, acoustic signals are recorded using 4 accelerometers
at-119
tached to the bottom plate (see Figure 1(b)). The sensors are placed towards the outlet
120
(where most of the stick-slip events are happening) to have a better signal resolution. The
121
sensors are Miniature piezoelectric charge accelerometer 4374 - Brüel & Kjaer associated
to a NEXUS Charge Amplifier - Type 2692-A conditioner, and the signal is digitized
us-123
ing a National Instruments NI-DAQ mx acquisition card PCI-6133 8 Channels acquisition
124
card. The accelerometers have 1 Hz to 26 kHz flat response. Using the function given by
125
the manufacturer the response is flattened up to 200 kHz. These accelerometers can record
126
only normal direction to the glass plate. Depending on the sign of the cumulative
dis-127
placement (positive or negative) recorded at the sensor we mark the corresponding signals
128
with the polarisation up or down respectively. The acoustic events are located using ESEH
129
for a certain window of the signal which starts at the arrival time and ends somewhere in
130
the coda. We have presented a more detailed discussion linking the acoustic signal
polar-131
ization to medium deformation in Supplementary Text S1. More information about time
132
windowing can be obtained from Supplementary Figure S1 and associated caption.
Fur-133
thermore, the procedure of detecting the acoustic events from raw recordings is described
134
in the Supplementary Text S2.
135
3 Estimation of Source Energy Homogeneity (ESEH)
136
Estimation of Source Energy Homogeneity considers that the source energy
calcu-137
lated from different recordings should be the same after the correction of energy loss due
138
to the travel-path attenuation (based on material and distance). If we express the source
139
energy with Es and consider that the energy spread cylindrically on the plates the recorded
140
energy En at receiver n at a distant R can be expressed with En = 2πRhEs where h is the
141
plate thickness. Es can be estimated following Hibert et al. [2011]; Farin et al. [2016];
142
Turkaya et al.[2016] by:
143 Es(rs, rn)= ∫ ωN y q 0 2πR(n)ρhc(ω) |a(ω)|2 ω2 dω, (1)
where Es(rs, rn)is the computed energy coming from a source at rs recorded by a sensor
144
at rn. ρ is the mass density of the plate, c(ω) is the group velocity of the waves over
dif-145
ferent angular frequencies ω up to Nyquist frequency ωN yq, a(ω) is the Fourier transform
146
of the accelerometric recordings. R(n) = ||rn− rs||is the distance between the source and
147
the receiver and h is the plate thickness. Depending on the plate material there could be a
148
viscous attenuation factor e(2γ(ω)R(n)) added to the right side of the Eq. (1) to account for
149
viscous energy losses where γ(ω) is the viscous attenuation inverse distance. However, for
150
glass plates and the distances that are used in this experiment viscous attenuation can be
151
neglected (i.e. γ ≈ 0 [Farin et al., 2015]). In the experimental setup, 4 sensors are placed
152
on the bottom glass plate on different locations (see Figure 1b and c) to have a good
tial coverage. Standard deviation σ(rs)for source energy Es at different test positions rs
154
on a regular grid for 4 different sensors are calculated. The minimum of this standard
de-155
viation indicates over all tested positions rs the source location [Turkaya et al., 2016]. We
156
used 5 mm grid spacing for the trial positions rs on the 45 cm × 30 cm area covered by
157
the porous medium inside the Hele-Shaw cell.
158
4 Image processing for deformation localization
159
The optical images were captured via a high-speed camera (FastCam SA5 - Photron,
160
recorded with 125 or 1000 fps with a resolution 1024 × 1024 pixels) during the
exper-161
iments. These images are investigated to localize the deformation corresponding to the
162
time interval when the acoustic signal is emitted. The deformation of the medium
dur-163
ing the acoustic emission is analyzed based on the image analysis techniques eventually
164
producing frame-to-frame displacement fields of the porous medium [Eriksen et al., 2015,
165
2017b,a; Niebling et al., 2010; Travelletti et al., 2012; Chevalier et al., 2009].
166
First, two successive images corresponding to the start and the end of the
acous-167
tic event is taken. Following this pre-treatment, a Digital Image Correlation (DIC)
pro-168
cedure, called Ncorr (an open source 2D digital image correlation MATLAB software)
169
is applied to obtain frame-to-frame displacement fields. Ncorr cross-correlates
subwin-170
dows between two images to find displacement fields in between. A detailed description
171
of Ncorr is given in Blaber et al. [2015].
172
In Figure 2(a), an example of the displacement magnitude field obtained is given
173
in the background. This map shows the magnitude of the absolute displacement of the
174
medium (without any defined direction in the format of || ¯u|| = qu2x+ u2y where ux,y are
175
the displacements in directions x and y) occurring between two images taken at 8 ms from
176
each other. The colormap shows the norm of the displacement field over the Hele-Shaw
177
cell. As it can be seen for this snapshot, the displacements are focused on the fingertips.
178
However, it is still possible to see nonzero displacements (of lower amplitudes) farther
179
from the fingertips into the porous medium.
180
5 Results and Discussion
181
In Figure 2 the localization for an acoustic event is given. Displacement maps (in
182
grey) are overlaid by acoustic localization results. Markers with different colors are
lated for different time window lengths to define the primary signal (see Supplementary
184
Figure S1 for window lengths). The size of the time window is set to extend stepwise to
185
give multiple estimations for a single event for a better comparison with DIC results. DIC
186
gives us an idea about the evolution of the signal location by indicating the location of the
187
displacement occurred during this time interval. In Figure 2 we see that the event source
188
starts inside the porous medium and progresses towards the channel tips. Moreover, by
189
increasing the size of the time window of the signal, we increase the sensitivity of the
190
sensors for the waves coming from a larger area. The waves propagating on thin plates
-191
similar to the glass plates which are used in this experimental study - may propagate at
192
different velocities as a function of their frequency, which is the definition of dispersive
193
waves. In this work, the "dispersivity" of the Lamb Waves are taken into account in wave
194
velocity calculations using experimental and theoretical computations [Royer and
Dieule-195
saint, 2000].
196
We increase the temporal resolution of the high-speed camera to record these events
197
in more details. In Figure 3, compared to the displacement magnitude given in Figure 2(a)
198
we increased the temporal resolution to 1000 frames per second (initially 125 fps).
More-199
over, to increase the spatial resolution of the images (and the resulting displacement maps)
200
we are focusing on sub-parts of the Hele-Shaw cell where most of the grain displacement
201
takes place. These settings allow us to follow the stick-slip events using the optical
equip-202
ment with higher spatial and temporal resolution. In Figure 3(b) we see the location of the
203
analyzed area in the cell (the channels are white, the granular porous medium is black, the
204
analyzed part of the medium is grey).
205
Figure 3(b) also shows us how this stick-slip event starts inside the zone being
com-206
pacted around 20 cm away from the tip of the channels with a decompacting zone behind,
207
and the pulse, pair of compacting zone and decompacting zone behind, travels backward
208
towards the fingertip (in a direction opposite to the grains direction) propagates towards
209
the tip of the channels. This is very similar to the phenomenon that we observed in
Fig-210
ure 2(a) where the source of the microseismic emission starts inside the porous medium
211
and progresses towards the channel tips (see the encircled zone). The first part of the
sig-212
nal is more sensitive to the start of the event than the whole slip event. Hence, they locate
213
the equivalent of the epicenter, which is typically ahead of the fingers, as illustrated in
214
Figure 3. Later on, the displacement gets distributed around most of the fingertips, and
215
ends up with the slip of the grains around the tips. The ESEH method is more sensitive
to observe this evolution than the conventional arrival-time-based seismic location
meth-217
ods since the arrival time of the event does not vary with time but the energy emitted per
218
second does. As the time window gets enlarged, the sensors are more and more sensitive
219
to signals coming from a larger and larger area, and the resulting location, which
consid-220
ers that the source is point-like in the methods, seems to come approximately from points
221
belonging to the mobile region, closer to the fingertips.
222
6 Conclusion
223
In this article, we show that the digital images and acoustic signals are very good
224
(and coherent) monitoring tools to detect and localize fracturing and channeling in a porous
225
medium. Different acoustic events having different natures (and locations) are investigated
226
optically and acoustically (see Supplementary Figures S5-27 for more events and
corre-227
sponding event recordings). The deformation magnitude maps obtained from digital
im-228
age correlation method are compared with the acoustic signal based source localization
229
results. The size of the time windows was set to extend freely so that the method would
230
give multiple results for a single event for a better comparison. Depending on the
polar-231
ization found on different sensors, it is possible to define the type of the source leading
232
acoustic emissions. Localization results seem to fit well with displacement map obtained
233
from the optical analysis techniques.
234
Acknowledgments
235
We would like to thank Alain Steyer and Miloud Talib for the technical support. This
236
project has received funding from the European Union’s Seventh Framework Programme
237
for research under grant agreement no 316889 - FLOWTRANS, INSU ALEAS TelluS
238
program, the International Associate Laboratory France-Norway on Deformation Flow and
239
fracture of disordered Materials LIA D-FFRACT, from the Universities of Oslo and
Stras-240
bourg via a gjesteforsker program and an IDEX Espoirs award. Furthermore, this work
241
was partly supported by the Research Council of Norway through its Centres of
Excel-242
lence funding scheme, project number 262644 and grant 213462/F20. The experimental
243
dataset and the Matlab routines used in this study can be found on www.doi.org/10.5281/zenodo.1316548
244
References
246
Accutech (1994), Accutech Pneumatic Fracturing Extraction and Hot Gas Injection, Phase
247
One: Applications Analysis Report, DIANE Publishing Company.
248
Aki, K., and P. G. Richards (2002), Quantitative Seismology, 2nd Ed., University Science
249
Books.
250
Allen, R. V. (1978), Automatic earthquake recognition and timing from single traces,
Bul-251
letin of the Seismological Society of America, 68(5), 1521–1532.
252
Aochi, H., B. Poisson, R. Toussaint, and J. Schmittbuhl (2011), Induced seismicity along
253
a fault due to fluid circulation: conception and application, in Japan Geoscience Union
254
Meeting 2011, May 2011, Makuhari, Chiba, Japan.
255
Baer, M., and U. Kradolfer (1987), An automatic phase picker for local and teleseismic
256
events, Bulletin of the Seismological Society of America, 77(4), 1437–1445.
257
Blaber, J., B. Adair, and A. Antoniou (2015), Ncorr: open-source 2d digital image
correla-258
tion matlab software, Experimental Mechanics, 55(6), 1105–1122.
259
Brandstein, M., J. Adcock, and H. Silverman (1997), A closed-form location estimator for
260
use with room environment microphone arrays, Speech and Audio Processing, IEEE,
261
5(1), 45–50, doi:10.1109/89.554268.
262
Butterworth, S. (1930), On the theory of filter amplifiers, Wireless Engineer, 7(6), 536–
263
541.
264
Candela, T., B. Wassing, J. Ter Heege, and L. Buijze (2018), How earthquakes are
in-265
duced, Science, 360(6389), 598–600.
266
Charléty, J., N. Cuenot, L. Dorbath, C. Dorbath, H. Haessler, and F. M. (2007), Large
267
earthquakes during hydraulic stimulations at the geothermal site of soultz-sous-forets,
268
International Journal of Rock Mechanics and Mining Sciences, 44(8), 1091 – 1105, doi:
269
http://dx.doi.org/10.1016/j.ijrmms.2007.06.003.
270
Chevalier, C., A. Lindner, M. Leroux, and E. Clément (2009), Morphodynamics during air
271
injection into a confined granular suspension, Journal of Non-Newtonian Fluid
Mechan-272
ics, 158(1), 63–72.
273
Christenson, B., A. Reyes, R. Young, A. Moebis, S. Sherburn, J. Cole-Baker, and K.
Brit-274
ten (2010), Cyclic processes and factors leading to phreatic eruption events: Insights
275
from the 25 september 2007 eruption through ruapehu crater lake, new zealand, Journal
276
of Volcanology and Geothermal Research, 191(1-2), 15–32.
Cornet, F. (2015), Elements of Crustal Geomechanics, Cambridge University Press.
278
Cornet, F., J. Helm, H. Poitrenaud, and A. Etchecopar (1998), Seismic and aseismic slips
279
induced by large-scale fluid injections, in Seismicity Associated with Mines, Reservoirs
280
and Fluid Injections, pp. 563–583, Springer.
281
Cuenot, N., C. Dorbath, and L. Dorbath (2008), Analysis of the microseismicity induced
282
by fluid injections at the egs site of soultz-sous-forets (alsace, france): Implications
283
for the characterization of the geothermal reservoir properties, Pure and Applied
Geo-284
physics, 165(5), 797–828, doi:10.1007/s00024-008-0335-7.
285
Dorbath, L., N. Cuenot, A. Genter, and M. Frogneux (2009), Seismic response of the
286
fractured and faulted granite of soultz-sous-forets (france) to 5 km deep massive
wa-287
ter injections, Geophysical Journal International, 177(2), 653–675,
doi:10.1111/j.1365-288
246X.2009.04030.x.
289
Earle, P. S., and P. M. Shearer (1994), Characterization of global seismograms using an
290
automatic-picking algorithm, Bulletin of the Seismological Society of America, 84(2),
291
366–376.
292
Elnahrawy, E., X. Li, and R. Martin (2004), The limits of localization using signal
293
strength: a comparative study, in Sensor and Ad Hoc Communications and Networks,
294
IEEE, pp. 406–414, doi:10.1109/SAHCN.2004.1381942.
295
Eriksen, F. K., R. Toussaint, K. J. Måløy, and E. G. Flekkøy (2015), Invasion patterns
296
during two-phase flow in deformable porous media, Frontiers in Physics, 3, 81.
297
Eriksen, F. K., R. Toussaint, A. L. Turquet, K. J. Måløy, and E. G. Flekkøy (2017a),
Pres-298
sure evolution and deformation of confined granular media during pneumatic fracturing
299
(in review), Phys. Rev. E.
300
Eriksen, F. K., R. Toussaint, A. L. Turquet, K. J. Måløy, and E. G. Flekkøy (2017b),
301
Pneumatic fractures in confined granular media, Phys. Rev. E, 95, 062,901, doi:
302
10.1103/PhysRevE.95.062901.
303
Eriksen, F. K., R. Toussaint, A. L. Turquet, K. J. Måløy, and E. G. Flekkøy (2018),
Pres-304
sure evolution and deformation of confined granular media during pneumatic fracturing,
305
Phys. Rev. E, 97, 012,908, doi:10.1103/PhysRevE.97.012908.
306
Farin, M., A. Mangeney, R. Toussaint, J. de Rosny, N. Shapiro, T. Dewez, C. Hibert,
307
C. Mathon, O. Sedan, and F. Berger (2015), Characterization of rockfalls from seismic
308
signal: insights from laboratory experiments, JGR: Solid Earth, 120(10), 7102–7137.
Farin, M., A. Mangeney, J. De Rosny, R. Toussaint, J. Sainte-Marie, and N. Shapiro
310
(2016), Experimental validation of theoretical methods to estimate the energy radiated
311
by elastic waves during an impact, Journal of Sound and Vibration, 362, 176–202.
312
Fehler, M., L. House, and H. Kaieda (), Determining planes along which
earth-313
quakes occur: Method and application to earthquakes accompanying hydraulic
frac-314
turing, Journal of Geophysical Research: Solid Earth, 92(B9), 9407–9414, doi:
315
10.1029/JB092iB09p09407.
316
Fink, M. (2015), Acoustic imaging with time reversal methods: From medicine to ndt,
317
AIP Conference Proceedings, 1650(1), 13–23, doi:http://dx.doi.org/10.1063/1.4914591.
318
Gao, F., H. Xie, F. Zhou, Y. Ju, L. Xie, Y. Liu, Y. Gao, J. Liu, and R. Zhang (2014),
319
Pneumatic fracturing method and system for exploiting shale gas, uS Patent App.
320
14/335,935.
321
Garnier, J., and M. Fink (2015), Super-resolution in time-reversal focusing on a moving
322
source, Wave Motion, 53, 80 – 93, doi:http://dx.doi.org/10.1016/j.wavemoti.2014.11.005.
323
Gershman, A., V. Turchin, and V. Zverev (1995), Experimental results of localization of
324
moving underwater signal by adaptive beamforming, Signal Processing, IEEE, 43(10),
325
2249–2257, doi:10.1109/78.469863.
326
Häring, M. O., U. Schanz, F. Ladner, and B. C. Dyer (2008), Characterisation of the basel
327
1 enhanced geothermal system, Geothermics, 37(5), 469–495.
328
Hibert, C., A. Mangeney, G. Grandjean, and S. Nikolai (2011), Slope instabilities in
329
Dolomieu crater, Réunion Island: From seismic signals to rockfall characteristics,
Jour-330
nal of Geophysical Research - earth surface, 116, F04,032, doi:10.1029/2011JF002038.
331
Holland, A. A. (2013), Earthquakes triggered by hydraulic fracturing in south?central
ok-332
lahomaearthquakes triggered by hydraulic fracturing in south?central oklahoma, Bulletin
333
of the Seismological Society of America, 103(3), 1784, doi:10.1785/0120120109.
334
Jamtveit, B., Y. Ben-Zion, F. Renard, and H. Austrheim (2018), Earthquake-induced
trans-335
formation of the lower crust, Nature, 556(7702), 487–491,
doi:10.1038/s41586-018-336
0045-y.
337
Jolly, A., P. Jousset, J. Lyons, R. Carniel, N. Fournier, B. Fry, and C. Miller (2014),
338
Seismo-acoustic evidence for an avalanche driven phreatic eruption through
339
a beheaded hydrothermal system: An example from the 2012 tongariro
erup-340
tion, Journal of Volcanology and Geothermal Research, 286, 331 – 347, doi:
341
https://doi.org/10.1016/j.jvolgeores.2014.04.007.
Kobchenko, M., A. Hafver, E. Jettestuen, O. Galland, F. Renard, P. Meakin, B. Jamtveit,
343
and D. K. Dysthe (2013), Drainage fracture networks in elastic solids with internal fluid
344
generation, EPL (Europhysics Letters), 102(6), 66,002.
345
Malioutov, D., M. Cetin, and A. Willsky (2005), A sparse signal reconstruction
perspec-346
tive for source localization with sensor arrays, Signal Processing, IEEE, 53(8), 3010–
347
3022, doi:10.1109/TSP.2005.850882.
348
Manga, M., and E. Brodsky (2006), Seismic triggering of eruptions in the far field:
Volca-349
noes and geysers, Annu. Rev. Earth Planet. Sci, 34, 263–291.
350
Niebling, M. J., E. G. Flekkøy, K. J. Måløy, and R. Toussaint (2010), Mixing of a
granu-351
lar layer falling through a fluid, Physical Review E - Statistical, Nonlinear, and Soft
Mat-352
ter Physics, 82(1).
353
Oppenheimer, D. H. (1986), Extensional tectonics at the geysers geothermal area,
califor-354
nia, Journal of Geophysical Research: Solid Earth, 91(B11), 11,463–11,476.
355
Peacock, M. (1996), Acoustic emission for detection of process-related damage in pressure
356
vessels and piping, pp. 2947 – 2947 – 9, doi:10.1117/12.259158.
357
Poland, M. P., A. Miklius, A. J. Sutton, and C. R. Thornber (2012), A mantle-driven surge
358
in magma supply to k¯ılauea volcano during 2003–2007, Nature Geoscience, 5(4), 295.
359
Rivalta, E., and P. Segall (2007), Magma compressibility and the missing source for some
360
dike intrusions, Geophysical Research Letters, 35(4), doi:10.1029/2007GL032521.
361
Royer, D., and E. Dieulesaint (2000), Elastic Waves in Solids I: Free and Guided
Propaga-362
tion, Advanced Texts in Physics, Springer.
363
Schuring, J., D. Kosson, C. Fitzgerald, and S. Venkatraman (1996), Pneumatic
fractur-364
ing and multicomponent injection enhancement of in situ bioremediation, uS Patent
365
5,560,737.
366
Stanchits, S., S. Mayr, S. Shapiro, and G. Dresen (2011), Fracturing of porous
367
rock induced by fluid injection, Tectonophysics, 503(1), 129 – 145, doi:
368
https://doi.org/10.1016/j.tecto.2010.09.022, thermo-Hydro-Chemo-Mechanical Couplings
369
in Rock Physics and Rock Mechanics.
370
Sudo, Y., H. Ono, A. W. Hurst, T. Tsutsui, T. Mori, M. Nakaboh, Y. Matsumoto, M. Sako,
371
S. Yoshikawa, M. Tanaka, Y. Kobayashi, T. Hashimoto, T. Hoka, T. Yamada, H.
Ma-372
suda, and S. Kikuchi (1998), Seismic activity and ground deformation associated
373
with 1995 phreatic eruption of kuju volcano, kyushu, japan, Journal of
Volcanol-374
ogy and Geothermal Research, 81(3), 245 – 267,
0273(98)00011-0.
376
Tazieff, H. (1989), Mechanisms of the nyos carbon dioxide disaster and of so-called
377
phreatic steam eruptions, Journal of volcanology and geothermal research, 39(2-3), 109–
378
116.
379
Terlizzi, J., and J. Minoo (2009), Multi-touch display screen with localized tactile
feed-380
back, uS Patent App. 12/069,352.
381
Travelletti, J., C. Delacourt, P. Allemand, J.-P. Malet, J. Schmittbuhl, R.
Tous-382
saint, and M. Bastard (2012), Correlation of multi-temporal ground-based
op-383
tical images for landslide monitoring: Application, potential and limitations,
384
{ISPRS} Journal of Photogrammetry and Remote Sensing, 70(0), 39 – 55, doi:
385
http://dx.doi.org/10.1016/j.isprsjprs.2012.03.007.
386
Trnkoczy, A. (1998), Understanding & setting sta/lta trigger algorithm parameters for the
387
k2, Application Note, 41, 16–20.
388
Turkaya, S., R. Toussaint, F. K. Eriksen, M. Zecevic, G. Daniel, E. G. Flekkøy, and K. J.
389
Måløy (2015), Bridging aero-fracture evolution with the characteristics of the acoustic
390
emissions in a porous medium, Frontiers in Physics, 3, 70.
391
Turkaya, S., R. Toussaint, F. K. Eriksen, O. Lengliné, G. Daniel, E. G. Flekkøy, and K. J.
392
Måløy (2016), Note: Localization based on estimated source energy homogeneity,
Re-393
view of Scientific Instruments, 87(9), 096,101.
394
Turquet, A., T. Bodin, P. Arroucau, M. Sylvander, and K. Manchuel (2018a), Quantifying
395
the seismic location uncertainties in french seismicity catalogues: Application to the
396
pyrenees (in prep), Seismological Research Letters.
397
Turquet, A. L., R. Toussaint, F. K. Eriksen, G. Daniel, D. Koehn, and E. G. Flekkøy
398
(2018b), Microseismic emissions during pneumatic fracturing: A numerical model to
399
explain the experiments, Journal of Geophysical Research: Solid Earth, 123(8), 6922–
400
6939, doi:10.1029/2017JB014613.
401
Valin, J., F. Michaud, J. Rouat, and D. Letourneau (2003), Robust sound source
localiza-402
tion using a microphone array on a mobile robot, in IROS 2003. Proceedings. IEEE/RSJ,
403
vol. 2, pp. 1228–1233 vol.2, doi:10.1109/IROS.2003.1248813.
404
Valkó, P., and M. Economides (1995), Hydraulic fracture mechanics, Wiley.
405
Wong, J., L. Han, J. Bancroft, and R. Stewart (2009), Automatic time-picking of first
ar-406
rivals on noisy microseismic data, CSEG. 0 0.2 0.4 0.6 0.8, 1(1.2), 1–4.
Zhu, Q., S. Tannenbaum, and S. H. Kurtzman (2007), Optical tomography
408
with ultrasound localization for breast cancer diagnosis and treatment
mon-409
itoring, Surgical Oncology Clinics of North America, 16(2), 307 – 321, doi:
410
http://dx.doi.org/10.1016/j.soc.2007.03.008, pre and Postoperative Cancer
Imag-411
ing:Practical and Innovative Approaches.
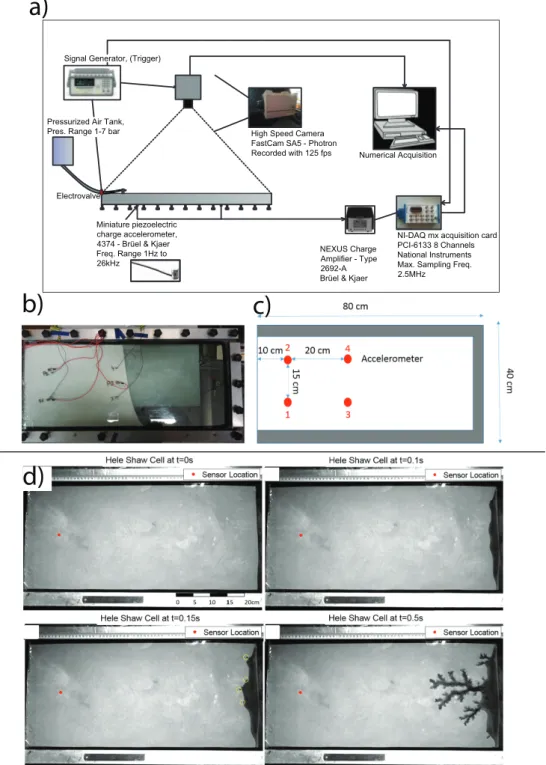
Miniature piezoelectric charge accelerometer, 4374 - Brüel & Kjaer Freq. Range 1Hz to 26kHz
NI-DAQ mx acquisition card PCI-6133 8 Channels National Instruments Max. Sampling Freq. 2.5MHz NEXUS Charge Amplifier - Type 2692-A Brüel & Kjaer High Speed Camera FastCam SA5 - Photron
Recorded with 125 fps Numerical Acquisition
Pressurized Air Tank, Pres. Range 1-7 bar
Signal Generator, (Trigger)
Electrovalve
a)
b)
c)
d)
Figure 1. (a) The acquisition chain of the aero-fracturing experiments with a Hele-Shaw cell. The signal
acquisition card, camera and the electrovalve connected to the air pump are triggered at the same time via a TTL signal sent from the signal generator to have synchronized optical and acoustic data. The sensors are placed on the bottom glass plate of the Hele-Shaw cell using a solid crystallized phenyl salicylate. (b) The image showing the accelerometers stick under the Hele-Shaw cell is given. In (c), accelerometers are sketched and numbered. Red dots show the positions of the accelerometers. (d) We present several snapshots of the cell 112 113 114 115 116 117