HAL Id: hal-00301365
https://hal.archives-ouvertes.fr/hal-00301365
Submitted on 5 Aug 2004HAL is a multi-disciplinary open access
archive for the deposit and dissemination of sci-entific research documents, whether they are pub-lished or not. The documents may come from teaching and research institutions in France or abroad, or from public or private research centers.
L’archive ouverte pluridisciplinaire HAL, est destinée au dépôt et à la diffusion de documents scientifiques de niveau recherche, publiés ou non, émanant des établissements d’enseignement et de recherche français ou étrangers, des laboratoires publics ou privés.
Non-coincident inter-instrument comparisons of ozone
measurements using quasi-conservative coordinates
L. R. Lait, P. A. Newman, M. R. Schoeberl, T. Mcgee, L. Twigg, E. V.
Browell, M. A. Fenn, W. B. Grant, C. F. Butler, R. Bevilacqua, et al.
To cite this version:
L. R. Lait, P. A. Newman, M. R. Schoeberl, T. Mcgee, L. Twigg, et al.. Non-coincident inter-instrument comparisons of ozone measurements using quasi-conservative coordinates. Atmospheric Chemistry and Physics Discussions, European Geosciences Union, 2004, 4 (4), pp.4383-4406. �hal-00301365�
ACPD
4, 4383–4406, 2004 Non-coincident inter-comparisons L. R. Lait et al. Title Page Abstract Introduction Conclusions References Tables Figures J I J I Back CloseFull Screen / Esc
Print Version Interactive Discussion
© EGU 2004 Atmos. Chem. Phys. Discuss., 4, 4383–4406, 2004
www.atmos-chem-phys.org/acpd/4/4383/ SRef-ID: 1680-7375/acpd/2004-4-4383 © European Geosciences Union 2004
Atmospheric Chemistry and Physics Discussions
Non-coincident inter-instrument
comparisons of ozone measurements
using quasi-conservative coordinates
L. R. Lait1, P. A. Newman2, M. R. Schoeberl2, T. McGee2, L. Twigg1, E. V. Browell3, M. A. Fenn3, W. B. Grant3, C. F. Butler3, R. Bevilacqua4,
J. Davies5, H. DeBacker6, S. B. Andersen6, E. Kyr ¨o7, R. Kivi7, P. von der Gathen8, H. Claude9, A. Benesova10, P. Skrivankova10, V. Dorokhov11, I. Zaitcev11,
G. Braathen12, M. Gil13, Z. Litynska14, D. Moore15, and M. Gerding16
1
Science Systems and Applications, Inc., Lanham, Maryland, USA
2
NASA Goddard Space Flight Center, Greenbelt, Maryland, USA
3
NASA Langley Research Center, Langley, Virginia, USA
4
U. S. Naval Research Laboratory
5
Meteorological Service of Canada, Ontario, Canada
6
Danish Meteorological Institute, Copenhagen, Denmark
7
Finnish Meteorological Institute, Sodankyl ¨a, Finland
8
Alfred Wegener Institute, Potsdam, Germany
9
Deutscher Wetterdienst Meteorologisches Observatorium, Hohenpeissenberg, Germany
10
ACPD
4, 4383–4406, 2004 Non-coincident inter-comparisons L. R. Lait et al. Title Page Abstract Introduction Conclusions References Tables Figures J I J I Back CloseFull Screen / Esc
Print Version Interactive Discussion
© EGU 2004
11
Central Aerological Observatory, Dolgoprudny, Russia
12
Norsk Institutt for Luftforskning, Kjeller, Norway
13
Instituto Nacional de T ´ecnica Aeroespacial, Madrid, Spain
14
Institute of Meteorology and Water Management, Legionowo, Poland
15U. K. Meteorological Office, Wokingham, Berks, United Kingdom 16
Leibniz-Institute of Atmospheric Physics, K ¨uhlungsborn, Germany
Received: 28 May 2004 – Accepted: 5 July 2004 – Published: 5 August 2004 Correspondence to: L. R. Lait (lait@code916.gsfc.nasa.gov)
ACPD
4, 4383–4406, 2004 Non-coincident inter-comparisons L. R. Lait et al. Title Page Abstract Introduction Conclusions References Tables Figures J I J I Back CloseFull Screen / Esc
Print Version Interactive Discussion
© EGU 2004
Abstract
Ozone measurements from ozonesondes, AROTAL, DIAL, and POAM III instruments during the SOLVE-2/VINTERSOL period are composited in a time-varying, flow-follow-ing quasi-conservative (PV-θ) coordinate space; the resultflow-follow-ing composites from each instrument are mapped onto the other instruments’ locations and times. The mapped
5
data are then used to intercompare data from the different instruments. Overall, the four ozone data sets are found to be in good agreement. AROTAL shows somewhat lower values below 16 km, and DIAL has a positive bias at the upper limits of its altitude range. These intercomparisons are consistent with those obtained from more conventional near-coincident profiles, where available. Although the PV-θ mapping technique entails
10
larger uncertainties of individual profile differences compared to direct near-coincident comparisons, the ability to include much larger numbers of comparisons can make this technique advantageous.
1. Introduction
The Kiruna deployments of the SOLVE-2 and VINTERSOL field experiments took
15
place in January and February 2003. During this period, a number of different in-struments measured stratospheric ozone. On board the NASA DC-8 aircraft were the Airborne Raman Ozone, Temperature, and Aerosol Lidar (AROTAL) and the Di fferen-tial Absorption Lidar (DIAL), as well as in situ instruments such as FASTOZ and the Gas and Aerosol Measurement System/Langley Airborne Measurement Spectrometer
20
(GAMES/LAABS). Other instruments, such as the balloon-borne MkIV interferome-ter, flew on other platforms or took ground-based measurements. A number of sites launched ozonesondes in coordination with the campaigns. In addition, data from the Polar Ozone and Aerosol Measurement III (POAM III) solar extinction instrument on the SPOT-4 spacecraft were made available to the mission teams.
25
ACPD
4, 4383–4406, 2004 Non-coincident inter-comparisons L. R. Lait et al. Title Page Abstract Introduction Conclusions References Tables Figures J I J I Back CloseFull Screen / Esc
Print Version Interactive Discussion
© EGU 2004 coincident, and the DC-8 flew over Ny ˚Alesund in coordination with a number of the
sonde launches there. But because many of the instruments operated on different platforms at different times and locations, opportunities for measurement intercompar-ison were less than plentiful for most instruments. Aside from the AROTAL/DIAL data, the small number of near-coincident measurement sets make a statistical evaluation of
5
inter-instrument differences problematic.
Other approaches are possible that can compare non-coincident data. The trajectory-mapping approach ofMorris et al. (2000), the trajectory-hunting method of Danilin et al.(2003), and the MATCH technique ofRex et al.(1999) are examples.
In this work, a quasi-conservative coordinate method is employed. Described in
10
Schoeberl and Lait(1991), this technique depends upon the premise that a reasonably long-lived trace gas should be well-mixed along contours of potential vorticity (PV) on a surface of constant potential temperature (θ) (Leovy et al.,1985). By using PV and θ as coordinates, averaging mixing ratios near a set of points in that coordinate space should yield an accurate picture of a time-invariant trace gas distribution in PV-θ space,
15
in the absence of diabatic effects and chemical changes. In the lower stratosphere at middle to higher latitudes, these latter effects often may safely be ignored for short time periods of approximately 10 days or less. For longer periods, they must be taken into account somehow.
PV-θ analysis was used in Schoeberl et al. (1989) and Lait et al. (1990) to map
20
measurements onto a three-dimensional field, and inKyr ¨o et al.(2000) andLait et al. (2002) to determine stratospheric ozone loss in the Arctic. Lary et al. (1995) used a similar method to initialize model simulations. The quasi-conservative coordinate method can be also useful in inter-instrument comparisons, as seen inRedaelli et al. (1994),Manney et al.(2001), andRandall et al.(2002).
25
In this work, we intercompare ozone measurements from four instruments: AROTAL, DIAL, POAM III, and the ozonesondes. Section2 describes each of these data sets briefly; then the analysis technique is described in Sect.3. Results follow in Sect.4.
ACPD
4, 4383–4406, 2004 Non-coincident inter-comparisons L. R. Lait et al. Title Page Abstract Introduction Conclusions References Tables Figures J I J I Back CloseFull Screen / Esc
Print Version Interactive Discussion
© EGU 2004
2. Data
The SOLVE-2/VINTERSOL joint field experiment took place in January through early February 2003. We used the data from 1 January through 10 February.
The NASA Goddard Space Flight Center’s AROTAL instrument is a lidar that uses Rayleigh scattering from Eximer and YAG lasers transmitting at 308 and 355 nm to
5
measure ozone, temperature, and aerosols. A more complete discussion of the instru-ment may be found inMcGee et al. (2001) and Burris et al. (2002). For the SOLVE-2/VINTERSOL mission archive, AROTAL reports profiles every 22 s, averaged over 1.2 min. The altitude of the profiles depends on the altitude of the DC-8 aircraft, but over the middle of the flight the data tend to range from approximately 14 km to 35 km.
10
Vertical resolution of the reported data is approximately 150 m. Data were collected for 12 flights of the DC-8. To avoid problems with sunlight increasing noise in the mea-surements, only profiles taken where the local solar zenith angle is greater than 95◦ were used.
A second lidar, the NASA Langley Research Center’s DIAL instrument, also flew on
15
the DC-8. This instrument uses two YAG lasers transmitting at multiple frequencies to observe ozone below and above the aircraft. The DIAL data in the mission archive consist of profiles spaced about a minute apart. As with AROTAL, the altitudes covered change with the altitude of the aircraft, but typical coverage is from a few kilometers above the surface to around 25 km, with a small altitude gap near the aircraft itself.
20
Vertical resolution reported is approximately 75 m. Data were collected for 14 flights (including two pre-mission test flights before the deployment to Kiruna). Details of this instrument may be found inBrowell et al.(2003),Browell et al. (1998), andRichter et et al. (1997).
A total of 213 balloon-launched sonde profiles from 21 ground stations were used
25
in this analysis. These included special sondes launched for VINTERSOL, as well as those launched by the Meteorological Service of Canada, the World Meteorological Organization network, Japan, and Russia. Data were used from the stations at Alert,
ACPD
4, 4383–4406, 2004 Non-coincident inter-comparisons L. R. Lait et al. Title Page Abstract Introduction Conclusions References Tables Figures J I J I Back CloseFull Screen / Esc
Print Version Interactive Discussion
© EGU 2004 Churchill, Eureka, Goosebay, Resolute, Stonyplain, Hohenpeissenberg, Jokioinen,
So-dankyla, Keflavik, Kuehlungsborn, Legionowo, Lerwick, Ny ˚Alesund, Orland, Prague, Scoresbysund, Thule, Uccle, Salekhard, and Yakutsk. Altitude ranges vary greatly, but the sondes got as high as 29 km. Reported vertical resolution also varies, from about 10 m to around 60 m.
5
The POAM III solar occultation instrument is described inLucke et al. (1999). It is a nine-channel photometer that uses solar occultation to measure atmospheric extinction in bands from 0.354 to 1.018 µm to retrieve temperature and multiple species, including ozone. Fourteen profiles are taken each day, spaced around a latitude circle that moves slowly in time. Vertical resolution is approximately 1 km (Lumpe et al.,2003).
10
To apply the quasi-conservative coordinate analysis, values of potential vorticity and potential temperature must be obtained at each measurement location and time. For this work, these are obtained by interpolating three-dimensional gridded analyses from the Data Assimilation Office (now the Global Modeling and Assimilation Office) of NASA’s Goddard Space Flight Center. These analyses were chosen because of their
15
relatively fine horizontal and temporal resolution, as well as their altitude range. The analyses used were chosen from the “final look” product generated from the GEOS-4 system. GEOS-4 was the successor to the GEOS-1 system documented by Pfaendt-ner et al. (1995). These data grids extend from 1000 to 0.2 hPa, have a horizontal resolution of 1.25◦longitude by 1.0◦ latitude, and are produced four times daily.
20
3. Analysis
In order to derive meaningful statistics for both coincident and non-coincident compar-isons, it was necessary to obtain uncertainties associated with the ozone measure-ments. To estimate these uncertainties for AROTAL and DIAL, a standard variance profile for each instrument was constructed from the small-scale horizontal variations
25
of the all profiles from all flights. For ozonesondes, we used the larger of 5% of the measured value, or the variance about a linear fit within a 5 km segment. Uncertainties
ACPD
4, 4383–4406, 2004 Non-coincident inter-comparisons L. R. Lait et al. Title Page Abstract Introduction Conclusions References Tables Figures J I J I Back CloseFull Screen / Esc
Print Version Interactive Discussion
© EGU 2004 in the POAM III measurements were supplied in the data archive.
The measurements, with their uncertainties, locations, and times were collected for each instrument. (Note that for the sondes, the winds were used to estimate the hori-zontal location of each balloon during its ascent.) Modified potential vorticity (seeLait, 1994) and potential temperature were interpolated from the meteorological analysis
5
onto the measurement locations and times.
By computing autocorrelations of the lidar data along the flight, we were able to estimate the minimum horizontal separation to ensure independence of profiles as ap-proximately 400 km for AROTAL measurements and 375 km for DIAL. These distances are roughly consistent with those computed by Schoeberl et al. (2002) for the same
10
instruments. Because the profile sites for the sondes and POAM III data were widely separated, horizontal separations were not an issue for those instruments.
Minimum vertical separations between a profile’s measurements were similarly ob-tained. For AROTAL, the vertical separation was estimated to be 3 km; for DIAL, it was 4 km. For the sondes, it was 3 km, and for POAM data, 4 km.
15
Measurements closer than these horizontal and vertical separations were omitted from the analysis, so that the data going into the analysis could be considered inde-pendent of each other.
The analysis itself is similar to that in Lait et al. (2002). A regular grid in a PV-θ coordinate space was constructed, and PV and θ values interpolated from the analyses
20
were used to locate each ozone measurement in the coordinate space. Data from 1 January through 10 February were used; hence, diabatic effects and chemical changes needed to be accounted for. These effects both show up as a change in ozone over time at a given point in PV-θ space. To first order, they can be dealt with by applying a weighted linear time fit to the data near a given PV-θ gridpoint. Each point was
25
weighted inversely to its uncertainty and its distance from the PV-θ gridpoint being examined.
This procedure yields a set of slopes and intercepts, one for each gridpoint in the PV-θ coordinate space. From these, we can construct a composite field in PV-θ space
ACPD
4, 4383–4406, 2004 Non-coincident inter-comparisons L. R. Lait et al. Title Page Abstract Introduction Conclusions References Tables Figures J I J I Back CloseFull Screen / Esc
Print Version Interactive Discussion
© EGU 2004 for any moment in time; moreover, given the meteorological analyses we can map this
ozone field back into longitude-latitude-altitude space,.
Note that for instrument comparison purposes here, only the overall evolution of the ozone field is relevant. Whether changes in that field are caused by diabatic effects or by chemical loss/production is of no concern, and so there is no need to try to separate
5
those two effects.
Data from two instruments are compared by constructing a PV-θ composite field from one instrument and mapping its ozone values onto the locations and times of the second instrument. The differences between the two ozone values and the uncertain-ties associated with those differences are collected, and mean profiles of the biases
10
are computed for the mission period, taking the uncertainties into account.
4. Results
To validate the analysis technique, several tests were applied.
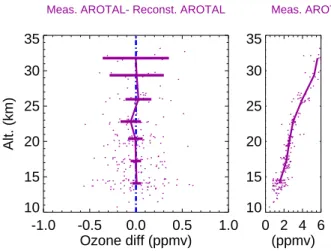
First, each instrument was compared against itself. That is, differences were char-acterized between the original measurements and those from PV-θ mapping of the
15
same instrument’s data. This test should reveal any biases or distortions introduced by the analysis technique itself, and it should also reveal the degree to which noise is introduced by errors in the meteorological fields, departures from the well-mixedness assumption, and so on. Figure1shows an example of the self-comparison for AROTAL data. The maximum difference, less than 0.1 ppmv near 22 km, is not statistically
dif-20
ferent from zero, and the rest of the profile is very close to zero. The self-comparisons for the other instruments show similar results: very small average differences, with at most minor statistically insignificant fluctuations.
The next test was to compute inter-instrument differences between AROTAL and DIAL using both near-coincident and non-coincident methods. Because both these
25
instruments flew aboard the same aircraft, a large number of near-coincident profiles could be collected. For the 12 SOLVE-2 flights of the DC-8, the two closest profiles of
ACPD
4, 4383–4406, 2004 Non-coincident inter-comparisons L. R. Lait et al. Title Page Abstract Introduction Conclusions References Tables Figures J I J I Back CloseFull Screen / Esc
Print Version Interactive Discussion
© EGU 2004 the two instruments were chosen; each profile pair also had to be separated from all
other profile pairs by at least 400 km. For each profile pair, the DIAL data were then interpolated to the AROTAL altitudes, and the two profiles were differenced.
Figure2shows the differences and their average profile. Above 20 km, DIAL ozone values are systematically higher than AROTAL. Below 16 km, AROTAL values are
5
higher.
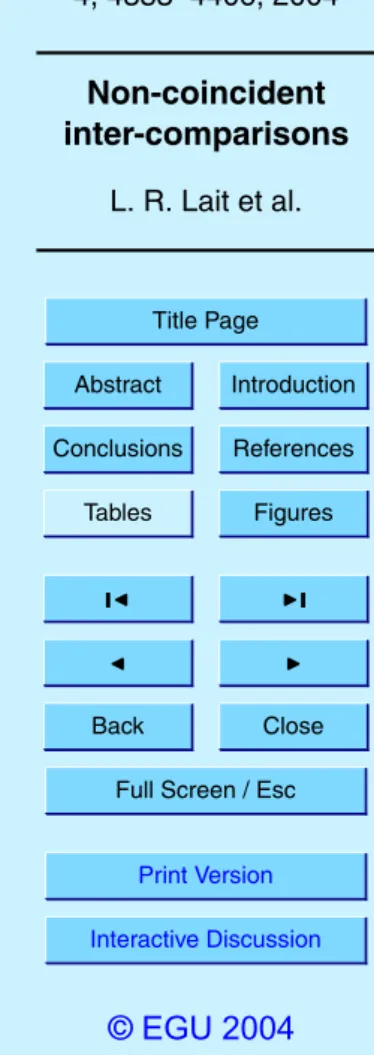
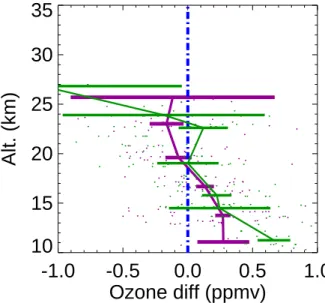
Comparing the AROTAL and DIAL data using the non-coincident PV-θ analysis yields similar results (Fig.3). Note that the measured-reconstructed differences are consis-tent with the reconstructed-measured differences. Of course, because the data being compared were in fact coincident, this is no more rigorous a test of the noncoincident
10
technique than the self-comparisons. Nevertheless, this comparison is useful for eval-uating the success of the next test.
A more demanding test is to compare true non-coincident DIAL and AROTAL data. To accomplish this, AROTAL data from the even-numbered flights were compared with DIAL data from the odd-numbered flights, and vice-versa. The results, shown in Figs.4
15
and 5, are consistent with the near-coincident comparisons, albeit with larger uncer-tainties (since they involved only half the data). Figure4matches the full data compar-ison quite well, while Fig.5has greater uncertainties but is still roughly consistent with the others.
Having confirmed that each instrument’s data compare well with themselves, and
20
that the AROTAL-DIAL non-coincident comparisons are similar to the coincident com-parisons, we proceeded to compare the other instruments’ data.
Figure6 shows the differences between AROTAL and the ozonesondes. There ap-pears to be a slight bias below 15 km, with AROTAL being perhaps 0.3 to 0.4 ppmv higher than the sondes near 12–13 km. Above 25 km, the ozonesondes are fewer in
25
number and their uncertainties are often larger, so that the error bars in the differences are much larger at those altitudes.
Likewise, the differences between DIAL and the sondes is shown in Fig. 7. Here, DIAL matches the sondes well at the lower altitudes, but DIAL is higher at the
upper-ACPD
4, 4383–4406, 2004 Non-coincident inter-comparisons L. R. Lait et al. Title Page Abstract Introduction Conclusions References Tables Figures J I J I Back CloseFull Screen / Esc
Print Version Interactive Discussion
© EGU 2004 most reaches of the instrument, above 25 km. Note also that the AROTAL-sonde and
DIAL-sonde differences are consistent with the AROTAL-DIAL differences.
Figures8and9show the POAM-AROTAL and POAM-DIAL differences, respectively. The POAM-AROTAL are qualitatively similar to biases noted inLumpe et al. (2003), where coincident comparisons were made between POAM III and AROTEL (an earlier
5
version of AROTAL) and DIAL during the first SOLVE campaign in the winter of 1999– 2000. The POAM-DIAL differences at the uppermost DIAL altitudes, however, are of different sign from those inLumpe et al.(2003).
Figure 10 compares the ozonesonde data with the POAM III profiles. A possible small bias appears near 20 km. At higher altitudes, between 25 and 30 km, there is
10
also a suggestion of a small positive bias, but again the the sonde measurements are fewer and less certain here.
These intercomparisons were repeated with meteorological analysis products from other institutions, and the results were similar.
5. Conclusions
15
Ozone measurements taken during the SOLVE-2/VINTERSOL field experiment from four instruments (AROTAL, DIAL, POAM III, and sondes) were compared. A quasi-conservative coordinate approach was employed to use non-coincident data for ment intercomparisons. Several tests of the method were applied. First, each instru-ment’s data were self-compared; the differences were zero, within the uncertainty
as-20
sociated with the technique. Second, the AROTAL and DIAL data were compared, with results similar to those from the straightforward near-coincident comparison. These tests demonstrate that the quasi-conservative technique does not introduce unusual or misleading artifacts into the data. To provide a true non-coincident data comparison, the DIAL data from the odd-numbered DC-8 flights were compared with AROTAL data
25
from the even-numbered flights, and vice versa. These results were consistent with the other DIAL-AROTAL comparisons, although the uncertainties were larger.
ACPD
4, 4383–4406, 2004 Non-coincident inter-comparisons L. R. Lait et al. Title Page Abstract Introduction Conclusions References Tables Figures J I J I Back CloseFull Screen / Esc
Print Version Interactive Discussion
© EGU 2004 Finally, all four data sets were intercompared. Between about 18 to 24 km, AROTAL
and DIAL agree fairly well (within 0.25 ppmv, or better than 10%). The AROTAL ozone values were found to be 0.1 to 0.6 ppmv higher than DIAL and the sondes below 16 km (roughly 20% at those altitudes), and DIAL values were higher than AROTAL and the sondes by 0.3 ppmv or more above 22 km (15 to 20%). DIAL matches very well with
5
the sonde data (better than 5%) between 13 and 25 km. The ozonesonde data match well with POAM III, except for a possible small bias in a region near 22 km.
This PV-θ analysis produces results with substantial uncertainties. The uncertainties associated with the limited-resolution analyzed PV and θ meteorological fields, limited sampling over regions of PV-θ space, potential failures in the assumptions necessary
10
for the method’s validity (e.g. homogeneity around a circumpolar PV-θ tube), and even a breakdown in PV-ozone correlations at high altitudes and low latitudes, can all con-tribute to the enlarged error bars. Certainly, then, direct comparison of large numbers of near-coincident measurements is preferred where it is possible. Nevertheless, the higher numbers of comparisons which are made possible by relaxing the requirement
15
for near-coincidence, can improve the statistics so that the results are useful despite their uncertainties.
Acknowledgements. We wish to acknowledge the DC-8 pilots and the flight and ground crews
who made the aircraft measurements possible under sometimes difficult conditions; the sonde launch personnel; the SOLVE-2 logistics staff and the personnel of the Arena Arctica in Kiruna,
20
Sweden; and SOLVE-2 and VINTERSOL management. This research was supported by the NASA’s Atmospheric Chemistry Modeling and Analysis Program and the Upper Atmosphere Research Program and NASA’s EOS Interdisciplinary Science Program.
References
Browell, E. V., Ismail, S., and Grant, W. B.: Differential Absorption Lidar (DIAL) measurements
25
from air and space, Appl. Phys.-B, 67, 399–410, 1998. 4387
Browell, E. V., Fenn, M. A., Butler, C. F., Grant, W. B., Brackett, V. G., Hair, J. W., Avery, M. A., Newell, R. E., Hu, Y., Fuelberg, H. E., Jacob, D. J., Anderson, B. E., Atlas, E. L., Blake,
ACPD
4, 4383–4406, 2004 Non-coincident inter-comparisons L. R. Lait et al. Title Page Abstract Introduction Conclusions References Tables Figures J I J I Back CloseFull Screen / Esc
Print Version Interactive Discussion
© EGU 2004
D. R., Brune, W. H., Dibb, J. E., Fried, A., Heikes, B. G., Sachse, G. W., Sandholm, S. T., Singh, H. B., Talbot, R. W., Vay, S. A., Weber, R. J., and Bartlett, K. B.: Large-scale ozone and aerosol distributions, air mass characteristics, and ozone fluxes over the western Pacific Ocean in late winter/early spring, J. Geophys. Res., 108, doi:10.1029/2002JD003290, 2003. 4387
5
Burris, J., McGee, T., Hoegy, W., Lait, L., Twigg, L., Sumnicht, G., Heaps, W., Hostetler, C., Bui, T. P., Neuber, R., and McDermid, I. S.: Validation of temperature measurements from the airborne Raman ozone temperature and aerosol lidar during SOLVE, J. Geophys. Res., 107, doi:10.1029/2001JD001028, 2002. 4387
Danilin, M. Y., Ko, M. K. W., Bevilacqua, R. M., Lyjak, L. V., Froidevaux, L., Santee, M. L.,
10
Zawadny, J. M., Hoppel, K. W., Richard, E. C., Spackman, J. R., Weinstock, E. M., Herman, R. L., McKenney, K. A., Wennberg, P. O., Eisle, F. L., Stempfle, R. M., Scott, C. J., Elkins, J. W., and Bui, T. V.: Comparison or ER-2 aircraft and POAM III, MLS, and SAGE II satellite measutements during SOLVE using traditional correlative analysis and trajectory hunting technique, J. Geophys. Res., 108, 8315, doi:10.1029/2001JD000781, 2003. 4386
15
Kyr ¨o, E., Kivi, R., Turunen, T., Aulamo, H., Rudakov, V. V., Khattatov, V., MacKenzie, A. R., Chipperfield, M. P., Lee, A. M., Stefanutti, L., and Ravegnani, F.: Ozone measurements during the Airborne Polar Experiment: aircraft instrument validation, isentropic trends, and hemispheric fields prior to the 1997 Arctic ozone depletion, J. Geophys. Res., 105, 14 599– 14 611, 2000. 4386
20
Lait, L.: An alternative form for potential vorticity, J. Atmos. Sci., 51, 1754–1759, 1994. 4389 Lait, L. R., Schoeberl, M. R., Newman, P. A., Proffitt, M. H., Lowenstein, M., Podolske, J. R.,
Strahan, S. E., Chan, K. R., Gary, B., Margitan, J. J., Browell, E., McCormick, M. P., and Torres, A.: Reconstruction of O3and N2O fields from ER-2, DC-8, and balloon observations, Geophys. Res. Lett., 17, 521–524, 1990. 4386
25
Lait, L. R., Schoeberl, M. R., Newman, P. A., McGee, T., Burris, J., Browell, E. V., Richard, E., Braathen, G. O., Bojkov, B. R., Goutail, F., von der Gathen, P., Kyr ¨o, E., Vaughan, G., Kelder, H., Kirkwood, S., Woods, P., Dorokhov, V., Zaitcev, I., Litynska, Z., Kois, B., Benesova, A., Skrivankova, P., De Backer, H., Davies, J., Jorgensen, T., and Mikkelsen, I. S.: Ozone loss from quasi-conservative coordinate mapping during the 1999–2000 SOLVE/THESEO 2000
30
Campaigns, J. Geophys. Res., 107, doi:10.1029/2001JD000998, 2002. 4386,4389
Lary, D. J., Chipperfield, M. P., Pyle, J. A., Norton, W. A., and Riishojgaard, L. P.: 3-dimensional tracer initialization and general diagnostics using equivalent PV
latitude-ACPD
4, 4383–4406, 2004 Non-coincident inter-comparisons L. R. Lait et al. Title Page Abstract Introduction Conclusions References Tables Figures J I J I Back CloseFull Screen / Esc
Print Version Interactive Discussion
© EGU 2004
potential-temperature coordinates, Quart. J. Royal Met. Soc., 121, 187–210, 1995. 4386 Leovy, C. B., Sun, C.-R., Hitchman, M. H., Remsberg, E. E., Russell III, J. M., Gordley, L. L.,
Gille, J. C., and Lyjak, L. V.: Transport of ozone in the middle stratosphere: evidence for wave breaking, J. Atmos. Sci., 42, 230–244, 1985. 4386
Lucke, R. L., Korwan, D. R., Bevilacqua, R. M., Hornstein, J. S., Shettle, E. P., Chen, D. T.,
5
Daehler, M., Lumpe, J. D., Fromm, M. D., Debrestian, D., Neff, B., Squire, M., K¨onig-Langlo, G., and Davies, J.: The Polar Ozone and Aerosol Measurement (POAM) III instrument and early validation results, J. Geophys. Res., 104, 18785–18799, 1999. 4388
Lumpe, J. L., Fromm, M., Hoppel, K., Bevilacqua, R. M., Randall, C. E., Browell, E. V., Grant, W. B., McGee, T., Burris, J., Twigg, L., Richard, E. C., Toon, G. C., Margitan, J. J., Sen, B.,
10
Pfeilsticker, K., Boesch, H., Fitzenberger, R., Goutail, F., and Pommereau, J.-P.: Comparison of POAM III ozone measurements with correlative aircraft and balloon data during SOLVE, J. Geophys. Res., 108, doi:10.1029/2001JD000472, 2003. 4388,4392
Manney, G. L., Michelsen, H. A., Bevilaqua, R. M., Gunson, M. R., Irion, F. W., Livesy, N. J., Oberheide, J., Riese, M., Russell III, J. M., Toon, G. C., and Zawodny, J. M.: Comparison of
15
satellite ozone observations in coincident air masses in early November 1994, J. Geophys. Res., 106, 9923–9943, 2001. 4386
McGee, T. J., Gross, M., Singh, U. N., Butler, J. J., and Kimvilankani, P.: An improved stato-spheric ozone lidar, Opt. Eng., 20, 955–958, 1995. 4387
Morris, G. A., Gleason, J. F., Ziemke, J., and Schoeberl, M. R.: Trajectory mapping: a tool for
20
validation of trace gas observations, J. Geophys. Res., 105, 17 875–17 894, 2000. 4386 Pfaendtner, J., Bloom, S., Lamich, D., Seablom, M., Sienkiewicz, M., Stobie, J., and da Silva, A.:
Documentation of the Goddard Earth Observing System (GEOS) Data Assimilation System – Version 1, NASA Technical Memorandum 104606, Vol. 4, 1995. 4388
Randall, C. E., Lumpe, J. D., Bevilacqua, R. M., Hoppel, L. W., Fromm, M. D., Salawitch, R. J.,
25
Swartz, W. H., Lloyd, S. A., Kyro, E., von der Gathen, P., Claude, H., Davies, J., DeBacker, H., Dier, H., Molyneux, M. J., and Sancho, J.: Reconstruction of three-dimensional ozone fields using POAM III during SOLVE, J. Geophys. Res., 107, doi:10.1029/2001JD000471, 2002. 4386
Redaelli, G., Lait, L. R., Schoeberl, M., Newman, P. A., Visconti, G., Daltorio, A., Masci, F., Rizi,
30
V., Froidevaux, L., Waters, J. W., and Miller, A. J.: UARS MLS O3 soundings compared with lidar measurements using the conservative coordinates reconstruction technique, Geophys. Res. Lett., 21, 1535–1538, 1994. 4386
ACPD
4, 4383–4406, 2004 Non-coincident inter-comparisons L. R. Lait et al. Title Page Abstract Introduction Conclusions References Tables Figures J I J I Back CloseFull Screen / Esc
Print Version Interactive Discussion
© EGU 2004
Rex, M., von der Gathen, P., Braathen, G. O., Harris, N. R. P., Reimer, E., Beck, A., Alfier, R., Kr ¨uger-Carstensen, R., Chipperfield, M., De Backer, H., Balis, D., O’Conner, F., Dier, H., Dorokhov, V., Fast, H., Gamma, A., Gil, M., Kyr ¨o, E., Litynska, Z., Mikkelsen, I. S., Molyneux, M., Murphy, G., Reid, S. J., Rummukainen, M., and Zerefos, C.: Chemical ozone loss in the Arctic winter 1994/1995 as determined by the Match technique, J. Atmos. Chem., 32, 35–59,
5
1999. 4386
Richter, D. A., Browell, E. V., Butler, C. F., and Higdon, N. S.: Advanced airborne UV DIAL system for stratospheric and tropospheric ozone and aerosol measurements, in Advances in Atmospheric Remote Sensing with Lidar, edited by Ansmann, A., Neuber, R., Rairoux, P., and Wandinger, U., Springer Verlag, New York, 395–398, 1997. 4387
10
Schoeberl, M. R. and Lait, L. R.: Conservative coordinate transformations for atmospheric measurements, in The Use of EOS for Studies in Atmospheric Physics, edited by Gille, J. C. and Visconti, G., Proc. Internat. School of Phys. “Enrico Fermi”, CXV Course, 419–430, 1991. 4386
Schoeberl, M. R., Lait, L. R., Newman, P. A., Martin, R. L., Proffitt, M. H., Hartmann, D. L.,
15
Lowenstein, M., Podolske, J., Strahan, S. E., Anderson, J., Chan, K. R., and Gary, B.: Re-construction of the constituent distribution and trends in the Antarctic polar vortex from ER-2 flight observations, J. Geophys. Res., 94, 16 815–16 845, 1989. 4386
Schoeberl, M. R., Newman, P. A., Lait, L. R., McGee, T. J., Burris, J. F., Browell, E. V., Grant, W. B., Richard, E. C., von der Gathen, P., Bevilacqua, R., Mikkelsen, I. S., and Molyneux,
20
M. J.: An Assessment of the Ozone Loss During the 1999–2000 SOLVE/THESEO 2000 Arctic Campaign, J. Geophys. Res., 107, doi:10.1029/2001JD000412, 2002. 4389
ACPD
4, 4383–4406, 2004 Non-coincident inter-comparisons L. R. Lait et al. Title Page Abstract Introduction Conclusions References Tables Figures J I J I Back CloseFull Screen / Esc
Print Version Interactive Discussion © EGU 2004 0 2 4 6 (ppmv) 10 15 20 25 30 35 Meas. AROTAL -1.0 -0.5 0.0 0.5 1.0 Ozone diff (ppmv) 10 15 20 25 30 35 Alt. (km)
Meas. AROTAL- Reconst. AROTAL
Fig. 1. (Left panel) Self-comparison biases for AROTAL data, expressed as the difference between the original measurements and the measurements reconstructed through PV-θ map-ping. Dots are the individual differences, the thin line is the mean difference profile, and the thick horizontal lines are the 90% confidence limits of the mean differences. (Right panel) The average measured ozone profile for AROTAL.
ACPD
4, 4383–4406, 2004 Non-coincident inter-comparisons L. R. Lait et al. Title Page Abstract Introduction Conclusions References Tables Figures J I J I Back CloseFull Screen / Esc
Print Version Interactive Discussion © EGU 2004
DC8 AROTAL- DC8 DIAL
-1.0
-0.5
0.0
0.5
1.0
Ozone diff ppmv
10
15
20
25
30
35
Alt. (km)
Fig. 2. Near-coincident differences between AROTAL and DIAL. Gray dots represent individ-ual differences, the solid line shows the mean difference profiles, horizontal lines show the estimated 90% confidence limits of the mean profile, and the dotted lines show the standard deviation of the differences.
ACPD
4, 4383–4406, 2004 Non-coincident inter-comparisons L. R. Lait et al. Title Page Abstract Introduction Conclusions References Tables Figures J I J I Back CloseFull Screen / Esc
Print Version Interactive Discussion © EGU 2004
-1.0
-0.5
0.0
0.5
1.0
Ozone diff (ppmv)
10
15
20
25
30
35
Alt. (km)
Meas. AROTAL- Reconst. DIAL
Reconst. AROTAL- Meas. DIAL
Fig. 3. Differences between AROTAL and DIAL, using PV-θ anlysis. As in Fig.1, the left panel shows the differences, and the right panel shows the average ozone profile. The mean differ-ences (with their 90% confidence limits) are shown for the comparisons both using AROTAL data reconstructed onto DIAL measurement locations (thin green line), and DIAL data mapped onto AROTAL locations (thick purple line).
ACPD
4, 4383–4406, 2004 Non-coincident inter-comparisons L. R. Lait et al. Title Page Abstract Introduction Conclusions References Tables Figures J I J I Back CloseFull Screen / Esc
Print Version Interactive Discussion © EGU 2004
-1.0
-0.5
0.0
0.5
1.0
Ozone diff (ppmv)
10
15
20
25
30
35
Alt. (km)
Meas. AROTAL (Odd)- Reconst. DIAL (Even)
Reconst. AROTAL (Odd)- Meas. DIAL (Even)
Fig. 4. As in Fig. 3, except that AROTAL data from the odd-numbered DC-8 flights are compared with DIAL data from the even-numbered flights.
ACPD
4, 4383–4406, 2004 Non-coincident inter-comparisons L. R. Lait et al. Title Page Abstract Introduction Conclusions References Tables Figures J I J I Back CloseFull Screen / Esc
Print Version Interactive Discussion © EGU 2004
-1.0
-0.5
0.0
0.5
1.0
Ozone diff (ppmv)
10
15
20
25
30
35
Alt. (km)
Meas. AROTAL (Even)- Reconst. DIAL (Odd)
Reconst. AROTAL (Even)- Meas. DIAL (Odd)
Fig. 5. As in Fig. 3, except that AROTAL data from the even-numbered DC-8 flights are compared with DIAL data from the odd-numbered flights.
ACPD
4, 4383–4406, 2004 Non-coincident inter-comparisons L. R. Lait et al. Title Page Abstract Introduction Conclusions References Tables Figures J I J I Back CloseFull Screen / Esc
Print Version Interactive Discussion © EGU 2004
-1.0
-0.5
0.0
0.5
1.0
Ozone diff (ppmv)
10
15
20
25
30
35
Alt. (km)
Meas. AROTAL- Reconst. Sondes
Reconst. AROTAL- Meas. Sondes
ACPD
4, 4383–4406, 2004 Non-coincident inter-comparisons L. R. Lait et al. Title Page Abstract Introduction Conclusions References Tables Figures J I J I Back CloseFull Screen / Esc
Print Version Interactive Discussion © EGU 2004
-1.0
-0.5
0.0
0.5
1.0
Ozone diff (ppmv)
10
15
20
25
30
35
Alt. (km)
Meas. DIAL- Reconst. Sondes
Reconst. DIAL- Meas. Sondes
ACPD
4, 4383–4406, 2004 Non-coincident inter-comparisons L. R. Lait et al. Title Page Abstract Introduction Conclusions References Tables Figures J I J I Back CloseFull Screen / Esc
Print Version Interactive Discussion © EGU 2004
-1.0
-0.5
0.0
0.5
1.0
Ozone diff (ppmv)
10
15
20
25
30
35
Alt. (km)
Meas. POAM3- Reconst. AROTAL
Reconst. POAM3- Meas. AROTAL
ACPD
4, 4383–4406, 2004 Non-coincident inter-comparisons L. R. Lait et al. Title Page Abstract Introduction Conclusions References Tables Figures J I J I Back CloseFull Screen / Esc
Print Version Interactive Discussion © EGU 2004
-1.0
-0.5
0.0
0.5
1.0
Ozone diff (ppmv)
10
15
20
25
30
35
Alt. (km)
Meas. POAM3- Reconst. DIAL
Reconst. POAM3- Meas. DIAL
ACPD
4, 4383–4406, 2004 Non-coincident inter-comparisons L. R. Lait et al. Title Page Abstract Introduction Conclusions References Tables Figures J I J I Back CloseFull Screen / Esc
Print Version Interactive Discussion © EGU 2004
-1.0
-0.5
0.0
0.5
1.0
Ozone diff (ppmv)
10
15
20
25
30
35
Alt. (km)
Meas. POAM3- Reconst. Sondes
Reconst. POAM3- Meas. Sondes