HAL Id: hal-00295572
https://hal.archives-ouvertes.fr/hal-00295572
Submitted on 20 Dec 2004
HAL is a multi-disciplinary open access
archive for the deposit and dissemination of
sci-entific research documents, whether they are
pub-lished or not. The documents may come from
teaching and research institutions in France or
abroad, or from public or private research centers.
L’archive ouverte pluridisciplinaire HAL, est
destinée au dépôt et à la diffusion de documents
scientifiques de niveau recherche, publiés ou non,
émanant des établissements d’enseignement et de
recherche français ou étrangers, des laboratoires
publics ou privés.
the boundary layer aerosol size distribution properties
at the Swedish background station Aspvreten
P. Tunved, J. Ström, H.-C. Hansson
To cite this version:
P. Tunved, J. Ström, H.-C. Hansson. An investigation of processes controlling the evolution of the
boundary layer aerosol size distribution properties at the Swedish background station Aspvreten.
Atmospheric Chemistry and Physics, European Geosciences Union, 2004, 4 (11/12), pp.2581-2592.
�hal-00295572�
SRef-ID: 1680-7324/acp/2004-4-2581 European Geosciences Union
Chemistry
and Physics
An investigation of processes controlling the evolution of the
boundary layer aerosol size distribution properties at the Swedish
background station Aspvreten
P. Tunved, J. Str¨om, and H.-C. Hansson
Institute for Applied Environmental Research, Stockholm University, SE-106 91, Stockholm, Sweden Received: 11 June 2004 – Published in Atmos. Chem. Phys. Discuss.: 20 August 2004
Revised: 9 December 2004 – Accepted: 12 December 2004 – Published: 20 December 2004
Abstract. Aerosol size distributions have been measured
at the Swedish background station Aspvreten (58.8◦N,
17.4◦E). Different states of the aerosol were determined us-ing a novel application of cluster analysis. The analysis re-sulted in eight different clusters capturing different stages of the aerosol lifecycle. The atmospheric aerosol size distri-butions were interpreted as belonging to fresh, intermediate and aged types of size distribution. With aid of back trajec-tory analysis we present statistics concerning the relation of source area and different meteorological parameters using a non-Lagrangian approach. Source area is argued to be impor-tant although not sufficient to describe the observed aerosol properties. Especially processing by clouds and precipitation is shown to be crucial for the evolution of the aerosol size distribution. As much as 60% of the observed size distri-butions present features that are likely to be related to cloud processes or wet deposition. The lifetime properties of differ-ent sized aerosols are discussed by means of measured vari-ability of the aerosol size distribution. Processing by clouds and precipitation is shown to be especially crucial in the size range 100 nm and larger. This indicates an approximate limit for activation in clouds to 100 nm in this type of environ-ment. The aerosol lifecycle is discussed. Size distributions indicating signs of recent new particle formation (∼30% of the observed size distributions) represent the first stage in the lifecycle. Aging of the aerosol size distribution may follow two branches: either growth by condensation and coagula-tion or processing by non-precipitating clouds. In both cases mass is accumulated. Wet removal is the main process ca-pable of removing aerosol mass. Wet deposition is argued to be an important mechanism in reaching a state where nucle-ation may occur (i.e. sufficiently low aerosol surface area) in environments similar to the one studied.
Correspondence to: P. Tunved
1 Introduction
The atmospheric aerosols are poorly characterized in global climate models (National Research Council Panel on Aerosol Radiative Forcing and Climate Change, 1996). The lack of a proper representation concerning chemical properties and size distributions of the aerosol in global and regional mod-els is the major reason why direct and the indirect climate effects (Twomey, 1974) of the atmospheric aerosols consti-tute the largest uncertainty in our present understanding of the anthropogenic climate forcing (IPCC, 2001). These cli-mate effects are crucially dependent on the aerosol proper-ties: size distribution, chemical composition and degree of internal and external mixing. The estimates of climate im-pact are further complicated by a high spatial and temporal variability of the aerosol properties (Pilinis et al., 1995; An-derson et al., 2003).
In order to improve representation of atmospheric aerosols in models we need to understand what processes that deter-mine the temporal evolution of aerosol. As shown by Tunved et al. (2003), the aerosol cannot be defined by a typical size distribution that is representative over large geograph-ical scales (in this case the Nordic countries). Neither can parameterizations in terms of air-mass related aerosol prop-erties help us to initialize numerical models.
The evolution of the aerosol in an air mass can be de-scribed as a function of sources, time spent over the sources as well as meteorological parameters controlling the evo-lution of the aerosol. Processes leading to an increase in the aerosol number concentration include nucleation and pri-mary emission of particulates, either anthropogenic emis-sions or natural emisemis-sions such as re-suspension of dust and breaking waves (Monahan, 1983). Processes reducing the number concentration of aerosol are coagulation and wet and dry deposition. Condensation leaves the total number unaf-fected, but instead contributes to growth of the particles re-sulting in an increase in total mass of the aerosol.
We exemplify this by considering a nucleation burst as many times reported from background stations in Finland (e.g. Kulmala et al., 2001a, 1998; V¨akev¨a et al., 2000). At the time when the burst is observed the size distribution often contains several tens of thousands of particles smaller than 10 nm. These particles are exposed to processes reducing the number concentration in the sub-10 nm size range. Of most importance are coagulation, deposition and condensa-tion. For small particles at high number concentrations, es-pecially below three nm, coagulation is a very fast process and as a consequence the time these small particles remain as individual particles in this size range is short. Nucle-ation events over the boreal forest are a transient phenom-ena due to the short lifetime of the freshly formed particles. Often, the presence of high particle number concentration (<10 nm) is limited to a couple of hours. With increasing size (10–100 nm) the rate of coagulation decreases. Also the rate of dry deposition of particles decreases with size in this so called Aitken size range. As the particles grow and en-ter the size range 0.1–1 µm the influence on aerosol number concentration from dry deposition become small (Slinn et al., 1978; Zhang et al., 2001) and changes in the aerosol number size distribution caused by condensation and coagulation are occurring slowly. Particles in this size range are found to be rather persistent in the atmosphere and often referred to as accumulation mode particles. The most dominant removal process for accumulation mode particles is wet deposition (Raes et al., 2000).
Lifetimes for Aitken and accumulation mode particles are in the order of days up to one week (depending on precip-itation rate and cloud frequency) for Aitken and accumu-lation mode particles respectively in the lower troposphere (Raes et al., 2000; Nilsson and Rannik, 2001; Williams et al., 2002). With the lifetime perspective in mind one can as-sume that some types of size distributions will be more fre-quently observed than others, e.g. size distributions with a high number concentration of nucleation mode particles are less frequently observed in the continental boundary layer over Scandinavia due to the short lifetime of these particles. Other types of size distributions will be observed more of-ten as they represent a terminal step in the evolution of the aerosol size distribution, and only slowly are affected by gen-eral dynamical processes such as coagulation and condensa-tion.
In this study we make use of a clustering technique in order to separate out typical distributions encountered at a continental background site, Aspvreten (58.8◦N, 17.4◦E).
These size distribution clusters are in turn associated with the meteorological history of the air, source area and receptor site meteorology. The discussion focus on the evolution of the aerosol size distribution in terms of dynamical behaviour, meteorology and time scales for different processes with the main purpose of determining the most important factors con-trolling the evolution of the size distribution.
2 Methods
2.1 Station and instrumentation
Aspvreten (58.8◦N, 17.4◦E) is located in the county of S¨ormland, some 80 km south of Stockholm and 2 km inland from the Baltic Sea. No local anthropogenic activities in-fluence the station (Tunved et al., 2003). The surroundings are dominated by deciduous and coniferous forest and grass-lands.
A differential mobility particle sizer (DMPS-system) con-sisting of a TSI 3010 CPC for counting the particles and a medium-size (11 cm) Hauke differential mobility analyser (DMA) separating the aerosol according to different mobil-ity. The setup observes the number size distribution of par-ticles with a dry size between 10–450 nm. A new size tribution is observed every 7.5 min. Along with the size dis-tribution several meteorological parameters (wind direction, wind speed, relative humidity, temperature and global radia-tion) are also continuously being measured at the station.
3 Data usage and analysis methods
3.1 Aerosol size distribution data
Data spanning over one year (1 June 2000 to 31 May 2001) of measurements at Aspvreten were used. Six hour median size distributions were calculated resulting in four distribu-tions per day, representing size distribution observadistribu-tions per-formed UTC 00:00–06:00, 06:00–12:00, 12:00–18:00, and 18:00–24:00. To be included in the subsequent analysis, each median value must consist of at least two hours of data. Af-ter data reduction 1064 median size distributions remained. A clustering method was applied to the data in order to char-acterize different types of size distributions based on similar-ities within each group. Clustering is an efficient technique for finding different subgroups in a large data set. The clus-tering routine used, KMEANS.m, is available in MATLAB© version 6.5 and in later versions. The KMEANS cluster-ing routine is most easily described as a partitioncluster-ing method where the data is separated in a predefined number of clus-ters. The observations (i.e. size distributions) are partitioned into a cluster whose members are as close to each other as possible, and as far from observations in other clusters as possible. The procedure used in this investigation iteratively minimizes the sum of squared Euclidean distances from each object to its cluster centroid.
In this study we limited the analysis to include 8 clusters. Different number of clusters were tested, but as we present in the following, eight clusters provide two clusters for each of the three stages of the aerosol life-cycle, i.e. fresh, inter-mediate and aged aerosols, as well as two clusters to capture situations that might be somewhere in between. Increasing
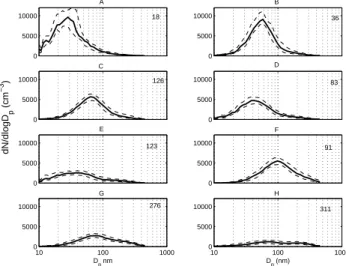
0 5000 10000 18 A 0 5000 10000 36 B 0 5000 10000 126 C dN/dlogD p (cm −3 ) 0 5000 10000 83 D 0 5000 10000 123 E 0 5000 10000 91 F 10 100 1000 0 5000 10000 276 G Dp nm 10 100 1000 0 5000 10000 311 H Dp (nm)
Fig. 1. Number size distribution clusters. Number of size
distribu-tions contributing to each cluster is given in the figure. Dashed lines indicate 25th–75th percentile ranges.
the number of clusters above eight did not provide more in-formation, i.e. same types of clusters were simply repeated.
3.2 Meteorology and trajectory analysis
Trajectory data were calculated from the re-analysed meteo-rological data library using the HYSPLIT4 model (Draxler and Hess, 1997). The meteorological data originate from NCEP’s (The National Weather Service’s National Centres for Environmental Prediction) GDAS (Global Data Assimila-tion System; Kanamitsu, 1989). 120 h back trajectories were calculated four times a day corresponding to the times of av-eraged size distribution data. Each trajectory consist of 120 endpoints, one each hour. The trajectories were calculated arriving 10 m above ground. Since the size distribution data is based on 6 h medians, each trajectory is associated with a size distribution. As an option from the HYSPLIT4 model, additional meteorological variables were calculated by HYS-PLIT from the NCEP analyses for each on of the hourly end-points. The trajectory model supplies several meteorological parameters. In this study we made use of relative humidity, absolute temperature, height of the mixing layer, as well as precipitation rate. In the analysis of meteorological data from trajectories, only the last 72 h were used. Although aerosol lifetimes may be much longer than 3 days, additional analy-sis extending three days did not add more information about the different states of the aerosol number size distribution.
Size distribution measurements, meteorological measure-ments at the receptor site as well as time dependent meteoro-logical cross-sections and source area of the air-parcel con-stitute a solid basis for determining important meteorological mechanisms related to different types of aerosols.
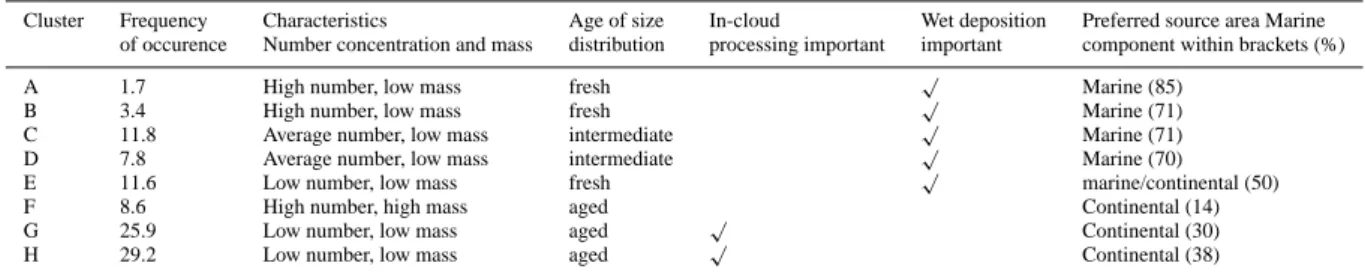
Table 1. Number, surface and mass associated with each cluster.
Cluster Median N Median S Equivalent mass Frequency
(cm−3) (cm2/cm3) (ρ=1.5) of occurence (µg/m3) (%) A 5254 0.0435 1.59 1.7 B 4278 0.0854 3.23 3.4 C 3082 0.0888 3.80 11.8 D 3004 0.0589 2.63 7.8 E 2124 0.0469 2.33 11.6 F 3372 0.2153 12.15 8.6 G 2073 0.1233 7.30 25.9 H 1106 0.0803 5.15 29.2 4 Results
4.1 Number size distribution clusters
The size distribution data were divided into eight distinctly separate clusters. These are displayed in Fig. 1a–h. The variability within each cluster is low, with exception of the Aitken mode of cluster A. We will return to this later. The homogeneity of the different individual clusters allows us to actually conclude that different “typical” aerosol size distri-butions are represented by each cluster. The term “typical” used here do not necessary refer to high frequency of occur-rence. The number of size distributions contributing to each cluster is given in the upper right of each frame (the total number of size distributions was 1064). There are some size distributions observed often, others only a minute fraction of the measurement period.
Cluster A represents aerosol size distributions with a dis-tinct Aitken mode around 30 nm with an integrated median number concentration of 5200 cm−3. Despite the rather high number concentration the integrated particle (10–450 nm) aerosol mass, assuming a density of 1.5 g cm−3, is only 1.6 µg*m−3 (cf. Table 1). Size distributions belonging to cluster A represent only 1.7% of the total number of size distributions.
Cluster B represents distributions where the integrated number concentration (4200 cm−3)is almost as high as for cluster A, but the main mode is shifted to 50–60 nm. The larger particles result in an integrated aerosol mass concen-tration of 3.2 µg*m−3. Cluster B makes up about 3.4% of the total number of size distributions. As for cluster A the number concentration in the accumulation mode size range is low.
Cluster C and D bear similarities with B and A, but show smaller amplitudes in the Aitken mode. A somewhat larger accumulation mode compared to cluster A and B yields an integrated aerosol mass concentration of ca 3 µg*m−3 for both cluster C and D. A total of 11.8 and 7.8% of the size distribution belong to cluster C and D, respectively.
Cluster E represents distributions that present a low in-tegral number concentration (2100 cm−3) as well as a low
0 0.2 0.4 A 0 0.2 0.4 B 0 0.2 0.4 C 0 0.2 0.4 D 0 0.2 0.4 E 0 0.2 0.4 F 0 0.2 0.4 G
jan feb mar apr may jun jul aug sep oct nov dec 0
0.2 0.4
H
Fraction Observations
Fig. 2. Seasonal distribution of the data contributing to each cluster.
integral surface area and low integral mass concentration (2.3 µg*m−3). Size distributions belonging to cluster E are present in 11.6% of all observations.
Cluster F represents size distributions completely domi-nated by the accumulation mode size range. The number concentration as median is high (∼3400 cm−3)and the mass is the highest of all the clusters (12.2 µg*m−3). Cluster F comprise 8.6% of the total of observations.
Cluster G represents distributions that share many features of cluster F, but the amplitude of the modes is smaller. The integral number concentration (∼2200 cm−3)is on the lower end of the clusters but the mass concentration (∼7 µg*m−3)
is comparably high. This type of size distributions occurred 25.9% of the time.
Cluster H represents the most frequently observed cluster type, which occurred roughly 30% of the time. The ampli-tude of the Aitken mode and Accumulation mode are similar, but well separated. The number concentration is the lowest of all clusters (1100 cm−3). The associated aerosol mass is 5.2 µg*m−3.
The seasonal contribution to each cluster was investigated. Different seasons exhibit differences in cloud cover, precipi-tation, temperature and global radiation as well as other me-teorological parameters. Increased global radiation during the summer months naturally increases the rate of photo-chemical reactions. Likewise, more frequent precipitation during fall and winter is likely to increase the rate of wet deposition. This implies different source and sink strengths over the year and this is likely to be reflected by the aerosol properties. In Fig. 2 the seasonal component of each clus-ter is shown. Size distributions belonging to Clusclus-ter A, B, C and F are mostly observed during late spring and late sum-mer months. Otherwise there is no obvious relation to the seasonal distribution of the data contributing to the differ-ent clusters. Cluster G and H have their contribution rather evenly spread over the year.
Fig. 3. Advection situations associated with clusters B, F and H.
4.2 Source areas
The source area is very important in characterizing the aerosol properties. Air of continental origin for instance is often associated with higher number concentration of large particles. This relation between source areas and aerosol properties has been demonstrated in several publications during recent years, e.g. Tunved et al. (2003) covering a network of five stations in Finland and Sweden; Birmili et al. (2001) at a continental site near Melpitz, Germany; Kulmala et al. (2000) with measurements from V¨arri¨o and Hyyti¨al¨a in Northern and central Finland, respectively and Nyeki et al. (1998) contributing with similar observations from Jungfraujoch, Swiss Alps.
For the analysis of the source areas associated with the different clusters in this investigation, the history of the air is tracked by using the calculated trajectories described in Sect. 2.2.2. Focus is put on the relative contribution between continental and maritime sources. Trajectories are separated as either describing transport in the clean marine environ-ment defining a sector from Scotland to North coast of Russia or as describing transport from the European sub-continent. If the trajectories reside more than 80% of the time in this marine sector it is considered as “clean marine”. This seg-regation between marine and continental trajectories is pre-sented in Table 2.
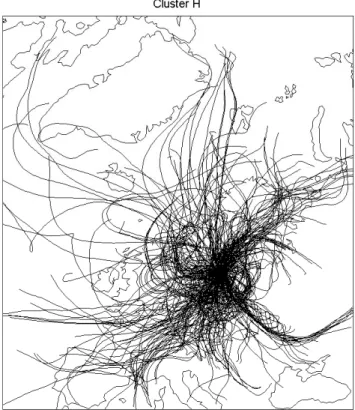
A majority of the trajectories for cluster A (85%), and clusters B, D and E (70%) belong to the type “clean ma-rine“. In Fig. 3 this typical North-West transport pattern is represented by trajectories belonging to cluster B. Clus-ter F describes a size distribution associated with trajectories classified as moving over predominantly continental sources
Table 2. Fraction of trajectories originating from the “clean marine” sector and average number of in-cloud occasions according to definition RH >94%.
Cluster A B C D E F G H
Fraction “clean marine” 0.85 0.71 0.71 0.7 0.50 0.14 0.30 0.38 In-cloud occasions during last 72 h 2.7 1.3 2.5 2.5 2.2 1.5 5 10
Fig. 4. Advection situations associated with clusters B, F and H.
(85%). Cluster G and H represent some intermediate situa-tion, where 30% and 38% of the trajectories can be referred to as clean marine, respectively. This transport pattern is ex-emplified in Fig. 5 by trajectories belonging to cluster H. It is clear that some clusters are dominated by marine contribu-tions (e.g. A) and some clusters are dominated by continental sources (e.g. F). There are no clusters that are exclusively a marine cluster or entirely a continental cluster.
4.3 Meteorology 4.3.1 Precipitation
The accumulation mode particle lifetime is essentially con-trolled by the frequency and magnitude of precipitation (e.g. Seinfeld and Pandis, 1998; Raes et al., 2000). Precipita-tion is thus an important parameter to be studied in order to evaluate controlling processes shaping the size distribution. Ideally we would like to have observations of precipitation events along the trajectory experienced by the air in which the aerosol size distributions are observed. This information is unfortunately not available to us. We instead rely on
pre-Fig. 5. Advection situations associated with clusters B, F and H.
cipitation rates derived from the HYSPLIT4 model. Because the analysis of the precipitation is not based on observations we limit the interpretation of precipitation rate to be of qual-itative nature. We thus focus on the pattern of precipitation indicated by the model rather than on absolute values.
In Fig. 6 median precipitation rate is shown for each of the clusters. Cluster A shows a history of very frequent precipita-tion events. During a time period ranging from ∼15 h to 45 h before arrival each trajectory is on average associated with precipitation in 50% of the cases. However, during the last 15 h before arriving Aspvreten there is a clear drop in the pre-cipitation frequency. Cluster B also shows a history of rather frequent precipitation. The distribution of the precipitation frequency along the trajectories is similar to trajectories as-sociated with cluster A in that the precipitation frequency is smaller close to the receptor site. We note that the period of “less precipitation” appears earlier in cluster B as compared to cluster A. The precipitation associated with cluster C is
0 0.25 0.5 A 0 0.25 0.5 B 0 0.25 0.5 C 0 0.25 0.5 D 0 0.25 0.5 E 0 0.25 0.5 F 0 0.25 0.5 G 0 10 20 30 40 50 60 70 0 0.25 0.5 h before arrival H
Average frequency of precipitation
along trajectories
Fig. 6. Median precipitation fraction associated with each cluster,
per endpoint, during the last 72 h. Blue bars denote the total precip-itation fraction, green bars fraction of time with precipprecip-itation rate
>0.3mm/h. Corresponding from cluster A to H, from above.
rather uniform, although slightly higher in the beginning of the trajectories. Cluster D again show a precipitation pattern similar to A and B. That is, the frequency of precipitation is greatest back in time and decreases as the air comes closer to the receptor site. This also applies to cluster E. Cluster F show the overall lowest frequency of precipitation (15–20%). A slight increase in the frequency of precipitation is noticed just before the arrival of the trajectory to the receptor site. Finally, cluster G and H exhibit a pattern of high and uni-form frequency of precipitation throughout the history of the trajectories.
Now, recalling the shape of the different clusters we are able to notice that clusters with a high number concentra-tion in the Aitken and nuclei size ranges (clusters A, B, C, D and E) are associated with a precipitation pattern where pre-cipitation maximum occurs more than half a day before the arrival of the trajectories. The only cluster with a majority of particles in the accumulation mode size range also show the smallest frequency of precipitation. And, lastly, clusters G, and especially H, with a well separated Aitken and accu-mulation mode and low number concentration are associated with a uniform and rather high frequency of precipitation. It is thus clear that certain differences in precipitation history exist between different size distribution clusters. The role of precipitation in controlling the appearance of the clusters will be addressed under Sect. 4. Now, however, we turn the attention towards the role of clouds.
4.3.2 Clouds
Non-precipitating clouds affect aerosol mass concentration and particle water solubility. The aqueous phase oxidation of SO2, mainly by ozone and hydrogen peroxide, in cloud droplets may serve as an effective path of moving smaller
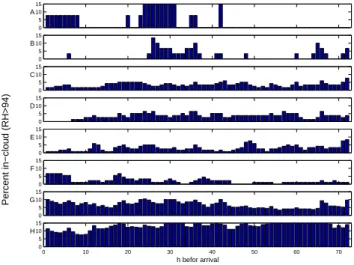
0 5 10 15 A 0 5 10 15 B 0 5 10 15 C 0 5 10 15 D 0 5 10 15 E 0 5 10 15 F 0 5 10 15 G 0 10 20 30 40 50 60 70 0 5 10 15 h befor arrival H Percent in−cloud (RH>94)
Fig. 7. Frequency of in-cloud occasions as derived from the RH
profiles from the HYSPLIT4 model. Corresponding from cluster A to H, from above.
particles into the accumulation mode (Hoppel et al., 1994; Bower et al., 1999). The average radius increase associ-ated with cloud droplet activation also increases the coag-ulation rate of interstitial aerosol as they are rather quickly scavenged by the activated cloud droplets (e.g. Seinfeld and Pandis, 1998). This means that non-precipitating clouds will affect the aerosol size distribution by growing larger Aitken particles or accumulation mode particles by in-cloud chem-istry described above and by reducing the number concentra-tion of the interstitial aerosol.
In order to address the issue of cloud processing we made use of the relative humidity supplied as a model output from the HYSPLIT4 model, which was used as a proxy for clouds. Occasions with RH above 94% are considered to correspond to presence of clouds in the air parcel. Based on this assump-tion, Fig. 7 presents the percentage of in-cloud occasions (or more specifically frequency of occasions with RH >94%) over the last 72 h. Beginning with cluster A, the frequency of in-cloud occasions are rather unevenly distributed over the travel time of the trajectory. Two interesting features are as-sociated with this cluster. First, there is a peak in the fre-quency of in-cloud occasions around 30 h (15% in-cloud oc-casions) before arrival of the trajectory and secondly a peak just before the arrival of the trajectory. Cluster B shows an overall low frequency of in-cloud occasions. This is also true for cluster C, D, E and F. Typically, the cloud fraction asso-ciated with these clusters is below 5%. Cluster G and H do however exhibit a cloud frequency pattern obviously differ-ent from the other clusters. Trajectories belonging to cluster G are associated with in-cloud occasions between 5 and 10% of the time. Cluster H show an in-cloud frequency larger than 10% throughout the 72 h.
We clearly are able to differ between two different ag-ing processes; one includag-ing clouds and precipitation and
one with little clouds involved in the transformation of the aerosol. This is supported both by the size distribution data (i.e. aerosol number size distribution) and trajectory model output. It is thus safe to establish a qualitative relation be-tween cluster shape and history of the air-parcel in terms of relative humidity and precipitation. Clusters G and H are associated with air that likely have been exposed to a large number of cloud cycles and are relatively similar in shape, having low number concentration and rather large accumula-tion mode as well as separaaccumula-tion between the Aitken and the accumulation mode. Cluster F is associated with the lowest frequency of precipitation and the lowest number of possi-ble cloud cycles. This size distribution is dominated by the accumulation mode.
4.3.3 Other meteorological parameters
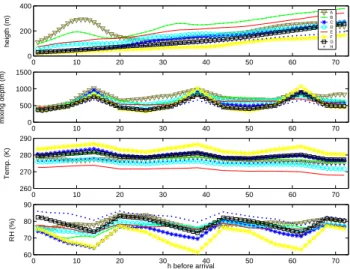
In complement to this first analysis of the precipitation and cloudiness we also investigate the time series of average tem-perature, relative humidity, mixing height and the vertical component of the trajectories for each cluster. The HYSPLIT output results for these parameters are displayed in Fig. 8. Meteorological output is evaluated back in time starting from 00:00 UTC regardless of arrival time for individual trajecto-ries. That is, if a trajectory is calculated to arrive 05:00 UTC, 5 h are subtracted from the data. Likewise, for trajectories arriving 11:00 UTC, 11 h are subtracted. This means that meteorological output will be in phase for all trajectories. In this way we capture diurnal variations in meteorological pa-rameters.
All median trajectories suggest subsidence during trans-port. Clusters A and B are slightly different than the others in that they present a “hump” shortly before arriving the sta-tion. Based on the mixing height, presented in the second panel of Fig. 8, the trajectories typically stayed within the boundary layer during the entire 72 h transport.
The mixing depths from the model follow a diurnal pat-tern for all the clusters. There are however some differences present concerning average depth of the mixing layer and the magnitude of the diurnal variation. The diurnal variability of the mixing layer height is low for cluster A. It is also clear that the mixing layer is on average deeper for cluster A as compared with the other clusters. Cluster B shows similar mixing depth features, i.e. rather a deep mixing layer with rather low diurnal variability. Clusters C, D, E, F and G are associated with a typical diurnal variation in the mixing depth. The mixing layer is shallow during night-time and grows during the day after the onset of vertical mixing. It is obvious that the largest variation is associated with cluster F. Cluster H in turn is associated with the shallowest mixing layer and the smallest diurnal variability.
The temperature variation associated with each trajectory is displayed in the third frame. There is a wide range of tem-peratures associated with each cluster. Cluster F is associated with trajectories with the highest average temperatures given
0 10 20 30 40 50 60 70 0 200 400 heigth (m) 0 10 20 30 40 50 60 70 260 270 280 290 Temp. (K) 0 10 20 30 40 50 60 70 60 70 80 90 h before arrival RH (%) 0 10 20 30 40 50 60 70 0 500 1000 1500 mixing depth (m) A B C D E F G H
Fig. 8. Diurnal variation of averaged time profiles of height (1),
mixing layer height (2), temperature (3) and relative humidity (4) for each cluster.
by the fact that the cluster is composed of mainly summer data. The other extreme are the trajectories associated with cluster E. This cluster has its contribution from air arriving during mainly the winter period. Recalling Fig. 1, cluster E had large relative contributions from nuclei and Aitken mode particles. This is quite interesting since there are only a few “real” nucleation events recorded at Aspvreten during win-ter time (Tunved et al., 2003). The number concentration associated with this cluster never becomes very large. The absolute contribution of the small particles remains low. It is however clear, considering the relatively large contribution to this type of size distribution (11.6% of total) that some typical mechanism is responsible for this type of size distri-bution. Nucleation is a temperature dependent phenomenon, with increasing nucleation rates at low temperatures (Easter and Peters, 1994; Nilsson and Kulmala, 1998). Thus, low temperatures during the winter period may favour nucleation, although the nucleation rate will not reach the same magni-tude as observed during e.g. spring due to some other limita-tions.
Relative humidity in the boundary layer is often a very strong function of the temperature. This is also seen the fourth panel of Fig. 8. Cluster F shows the largest diurnal temperature variation with low values during day time and high values during night time, whereas cluster G shows the least variability. Large diurnal variation in ambient tempera-ture and relative humidity are generally associated with clear sky conditions. Overcast situations shade the surface from incoming solar radiation and re-emit thermal radiation back to Earth, which suppress the daily variations in temperature. Thus there is a link between low cloudiness and large tem-perature variations as for cluster F, and high cloudiness and small temperature variations as for cluster H.
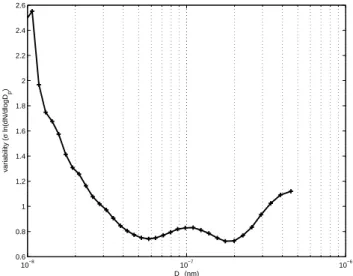
10−8 10−7 10−6 0.6 0.8 1 1.2 1.4 1.6 1.8 2 2.2 2.4 2.6 Dp (nm) variability ( σ ln(dN/dlogD p )
Fig. 9. Variability expressed as σ ln(dN/dlogDp)for the whole data
set.
5 Discussion
From the analysis of the clusters and associated meteorol-ogy it was shown different types of size distributions are ob-served with different frequency. It was also shown that each one of the clusters had different history in terms of seasonal preference, source areas and meteorological history. Influ-ence from source area and seasonal dependInflu-ence on observed aerosol properties has been demonstrated in earlier investi-gations (e.g. Tunved et al., 2003). This study derives to what degree different parameters in terms of source area and mete-orology influence the aerosol number size distribution mea-sured at Aspvreten. It is clear that neither one of these pa-rameters investigated alone are sufficient to explain the size distribution properties observed at Aspvreten.
It is clear that different processes act on the aerosol size distribution on different timescales. These time scales in turn are dependent on meteorology, availability of condensable gases, temperature, humidity, cloudiness etc. One approach to qualitatively approximate lifetimes is to utilize the mea-surement variability (Junge, 1974). This assumption is based on the idea that the variability is proportional to the life-time; a high variability corresponds to a short lifetime and vice versa. The variability may be determined by the stan-dard deviation of the natural logarithm of the measurement values (i.e. σ ln(X)) as utilized by Jobson et al. (1998) and Williams et al. (2002). This variability criterion was applied to the whole size distribution dataset including tens of thou-sands of size distributions. The result is given in Fig. 9 as
σ(ln (dN/dlogDp)against Dp. This plot illustrates the size
dependent variability per bin in the size distribution, a total of 36 size increments ranging from 10 to 450 nm.
It is shown that the variability monotonically increases with reducing size (and hence the lifetime decreases) for
par-ticles less than 50 nm. This behaviour is to be expected since smaller particles are quickly removed by coagulation and condensation grow them into larger sizes. The rate of coagu-lation is largest for the smallest particles, and decreases with increasing size. However, from 70 nm the variability tends to increase again, reaching a local maximum around 100 nm. This behaviour can only be consistent with the processing by non-precipitating clouds; neither coagulation nor dry depo-sition or condensation growth is sufficiently rapid to explain an increase of variability in this size range. Clouds are ca-pable of moving ∼100 nm aerosols serving as CCN into the accumulation mode due to rapid oxidation of SO2, mostly by ozone and hydrogen peroxide within activated cloud droplets (Mason, 1971; Hoppel et al., 1994). Since the relative growth of the activated CCN by this process is largest for the smaller particles, this effect is likely to be most obvious for the small-est CCN particles contributing to the active cloud droplets. The effects of the clouds on the aerosol size distribution be-come smaller with increasing size in the accumulation mode. A variability increase in the 100nm size range is therefore consistent with processing by clouds.
The variability decreases from 100 nm to approximately 200 nm. As previously discussed, coagulation, condensation and dry deposition are very slow processes in the size range 0.1–1 µm. After this minimum, variability increase again. Precipitation or primary aerosol sources might give rise to the increase in the variability seen for particles larger than 200 nm. Assuming an internally mixed aerosol, larger parti-cles are most likely to form cloud droplets and they also form larger cloud droplets. Larger cloud droplets are in turn more susceptible to rainout due to growth by coalescence (e.g. Se-infeld and Pandis 1998; Rogers and Yau, 1989). We cannot however rule out the possibility that the observed increase in variability in fact is a result of increased deposition velocity in the upper size range of the accumulation mode.
From the simplified three stage aerosol life-cycle envi-sioned when defining the number of clusters in Sect. 2.2.1, we may assume that each cluster a represents a different stage in the aging process. The size distribution in each stage is the result of processing by different mechanisms over dif-ferent time scales. The difdif-ferent clusters are not truly La-grangian in that one follows the other in time, but the type of processes that act on the different distributions might help us understand how the clusters are related to each other in a Lagrangian perspective. We illustrate that in Fig. 10. Clus-ter A represents the youngest and the freshest aerosol, which will rapidly transform into cluster B. Based on the meteorol-ogy (cloud frequency and precipitation), cluster B lag cluster A with approximately half a day. Precipitation followed by clearing skies shortly prior reaching Aspvreten sets the stage for new particle formation.
Through coagulation and condensation the aerosol rather quickly move into cluster types C and D, but once there the processes are much slower and the cluster types are thus more frequently observed. From this point the evolution
0 5000 10000 A 0 5000 10000 B 0 5000 10000 C 0 5000 10000 D 0 5000 10000 E 0 5000 10000 F 0 5000 10000 G 0 5000 10000 H
Wet scavenging
Coagulation + condensation
Nucleation
Particle number density
Aerosol surface area
Coagulation + condensation
+clouds
Cloud processing
Fig. 10. Suggested lifecycle of the boundary layer aerosol.
may proceed in two directions: through continuous growth by condensation and coagulation into a size distribution rep-resented by cluster F or by processing by clouds and wet de-position into a size distribution represented by H. Of course, in due time F is likely to be cloud processed and deposited in a way as described by the transformation of C to H. Thus, significant changes of the aerosol number size distribution represented by F requires in-cloud processing and/or wet de-position considering the time scale for coagulation and con-densation for similar size distributions. Through these mech-anisms size distribution H is formed. This stage represents the terminal step of the cycle. In order to close the cycle it is necessary to add a new source of small particles, i.e. start a new nucleation.
On the issue of the initiation of the nucleation one may consult one of many studies on the issue, especially from measurements performed at Hyyti¨al¨a, a boreal forest site in Finland (e.g. Kulmala et al., 2001a; M¨akel¨a et al., 2000a, b; Nilsson et al., 2001a, b). Nucleation preferentially oc-curs daytime, during clear sky conditions. That is, nucleation events as observed at continental background stations are to be regarded as a daylight phenomenon. This is also
illus-trated by the dependence on high rate of incoming solar radi-ation, indicating the importance of photochemistry. Growth can often be followed during several hours in these studies. The nucleation occurs in air arriving from north, bringing clean air to the receptor site. It is further accepted that the sink of newly formed particles, i.e. the pre-existing aerosol, is a strong determinant for the extent of the nucleation ob-served (Kerminen et al., 2001; Kulmala et al., 2001b; Laak-sonen et al., 2001). A large concentration of pre-existing aerosol may also serve as an efficient sink of the nucleating gases, thereby diminishing the amount of particles formed. This sink is closely related to the surface area of the pre-existing aerosol.
It is however not obvious how this nucleating stage of schematic aerosol lifecycle is reached. Schr¨oder et al. (2002) argue the importance of clouds and precipitation in order to achieve a threshold in pre-existing aerosol required in order to make nucleation possible, i.e. reaching low enough pre-existing aerosol surface area. Wet deposition, as controlling mechanism for reaching a state where nucleation can occur, is also suggested by Capaldo et al. (1999) in studies of the marine boundary layer aerosol.
Table 3. Summary of size distribution properties and important factors associated with them.
Cluster Frequency Characteristics Age of size In-cloud Wet deposition Preferred source area Marine
of occurence Number concentration and mass distribution processing important important component within brackets (%)
A 1.7 High number, low mass fresh √ Marine (85)
B 3.4 High number, low mass fresh √ Marine (71)
C 11.8 Average number, low mass intermediate √ Marine (71)
D 7.8 Average number, low mass intermediate √ Marine (70)
E 11.6 Low number, low mass fresh √ marine/continental (50)
F 8.6 High number, high mass aged Continental (14)
G 25.9 Low number, low mass aged √ Continental (30)
H 29.2 Low number, low mass aged √ Continental (38)
One interesting feature in our data set is that the accumu-lation mode size range number concentration is lower in all clusters showing a high concentration in the nuclei and lower Aitken size range as compared with cluster G and H. This is consistent with the idea of a threshold in pre-existing aerosol concentration. Nucleation requires a low surface area to hap-pen, i.e. low condensation sink.
It is also implicated from the meteorological analysis that this threshold is reached by wet-deposition of the pre-existing aerosol. If one compares the cluster A and B with the frequency of precipitation it is clear that these two clus-ters exhibit a history of rather high frequencies of precipita-tion. It is also clear that the meteorological model does not indicate that precipitation occurs during the time where we believe nucleation to start. This fact supplies us with a pos-sible relation where the wet-deposition provides a removal mechanism sufficiently efficient to reduce the aerosol num-ber concentration (and surface) to a level in which nucleation is possible to occur.
It is however not possible to rule out the role of entrain-ment of air from the free troposphere, contributing to mix-ing situations concernmix-ing humidity and temperature favour-ing nucleation rate and extent (e.g. Nilsson et al., 2001a; Ca-paldo et al., 1999). Entrainment of air with low concentration from the free troposphere could also reduce the pre-existing aerosol surface in the boundary layer leading to conditions favouring nucleation.
This connection in time between different types, or clus-ters, of aerosol size distributions is only tentative. The study lacks a Lagrangian component and this assumption can only be based on knowledge of different processes contributing to the evolution of the aerosol size distribution.
6 Summary and conclusions
Different states of the background boundary layer aerosol size distribution have been determined using a novel appli-cation of cluster analysis. The clustering was shown to be successful in terms of identifying different types of aerosols. The main characteristics of the different clusters are pre-sented in Table 3. From the data set it is obvious that mainly
three important phases of the size distribution are present: fresh, intermediate and aged. Cluster A and B is referred to as fresh aerosol, cluster C, D and E is regarded as intermedi-ate and cluster F, G and H are considered as aged aerosol size distributions. We further present statistics indicating a direct relation between source areas and different meteorological parameters and evolution of the size distribution using a non-Lagrangian approach. The results presented are consistent with the general view concerning influence on the aerosol size distribution from different dynamical processes such as coagulation, condensation and cloud processes and precipi-tation and influence from different type of source areas. It is clear that although source area is important for defining the aerosol measured at Aspvreten, it is far from sufficient. This becomes clear since different source areas may result in very similar size distributions observed at Aspvreten. In these cases meteorology (especially precipitation and cloud processing) define the aerosol properties.
We discussed the lifetime properties of different sized aerosol by means of measurement variability (Junge, 1974). We conclude that different size ranges are affected by dif-ferent processes acting on difdif-ferent timescales. This idea is already established in earlier investigations (e.g. Raes et al., 2000; Williams et al., 2002) and confirmed through this study. In terms of a life-cycle the nucleation cluster A serves as the initial input aerosol. This aerosol is aged due to con-densation and coagulation reaching some intermediate size distribution as exemplified by cluster C and B. Further aging may follow two different branches: uninterrupted coagula-tion, condensation and deposition resulting in a size distribu-tion comparable to cluster F in Fig. 1, either aging by clouds and wet deposition resulting in a size distribution comparable to G or H. It is further argued that wet deposition depletion of the aerosol is a necessity in order to reach a nucleating stage. The most important results from the investigation are sum-marized as below:
– The clustering picked out three different stages of the
aerosol life cycle: fresh stage, intermediate stage and aged stage. For each of the intermediate and aged type stages different clusters presented different degree of cloud processes.
– Different clusters present characteristic differences in
timing and frequency of precipitation during the 72 h preceding the size distribution observations
– The processing by non-precipitating clouds are likely
affect the number size distribution. This is most obvious in the 100 nm size range as indicated by the variability analysis. This further indicates that the lower limit of activation of aerosols in clouds is approximately 100 nm in this type of environment. This is also supported that by the location of the Hoppel minimum in the clusters showing a history of many cloud cycles
– As much as 60% of the size distribution measurements
show obvious signs of in-cloud processes and wet-deposition, both regarding overall appearance of the size distribution as well as meteorological history. This point to the importance in developing parameterisations that simulate the effect of this process when modelling areas such as the Nordic countries.
– Meteorological history seems even more important than
the effect of source area during situations where the air parcels are associated with high frequency of precipita-tion and in-cloud situaprecipita-tions
– More frequent nucleation events than observed at
sin-gle stations are required to sustain the aerosol number concentration observed. Roughly 30% of the size distri-butions share size distribution properties that are likely to be directly connectable to previous nucleation events back in time.
– Data indicate that wet deposition might be an important
factor in reaching a state with sufficiently low conden-sation and coagulation sink to allow for nucleation.
– Size distribution clusters with indications of recent
par-ticle formation were associated with a low mass and sur-face concentration.
Acknowledgements. This work was funded by the ASTA
pro-gramme (International and National Abatement Strategies for Transboundary Air Pollution) of the MISTRA research foundation (Swedish Foundation for Strategic Environmental Research), Nordic Council of Ministers (NMR) and the Swedish Environmen-tal Protection Agency, EnvironmenEnvironmen-tal Monitoring Programme. The helpful comments of two anonymous referees are acknowledged. Edited by: U. Lohmann
References
Anderson, T. L., Charlson, R. J., Winker, D. M., Ogren, J. A., and Holmen, K.: Mesoscale variations of tropospheric aerosols, J. Atmos. Sci., 60, 119–136, 2003.
Bower, K. N., Jones, A., and Choularton, T. W.: A modelling study of aerosol processing by stratocumulus clouds and its impact on general circulation model parameterisations of cloud and aerosol, Atmos. Res., 50, 317–344, 1999.
Birmili, W., Wiedensohler, A., Heintzenberg, J., and Lehmann, K.: Atmospheric particle number size distribution in central Europe: Statistical relations to air masses and meteorology, J. Geophys. Res., 106, 32 005–32 018, 2001.
Capaldo, K. P., Kasibhatla, P., and Pandis, S. N.: Is aerosol produc-tion within the remote marine boundary layer sufficient to main-tain observed concentration?, J. Geophys. Res., 104, 3483–3500, 1999.
Draxler, R. R. and Hess, G. D.: Description of the Hysplit 4 mod-elling system, NOAA Tech Memo, ERL, ARL-224, 1997. Easter, R. C. and Peters, L. K.: Binary homogeneous nucleation:
Temperature and relative humidity fluctuations, nonlinearity, and aspects of new particle production in the atmosphere, J. Appl. Meteorol., 33, 775–784, 1994.
Hoppel, W. A., Frick, G. M., Fitzgerald, J., and Larson, R. E.: Ma-rine boundary-layer measurements of new particle formation and the effects non-precipitating clouds have on aerosol size distribu-tion, J. Geophys. Res., 99, 14 443–14 459, 1994.
IPCC, 2001: IPCC, In: Climate Change 2000 – The Science of Climate Change, edited by: Houghton, J. H., Ding, Y., Griggs, D. J., et al., Cambridge University Press, Cambridge, 2001. Jobson, B. T., Parrish, D. D., Goldan, P., Kuster, W., Fehsenfeld,
F. C., Blake, D. R., Blake, N. J., and Niki, H.: spatial and tem-poral variability of nonmethane hydrocarbon mixing ratios and their relation to photochemical lifetime, J. Geophys. Res. A, 103, 13 557–13 567, 1998.
Junge, C. E.: Residence time and variability of tropospheric trace gases, Tellus, 16, 477–488, 1974.
Kanamitsu, M.: Description of the NMC global data assimilation and forecast system, Wea. Forecast., 4, 335–342, 1989. Kerminen, V. M., Pirjola, L., and Kulmala, M.: How significantly
does coagulational scavenging limit atmospheric particle produc-tion?, J. Geophys. Res., 106, 24 119–24 125, 2001.
Kulmala, M., Toivonen, A., M¨akele¨a, J. M., and Laaksonen, A.: Analysis of the growth of nucleation mode particles observed in Boreal forest, Tellus B, 50, 449–462, 1998.
Kulmala, M., Rannik, ¨U., Pirjola, L., Dal Maso, M., Karim¨aki, J., Asmi, A., J¨appinen, A., Karhu, V., Korhonen, H., Malvikko, S.-P., Puustinen, A., Raittila, J., Romakkaniemi, S., Suni, T., Yli-Kovisto, S., Pateero, J., Hari, P., and Vesala, T.: Characterization of atmospheric trace gases and aerosol composition at forest sites in southern and northern Finland using back trajectories, Bor. Env. Res., 5, 315–336, 2000.
Kulmala, M., H¨ameri, K., Aalto, P. P, M¨akel¨a, J. M., Pirjola, L., Nilsson, E. D., Buzorius, G., Rannik, U., Dal Maso, M., Seidl, W., Hoffman, T., Janson, R., Hansson, H. C., Viisanen, Y., Laak-sonen, A., and O’Dowd, C. D.: Overview of the international project on biogenic aerosol formation in the boreal forest (BIO-FOR), Tellus B, 53, 324–343, 2001a.
Kulmala, M., Dal Maso, M., M¨akel¨a, J. M., Pirjola, L., V¨akev¨a, M., Aalto, P., Miikkulainen, P., Hameri, K., and O’Dowd, C. D.: On the formation, growth and composition of nucleation mode particles, Tellus, 53, 479–490, 2001b.
Mason, B. J.: The physics of clouds, Clarendon Press, Oxford, 1971.
Monahan, E. C., Fairall, C. W., Davidson, K. L., and Boyle, P. J.: Observed inter-relations between 10 m winds, ocean whitecaps and marine aerosols, Q. J. Roy. Met. Soc., 109, 379–392, 1983. M¨akel¨a, J. M., Koponen, I. K., Aalto, P., and Kulmala, M.:
One-year data of submicron size modes of tropospheric background aerosol in Southern Finland, J. Aerosol Sci., 31, 595–611, 2000a. M¨akel¨a, J. M., Dal Maso, M., Pirjola, L., Keronen, P., Laakso, L., Kulmala, M., and Laaksonen, A.: Characteristics of the aerosol particle formation events observed at a boreal forest site in south-ern Finland, Boreal Env. Res., 4, 299–313, 2000b.
National Research Council: Panel on Aerosol Radiative Forcing and Climate Change, A Plan for a Research Program on Aerosol Ra-diative Forcing and Climate Change, Washington, D.C., National Academy Press, 1996.
Nilsson, E. D. and Kulmala, M.: The potential for atmospheric mix-ing processes to enhance the binary nucleation rate, J. Geophys. Res., 103 (D1), 1381–1389, 1998.
Nilsson, E. D. and Rannik, ¨U.: Turbulent aerosol fluxes over the Arctic Ocean 1. Dry deposition over sea and pack ice, J. Geo-phys. Res., 106, 32 125–32 137, 2001.
Nilsson, E. D., Pirjola, L., and Kulmala, M.: The effect of atmo-spheric waves on aerosol nucleation and size distribution, J. Geo-phys. Res., 105, 19 917–19 926, 2000.
Nilsson, E. D., Rannik, ¨U., Kulmala, M., Buzorius, G., and O’Dowd, C. D.: Effects of continental boundary layer evolution, convection, turbulence and entrainment, on aerosol formation, Tellus B, 53, 441–461, 2001a.
Nilsson, E. D., Paatero, J., and Boy, M.: Effects of air masses and synoptic weather on aerosol formation in the continental bound-ary layer, Tellus B, 53, 462–478, 2001b.
Nyeki, S., Baltensperger, U., Colbeck, I., Jost, D. T., Weingart-ner, E., and Gaggeler, H. W.: The Jungfraujoch high-Alpine re-search station (3454 m) as a background clean continental site for the measurement of aerosol parameters, J. Geophys. Res., 103, 6097–6107, 1998.
Pilinis, C., Pandis, S. N., and Seinfeldt, J. H.: Sensitivity of direct climate forcing by atmospheric aerosol-size and composition, J. Geophys. Res., 100, 18 739–18 754, 1995.
Raes, F., Van Dingenen, R., Vignati, E., Wilson, J., Putaud, J. P., Se-infeld, J. H., and Adams, P.: Formation and cycling of aerosols in the global troposphere, Atmos. Environ., 34, 4215–4240, 2000. Rogers, R. R. and Yau, M. K.: A Short Course in Cloud Physics,
Third edition, Pergamon Press, 293, 1989.
Schr¨oder, F., K¨archer, B., Fiebig, M., and Petzold, A.: Aerosol states in the free troposphere at northern latitudes, J. Geophys. Res., 107, 8126, doi:10.1029/2000JD000194, 2002.
Seinfeld J. H. and Pandis S. N.: Atmospheric Chemistry and Physics: From Air Pollution to Climate Change, J. Wiley, New York, 1998.
Slinn, W. G. N.: Parameterizations for Resuspension and for Wet and Dry Deposition of Particles and Gases for Use in Radiation Dose Calculations, Nuclear Safety, 19, 205–219, 1978.
Tunved, P., Hansson, H.-C., Kulmala, M., Aalto, P., Viisanen, Y., Karlsson, H., Kristensson, A., Swietlicki, E., Dal Maso, M., Str¨om, J., and Komppula, M.: One year boundary layer aerosol size distribution data from five nordic background stations, At-mos. Chem. Phys., 3, 2183–2205, 2003,
SRef-ID: 1680-7324/acp/2003-3-2183.
Twomey, S. A.: Pollution and the planetary albedo, Atmos. Envi-ron., 8, 1251–1256, 1974.
V¨akev¨a, M., H¨ameri, K., Puhakka, T., Nilsson, E. D., Hohti, H., and M¨akel¨a, J. M.: Effects of meteorological processes on aerosol particle size distribution in an urban background area, J. Geo-phys. Res., 105, 9807–9821, 2000.
Williams, J., de Reus, M., Krejci, R., Fischer, H., and Str¨om, J.: Application of the variability-size relationship to atmospheric aerosol studies: estimating aerosol lifetimes and ages, Atmos. Chem. Phys., 2, 133–145, 2002,
SRef-ID: 1680-7324/acp/2002-2-133.
Zhang, L., Gong, S., Padro, J., and Barrie, L.: A size-segregated particle dry deposition scheme for an atmospheric module, At-mos. Environ., 35, 549–560, 2001.