HAL Id: hal-02120673
https://hal-univ-rennes1.archives-ouvertes.fr/hal-02120673
Submitted on 16 Jul 2019HAL is a multi-disciplinary open access archive for the deposit and dissemination of sci-entific research documents, whether they are pub-lished or not. The documents may come from teaching and research institutions in France or abroad, or from public or private research centers.
L’archive ouverte pluridisciplinaire HAL, est destinée au dépôt et à la diffusion de documents scientifiques de niveau recherche, publiés ou non, émanant des établissements d’enseignement et de recherche français ou étrangers, des laboratoires publics ou privés.
factors on the power of antidepressant trials
Astrid Chevance, Florian Naudet, Raphaël Gaillard, Philippe Ravaud,
Raphaël Porcher
To cite this version:
Astrid Chevance, Florian Naudet, Raphaël Gaillard, Philippe Ravaud, Raphaël Porcher. Power behind the throne: A clinical trial simulation study evaluating the impact of controllable design factors on the power of antidepressant trials. International Journal of Methods in Psychiatric Research, Wiley, 2019, 28 (3), pp.e1779. �10.1002/mpr.1779�. �hal-02120673�
ORIGINAL ARTICLE
Power behind the throne: a clinical trial simulation study evaluating the impact of controllable design factors on the power of antidepressant trials
Running title: Design factors and power of antidepressant trials
A. Chevance MD; F. Naudet2 MD, PhD; R. Gaillard3 MD, PhD; P. Ravaud4 MD, PhD; R.
Porcher5 PhD
Inserm U1153 Team METHODS; University Paris Descartes; Service Hospitalo-universitaire de Psychiatrie, Centre hospitalier Sainte-Anne, Paris, France.
2 Meta-research Innovation Center (METRICS), Stanford University, Palo Alto, CA, USA; Univ
Rennes, CHU Rennes, Inserm, CIC 1414 [(Centre d’Investigation Clinique de Rennes)], F- 35000 Rennes, France
3 Inserm U894, Centre de psychiatrie et neurosciences; University Paris Descartes; Service
Hospitalo-universitaire de Psychiatrie, Centre Hospitalier Sainte-Anne, Paris, France.
4 Inserm U1153, Team METHOD; Cochrane France; University Paris Descartes; Centre
d’Épidémiologie Clinique, Hôtel-Dieu, Assistance Publique-Hôpitaux de Paris, Paris, France; Mailman School of Public Health, Columbia University, NY, USA.
5 Inserm U1153, Team METHODS; University Paris Descartes; Centre d’Épidémiologie
Clinique, Hôtel-Dieu, Assistance Publique-Hôpitaux de Paris,, Paris, France.
Author for correspondence:
Astrid Chevance
Centre de Recherche Epidémiologie et Statistique Sorbonne Paris Cité, Equipe METHODS Hôpital Hôtel Dieu, 1, place du Parvis Notre-Dame, 75004 PARIS
Tel : +33 1 42 24 89 77
astrid.chevance@gmail.com
Acknowledgements :
The authors acknowledge Mr Eiko Fried who gave aggregated data from his own research and Dr Alexandre Salvador for his helpful reading of the paper.
Author contributions :
Astrid Chevance wrote manuscript, designed research, performed research, analyzed data Florian Naudet designed research
Raphaël Gaillard designed research Philippe Ravaud designed research
Disclosures:
Raphaël Gaillard received compensation as a member of the scientific advisory board of Janssen, Lundbeck, Roche, Takeda. He has served as consultant and/or speaker for Astra Zeneca, Pierre Fabre, Lilly, Lundbeck, Otsuka, SANOFI, Servier, SOBI, LVMH and received compensation, and received research support from Servier and Sisley.
The other authors have no competing interests.
Funding: This work was supported by a grant from the Fondation pour la Recherche Médicale
ABSTRACT:
Objective: to evaluate the impact of controllable design factors on the power of antidepressants
trials.
Methods: Using clinical trial simulation (CTS), we analyzed the combined impact on the power
of trials of controllable design factors (sample size, outcome metrics, disease severity at inclusion) and uncontrollable parameters (heterogeneity of diseases labeled “depression” in the source population, and selective effects of drugs on items of the Hamilton Depression Rating Scale [HDRS], the most used outcome measurement tool). We elaborated 3840 scenarios calibrated with real data, particularly the publication bias-corrected effect size.
Results: For an effect size of 0.26, simulations revealed that in trials with ≤ 650 participants, power was less than 80%. Among the tested outcome metrics, the “remission” outcome provided more robustness for sample heterogeneity, whereas the continuous outcome “HDRS changes” provided more robustness when investigating drugs with a selective effect on the HDRS items. For the “remission” outcome, the power of trials increased with increasing HDRS threshold at inclusion but decreased with the outcomes “response” and “HDRS changes. Drugs with a selective effect on the HDRS items could not reach the same power as for the reference drug.
Conclusion: Our study allows for drawing recommendations to avoid underpowered trials of
antidepressants.
INTRODUCTION
Up to 2016, 522 double-blind randomized controlled trials (RCTs) investigating 21 antidepressants and including 116 477 participants were conducted (Cipriani et al., 2018). Despite the great number of trials, the efficacy of antidepressants is still debated mainly because of inconsistencies across studies (Ioannidis, 2008; Moncrieff, 2015; Moncrieff & Kirsch, 2015). The coexistence of positive and inconclusive studies leads to the impression of contradictory results, even though they are not: inconclusive does not mean negative. Nonetheless, heterogeneity in the design of the studies (choice of the outcome measurement, time of the measurement of the endpoint etc) may cause inconsistent results as well as underpowered studies which increases random error. (Khan, Bhat, Kolts, Thase, & Brown, 2010; Khan, Mar, & Brown, 2018).
We believe that trials investigating antidepressants are underpowered because of design factors and therefore do not allow for drawing any conclusions on the antidepressant’s efficacy. Several hypotheses have been investigated to explain the high rate of inconclusive studies: the overestimation of effect sizes of antidepressants, due to publication bias, which leads to an underestimation of the sample size needed (Turner, Matthews, Linardatos, Tell, & Rosenthal, 2008); the use of several versions of the Hamilton Depression Rating Scale (HDRS), the most-used endpoint measurement tool (Furukawa et al., 2018); the severity of depression at inclusion (Khan, Kolts, Thase, Krishnan, & Brown, 2004); and the use of different randomization ratios, trial durations, and statistical analyses (G. Santen, Horrigan, Danhof, & Della Pasqua, 2009) etc.
Because of the poor reproducibility of diagnoses according to The Diagnostic and Statistical Manual of Mental Disorders used for including trial participants (Freedman et al., 2013) and the overlapping of symptoms between differential diagnoses (Borsboom & Cramer, 2013; Boschloo
et al., 2015), we suspect a great heterogeneity of diseases labeled under the diagnosis of “depression” in the trial sample and across trials. Some patients may be included even when they have no depression but rather another mental disorder, and this proportion varies across trials (Li et al., 2012). If this heterogeneity is not taken in account in calculating the trial’s power, it could lead to underpowered studies and inconclusive results. Besides the heterogeneity of the sample, the choice of an endpoint, understood not only as a measurement tool but also as a metric and an aggregation method, is crucial (Khan et al., 2004; Zarin, Tse, Williams, Califf, & Ide, 2011) In fact, the choice between a continuous or binary outcome, which implies defining a cutoff, is critical, particularly when the outcome measurement tool is a scale. Moreover, properties of the outcome measurement tool HDRS may also raise difficulties in interpreting the results. For example, some authors claimed that if the insomnia or anxiety were cured, the HDRS score would change without the depression itself being cured (Fournier et al., 2010; Khan et al., 2010; Nutt, 2014). This last remark suggests that some drugs could have selective effects on items of the HDRS and could also affect trial power. Some of the characteristics of a trial that can be controlled include sample size, choice of the outcome metric and aggregation method, as well as disease severity at inclusion. However, others, such as the heterogeneity of the disease labeled under the diagnosis of “depression” or the specific effects of drugs, are uncontrollable.
We aimed to improve the determination of controllable parameters when designing a trial, to ensure good trial power. We used clinical trial simulation (CTS) to study the impact of several controllable design factors (choice of outcome, sample size, baseline disease severity) on the power of RCTs investigating antidepressants versus placebo while taking into account uncontrollable characteristics (heterogeneity of sample and selective effects of drugs). For each
trial participant, we modeled the distribution of the score for each item of the HDRS according to all these factors. Our model could be used for better sample-size calculation in designing trials.
METHODS
RCTs of antidepressant drugs versus placebo typically use the HDRS as an outcome measure (Bagby, Ryder, Schuller, & Marshall, 2004; Hamilton, 1960). We modeled the post-treatment HDRS score for each item of the HDRS for each participant. We calibrated the model in order to reproduce data available in the literature. Then, we proposed a wide range of scenarios varying the heterogeneity of the population as well as the trial sample size and drug characteristics. For each scenario, we replicated 1000 trials and analyzed the 3 main outcomes used in the literature, which allowed for estimating the trial power in each setting. The 3 outcomes were 1) remission as defined by a HDRS score < 8; 2) response as defined by a decrease in HDRS score of ≥ 50% as compared to baseline; and 3) changes in HDRS score analyzed as a continuous outcome with adjustment on the baseline score, called as “HDRS changes”.
Model of the outcome
We built a model of the distribution of the post-treatment score for each item i of the HDRS, for a participant j, named 𝑌𝑖𝑗, which follows a mixed ordinal logistic model with a random intercept and slope. Accordingly, this distribution of 𝑌𝑖𝑗 depended on the baseline score 𝑋𝑖𝑗 as well as the treatment received ( : 0 if placebo, 1 if drug) and participant-specific effect and (inter-𝑍𝑗 𝑏0 𝑏1
individual variability).
, logit
[
𝑃(𝑌𝑖𝑗≤ 𝑘)]
= logit[
𝑃(𝑋𝑖𝑗≤ 𝑘)]
+ 𝛼𝑖(
𝑋𝑖𝑗― 𝐸(𝑋𝑖𝑗))
+ 𝜃0𝑖+ 𝜃1𝑖𝑍𝑗+ 𝑏0+ 𝑏1𝑍𝑗with
(
𝑏0𝑏1)
~ 𝑀𝑉𝑁(
(
00)
,(
𝜎² ―𝜎² 2 . ―𝜎² 2 𝜎²)
)
Model calibration and validation
The “reference population” in our simulation was calibrated after aggregating data from the STAR*D observational study (Fried et al., 2016) (see supplementary data 1). We assumed that the source population of the trial was a mixture of participants with depression and without depression but with other diseases that are considered the main differential diagnoses of depression: bipolar disorder, adaptive disorder, post-traumatic stress disorder, generalized anxiety disorder, and alcohol abuse. We made this assumption because of the high heterogeneity of HDRS profiles found in the STAR*D study (Fried & Nesse, 2015). At the first treatment stage, there were 3 703 outpatients and 1 030 unique HDRS profiles. This huge diversity was not attributable to disease severity. The frequency of the most common profile was about 1.8% and was actually an asymptomatic profile. Moreover, we chose these diseases because of their overlapping symptoms (Borsboom & Cramer, 2013; Boschloo et al., 2015). We then considered that although the different populations would have the same mean HDRS score at baseline, they would not respond in the same way to the drug or placebo. For each disease, we implemented a distribution of the scores before treatment for each item according to data found in the literature (see supplementary data 2 and supplementary data 3-9).
We used the test–retest reproducibility for each item of the HDRS as a proxy for (Trajković et 𝛼𝑖
al., 2011).
We calibrated the response to placebo for each disease with data available from the literature (see supplementary data 10). We also calibrated the response to antidepressants for each disease by using available data (see supplementary data 11). We used data for paroxetine to model the effect of the “reference drug” (Gijs Santen, Gomeni, Danhof, & Pasqua, 2008) mixed with the pooled effect size of selective serotonin reuptake inhibitors for each item found in a
meta-analysis(Hieronymus, Emilsson, Nilsson, & Eriksson, 2016). For the global effect of the reference drug, we used the corrected data from Turner et al. that take into account publication bias (Turner et al., 2008). Accordingly, our effect size was 0.26, as measured by the standardized mean difference (SMD) in changes in HDRS score (Hedges’s g). We added response variability in each group with a random effect in order to reproduce reality calibrated with the average variability found in clinical trials. (Hieronymus et al., 2016) We chose studies of antidepressants for pathologies without depressive comorbidities so as to capture the effect of the drug on the non-depressive pathology (schizophrenia, generalized anxiety disorder, post-traumatic stress disorder, adaptive disorder, alcohol abuse).
These calibration steps ensured that the model with the reference drug in the reference population closely reproduced real observed data.
Data generation
We used Monte-Carlo simulations to generate the score distribution for the 17 items of the HDRS for each population (bipolar disorder, adaptive disorder, post-traumatic stress disorder, generalized anxiety disorder, schizophrenia, depression, and alcohol abuse). We then built 4 large source populations as mixtures of different proportions of these diagnoses: a reference population (distribution from the STAR*D), a fictional 100% depressed population (using the effect size 0.37, uncorrected for publication bias), called population 1, a fictional population with 25% proportion of bipolar disorder (population 2) and a fictional population with 20% proportion of adaptive disorder (population 3). We then simulated trials for each of these source populations.
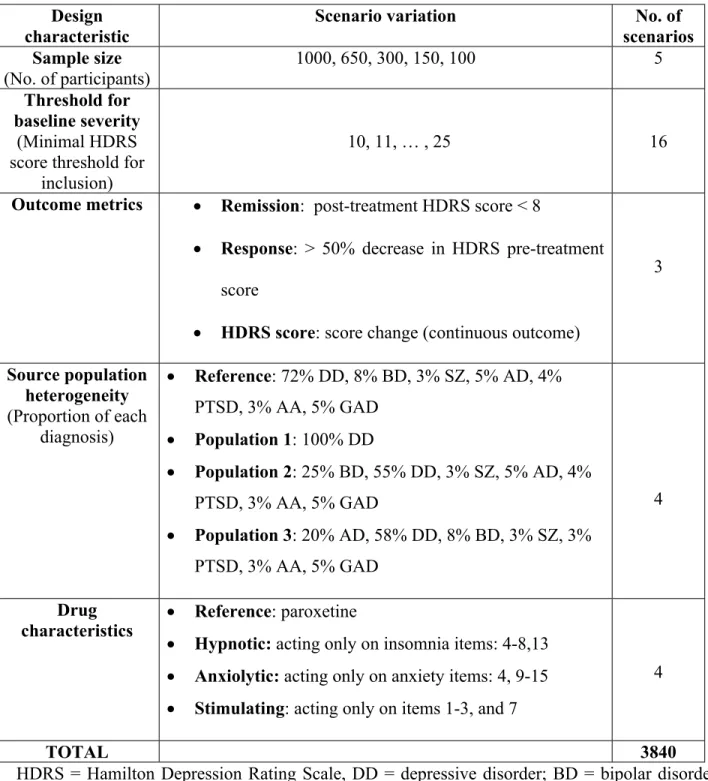
We analyzed 3840 scenarios. Each scenario is a combination of one modality of each factor investigated (Table 1).
Sample sizes
We investigated 5 different sample sizes — 100, 150, 300, 650 and 1000 participants — because most of the trials have sample sizes from 100 to 300 participants (Cipriani et al., 2009; Hieronymus et al., 2016; Kirsch et al., 2008) and a few have about 600 participants (Khan, Redding, & Brown, 2008). We then used usual power calculation (previous size effect and variability found in the literature) to calculate that with 1000 participants, the power would be > 90% (Hieronymus et al., 2016; Turner et al., 2008). Even if a 90% power allows for type II error to be twice the type I error, in practice, most trials are powered between 80% and 90%, most even being 80%. (Charles, Giraudeau, Dechartres, Baron, & Ravaud, 2009). We chose to have higher values than what is currently the practice for RCTs .
HDRS threshold for inclusion in trials
Whether baseline disease severity can affect the power of the study is debated. Most of the studies included participants with HDRS score > 13, and because severe depression is suspected to possibly respond better to antidepressant drugs, some trials focused on participants with HDRS scores > 25 (Fournier et al., 2010; Khan, Schwartz, Kolts, Ridgway, & Lineberry, 2007). Santen et al. investigated 2 thresholds (>19 and >25 (G. Santen et al., 2009)), but we analyzed the whole range of cutoffs between 10 (slight depression) and 25 (severe depression).
Outcome metrics
We compared the 3 most-used outcome metrics in antidepressant trials (Cipriani et al., 2009; Hieronymus et al., 2016):
Remission, defined as a post-treatment HDRS score < 8 (binary outcome)
Response, defined as a decrease of at least 50% in HDRS pre-treatment score (binary outcome)
HDRS changes, defined as the HDRS score change adjusted on baseline values (continuous outcome)
Binary outcomes were analyzed by Fisher’s exact test. HDRS score was analyzed by ANCOVA, with the post-treatment score as the outcome variable and treatment type (placebo or drug) and pre-treatment score as the explanatory variables, which is equivalent to comparing changes adjusted for baseline. Even if ANCOVA may not be the most correct way of analyzing changes for continuous outcomes, because of the assumption of normality, it is most used in practice (Egbewale, Lewis, & Sim, 2014; Twisk & Proper, 2004).
Sample heterogeneity
We first built a fictional source population (called population 1) composed of 100% depressed individuals and calibrated by the effect size of the antidepressant effect with publication bias (SMD =0.37). Several reports in the literature give evidence of heterogeneity in the population of depression trials. For example, Li et al. showed that 7.6% to 12.1% of participants with major depressive disorder (MDD) were reclassified as having bipolar disorder after 8 years and that 25% of non-responders to antidepressants had bipolar disorder as compared with 8% of responders (Li et al., 2012). Moreover, 50% of MDD participants could have type 2 bipolar disorder (Benazzi, 2007). According to these studies, we investigated a scenario with a source population consisting of 25% bipolar disorder, 55% MDD and a mix of the other diagnoses
called “population 2“. We also created a source population consisting of 20% adaptive disorder (population 3), whose symptoms overlap almost completely with those of depression.
Drug characteristics
The possibility of finding a positive trial even when it could cure only a few symptoms is a worry (Nutt, 2014). To test whether trials of such drugs could reach appropriate power, we modeled 3 drugs that could selectively affect a few items of the HDRS: insomnia, anxiety or mood (Table 1 and supplementary data 12)
End-point of the simulation
For each scenario, we reported the statistical power, that is, the proportion of trials for which the null hypothesis was rejected at two-sided 0.05 significance.
Number of replications
Each scenario was replicated 1000 times (3 840 000 trials simulated). This number was set by considering that the resulting fluctuation interval for 90% power would be [88-92%], which we considered acceptable.
Computational methods and graphical representation of the results
We generated the simulations by using Monte-Carlo simulation. The model creation, simulations, statistical analyses and graphics involved using Rv3.4.0 (available at https://www.r-project.org/). Simulated results were presented as nested loop plots (Rücker & Schwarzer, 2014).
RESULTS
Calibration of the model
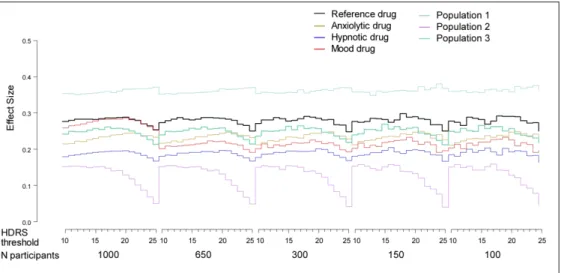
Effect size
To verify the calibration of the model, we calculated the effect size as reported in Figure 1. The effect size for the reference drug in the reference population was 0.26 and is consistent with the Turner et al. corrected effect size of 0.27 reported by Hieronymus (Hieronymus et al., 2016; Turner et al., 2008). The effect size for the source population consisting of 100% depressed patients was about 0.37, which corresponds to the value in published studies with publication bias (Turner et al., 2008), which we considered as an upper limit.
Variation of heterogeneity in samples by HDRS threshold at inclusion
Our model allows for a double variation of the proportion of the different diseases in a sample according 1) to their proportion in the source population and 2) to the HDRS threshold at inclusion (Figure 2). For example, by increasing the HDRS threshold for inclusion, the proportion of participants with depression, post-traumatic stress disorder and adaptive disorder decreased, whereas the proportion of participants with bipolar disorder and schizophrenia increased, mainly in population 2 (Figure 2 panel B). The greater the disease severity at inclusion, the more participants with bipolar disorder or schizophrenia without depression were recruited.
Global effect of controllable design factors on trial power taking into account uncontrollable factors
First uncontrollable factor: heterogeneity of the disease labeled under the diagnosis of “depression”
We considered the heterogeneity of the disease labeled under the diagnosis of depression in the source population (and thus in the sample) as uncontrollable. Figure 3 presents the global effect of 3 controllable parameters — effect size, outcome metrics and baseline disease severity — on the power of trials that include samples with different types of heterogeneity ( population 1, 2 and 3 and the reference population as described in STAR*D (Fried & Nesse, 2015)).
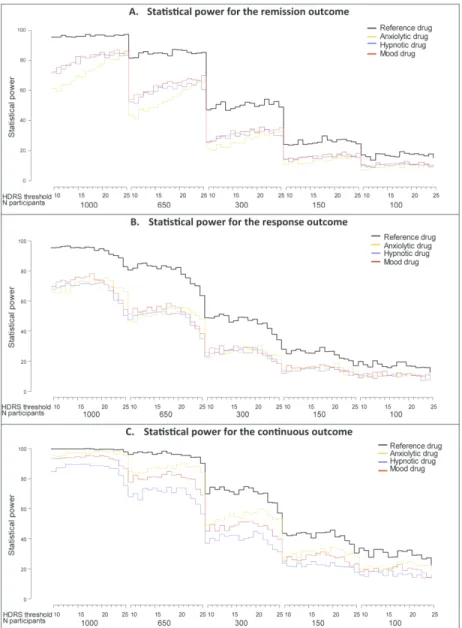
For all outcomes (remission, response and HDRS changes, see “Methods” below for a definition for each outcome), power was systematically ≤ 80% for trials with sample sizes ≤ 650 participants and heterogeneous populations. The outcomes “response” and ”HDRS changes” led to high sensitivity to source-population heterogeneity, whereas remission was more robust. In fact, the 4 slopes in panels B and C of Figure 3 are separated (with lower power for the population with a larger proportion of bipolar disorder participants), whereas those of panel A stay together. Moreover, the remission outcome (Fig. 3A) is robust to HDRS threshold at inclusion except for the population with a larger proportion of bipolar disorder participants. For the latter, the power of the trials increased with increasing HDRS threshold. This result is explained by a translation of the distribution of the global HDRS score to the right for the higher HDRS threshold versus what occurred for the reference population (see supplementary data 13). This situation diminishes the probability of having an HDRS score of 8, that is, a positive endpoint (remission). In contrast, panels B and C show that the outcomes response and ”HDRS changes” are highly sensitive outcomes to population heterogeneity.
The power of the trials was lower for population 2 than the other populations. Moreover, the power of the trials for population 2 was highly sensitive to the HDRS threshold at inclusion and decreased to ≤ 20% for high values of the threshold, even for the largest sample (1000 participants). The 2 other heterogeneous populations (reference and population 3) were sensitive to the HDRS threshold at inclusion. For t population 1, the outcomes response and HDRS changes led to high trial power. Trials with these outcomes were not sensitive to the HDRS threshold at inclusion.
Second uncontrollable factor: elective effects of drugs on items of the HDRS
We considered the hypothesis of a preferential effect of certain drugs on items of the HDRS as an uncontrollable characteristic of a trial that could affect power. Figure 4 presents the global effect of controllable design factors (e.g., effect size, outcome metrics and baseline severity) for the reference drug (calibrated with paroxetine data(Gijs Santen et al., 2008)) and 3 fictional drugs with selective effects on items of the HDRS. The trial power was markedly lower for all drugs with selective effects on HDRS items than for the reference drug, which affected all HDRS items. Therefore, in our simulation settings, it seemed improbable that selective drugs could be found efficient beyond chance.
The power was lower with binary outcomes than with HDRS changes for the selective drugs and was always ≤ 80% with sample size < 650. The loss of power was less marked with the outcome HDRS changes, especially for the fictional drug that would have a selective effect on anxiety items of the HDRS. To a lesser extent, the outcomes response and HDRS changes showed sensitivity to the HDRS threshold at inclusion: whatever the drug, the slopes were bell-shaped (Fig. 4A,C). In contrast, for remission (panel B), the statistical power of trials of selective drugs increased with increasing HRDS threshold at inclusion.
DISCUSSION
Implications for methodological choices in trial
The reluctance of pharmaceutical companies to invest in new drug development has been interpreted as possible consequence of the high risk of failure (inconclusiveness of studies) (Gelenberg et al., 2008). In fact, the likelihood of success for a trial challenging an antidepressant against placebo is 50% (G Santen, van Zwet, Danhof, & Della Pasqua, 2009; Turner et al., 2008). The investigation of the global impact of controllable design parameters and uncontrollable characteristics of the trials on power leads to the following recommendations:
1. Samples with fewer than 650 participants led to underpowered studies given that the effect sizes were corrected for publication bias. In the last meta-analysis of Cipriani et al., only 2/179 trials (1%) with 2 arms (antidepressant versus placebo) included more than 300 individuals per arm.(Cipriani et al., 2018) Our results quantify more precisely the intuitive recommendation for including “several hundreds” of patients indicated by several authors.(Khan et al., 2018)
2. The power is highly sensitive to the heterogeneity of diseases labeled under the diagnosis of “depression” in the trial population. Today it is not affordable to lower this heterogeneity in trials because of the absence of a reliable diagnosis. However, reducing this heterogeneity might make the trial population not representative of the target population (22). Rather, trials should use outcomes that are sufficiently robust to heterogeneity to improve the generalizability of their results. We showed more robustness of trials that used remission rather than response as an outcome. Changes in continuous
HDRS, one of the outcomes used in meta-analyses, showed good robustness to both sample heterogeneity and drug characteristics.
3. The minimal disease severity of patients for inclusion mainly affects the power of trials when using the outcome “response” or “HDRS changes”, whereas the remission outcome was more robust (Figs. 3 and 4). Khan et al. showed that trials including patients with an HDRS threshold of 17 to 20 at inclusion could give the best power.(Khan et al., 2007) According to our results, this was only true for the remission outcome for all populations except for population 1 (Fig. 3A) and for all drugs in the reference population (Fig. 4A) but not for the other outcomes (response and HDRS changes).
4. Our simulations show that trials of drugs with effects on only selective items of HDRS (such as sleep or mood) lead to a lower power than those of the reference drug, contrary to what has been suggested (Moncrieff, 2015).
The study suggests that the choice of the outcome is critical for the power of the study. For instance, binary outcomes obtained by dichotomizing a score imply defining a threshold, often criticized as arbitrary (e.g. choosing 50% for reduction of symptoms). We used common thresholds, but their choice could also influence the results, which we did not investigate.
However, we compared remission and response criteria, which dichotomize absolute and relative changes in HDRS. Thus, the use of different outcomes metrics could explain the observed
inconsistencies across studies.
Relevance of CTS to investigate design properties
Classically CTS is used to model drug actions with pharmacokinetic and pharmacodynamic factors (PK-PD model) and disease progression factors (G Santen et al., 2009). The trial execution model, which we investigated, allows for comparing several possible designs according
to power or type 1 or type 2 errors. Santen et al. underlined that CTS has an advantage in meta-analysis of real data. First, any data that cannot be exhaustively collected in reality can be used. Second, CTS can precisely control the effect of each factor, which is practically impossible when analyzing data from real trials. Therefore, using real data for our purpose would not allow for investigating the impact on power of 1) the heterogeneity of diseases labeled under the diagnosis of “depression” because if the false-positive result was identifiable, participants with other diseases would have been excluded from real trials (exclusion criteria); 2) the fine-grained effect of the HDRS threshold (minimal disease severity) for inclusion (we investigated all possible cutoffs between 10 and 25, but only a few thresholds are used across trials; and 3) the potential selective effect of the drug investigated on items of the HDRS scale.
Calibration of the model
To modelize the inter-individual variability we chose var(b1)=var(b0), where b0 is the effect of the inter-individual variability in the placebo arm and (b0+b1) the effect of the inter-individual variability in the treatment arm. To calibrate that part of the model, we used the table 2 of Hieronymus paper reporting for 18 RCTs the baseline and endpoint (post-treatment) means and standard deviations of the HDRS score in each arm. (Hieronymus et al., 2016) It showed no difference between the arms neither for baseline nor for endpoint. We also perform a simulation using var(b1)=0.5var(b0) and found no differences in the power of studies (data not shown).
One of the main objectives of the study was to investigate the impact of the heterogeneity of the sample on the power of RCTs. To create important heterogeneity for some scenarios, we chose to calibrate the “bipolar population” as poorer responders than the “depressed population”, although whether the population represents poorer or better or identical responders is debated (see references 1 to 9 in supplementary data 11). Choosing a poorer response allowed us to investigate
the worst case heterogeneity. We used real data to calibrate the model and reproduce reality. Our choices for calibration depended on the availability of data. With the development of open data, we hope to make more exhaustive and refined calibrations to improve the precision of our model. CTS and meta-analysis of real datasets are in fact complementary. CTS theoretically investigates the effect of design features on the properties of trial analysis. It allows for a better knowledge of the behavior of real trials and thus a better interpretation of the analysis of real data. A pitfall of CTS studies may be the reification of the simulated object. CTS cannot conclude on the efficacy of an antidepressant, but it can truly investigate the trial design features and predict the power of trials much better than classical power calculation, which takes into account only sample size and end-point variability between arms.
As for every CTS study, the definition of the model and its calibration can be challenged. We underline that our model is open and can be used by other researchers according to their research questions and assumptions.
One other limitation was the feasibility of the model because of the amount of computational time needed to generate populations, simulate trials and calculate outcome measures. We considered that 1000 replications would be sufficient to estimate power, but for estimating type I error rate or for lower effect sizes, more runs are required.
In our study, we focused on the impact of design features on the power of trials. We did not assess randomization ratio, dropout mechanisms, trial duration, timing or statistical analysis (use of mixed model for repeated measures, dual random-effects model, last observation carried forward, etc.), because we considered that they were addressed by Santen et al. (G. Santen et al., 2009; G Santen et al., 2009). The authors used CTS for trials of antidepressants investigating several parameters similar to ours but with a smaller range of variation (sample sizes 100 to 175,
2 baseline HDRS thresholds). Moreover, they did not investigate outcome metrics, population heterogeneity or the possible selective effect of drugs.
The originality of our approach is modeling the heterogeneity of the population to explain the variability of the results of trials investigating antidepressants. The other original point, which has not been raised by other CTS examinations of antidepressants, is to investigate the potential selective effect of treatment and its impact on power. Further development of the use of CTS for trials of antidepressants could be investigating of drugs versus a gold standard (and not just placebo) or other outcome measurement tools, comparing them to evaluate their properties in the context of controlling for other factors.
CONCLUSION
Clinical trial simulation is useful to theoretically investigate the impact of controllable design factors and uncontrollable parameters on the power of trials. For challenging drugs such as antidepressants, we advise more complex calculations for power, as does our model, than the simple one based on only expected effect size and response variability found in the literature, so as to limit underpowered studies that are a form of wasted research. Moreover, we underline the importance of using robust outcomes that allow for generalizability to the target population.
REFERENCES
Bagby, R. M., Ryder, A. G., Schuller, D. R., & Marshall, M. B. (2004). The Hamilton Depression Rating Scale: has the gold standard become a lead weight? The American Journal of Psychiatry, 161(12), 2163‑2177. https://doi.org/10.1176/appi.ajp.161.12.2163
Benazzi, F. (2007). Bipolar disorder—focus on bipolar II disorder and mixed depression. The Lancet, 369(9565), 935‑945. https://doi.org/10.1016/S0140-6736(07)60453-X
Borsboom, D., & Cramer, A. O. J. (2013). Network analysis: an integrative approach to the structure of psychopathology. Annual Review of Clinical Psychology, 9, 91‑121.
https://doi.org/10.1146/annurev-clinpsy-050212-185608
Boschloo, L., Borkulo, C. D. van, Rhemtulla, M., Keyes, K. M., Borsboom, D., & Schoevers, R. A. (2015). The Network Structure of Symptoms of the Diagnostic and Statistical Manual of Mental Disorders. PLOS ONE, 10(9), e0137621. https://doi.org/10.1371/journal.pone.0137621 Charles, P., Giraudeau, B., Dechartres, A., Baron, G., & Ravaud, P. (2009). Reporting of sample size
calculation in randomised controlled trials: review. The BMJ, 338. https://doi.org/10.1136/bmj.b1732
Cipriani, A., Furukawa, T. A., Salanti, G., Chaimani, A., Atkinson, L. Z., Ogawa, Y., … Geddes, J. R. (2018). Comparative efficacy and acceptability of 21 antidepressant drugs for the acute treatment of adults with major depressive disorder: a systematic review and network meta-analysis. Lancet (London, England), 391(10128), 1357‑1366. https://doi.org/10.1016/S0140-6736(17)32802-7 Cipriani, A., Furukawa, T. A., Salanti, G., Geddes, J. R., Higgins, J. P., Churchill, R., … Barbui, C. (2009).
Comparative efficacy and acceptability of 12 new-generation antidepressants: a multiple-treatments meta-analysis. Lancet (London, England), 373(9665), 746‑758.
Egbewale, B. E., Lewis, M., & Sim, J. (2014). Bias, precision and statistical power of analysis of covariance in the analysis of randomized trials with baseline imbalance: a simulation study. BMC Medical Research Methodology, 14, 49. https://doi.org/10.1186/1471-2288-14-49
Fournier, J. C., DeRubeis, R. J., Hollon, S. D., Dimidjian, S., Amsterdam, J. D., Shelton, R. C., & Fawcett, J. (2010). Antidepressant drug effects and depression severity: a patient-level meta-analysis. JAMA, 303(1), 47‑53. https://doi.org/10.1001/jama.2009.1943
Freedman, R., Lewis, D. A., Michels, R., Pine, D. S., Schultz, S. K., Tamminga, C. A., … Yager, J. (2013). The initial field trials of DSM-5: new blooms and old thorns. The American Journal of Psychiatry, 170(1), 1‑5. https://doi.org/10.1176/appi.ajp.2012.12091189
Fried, E. I., & Nesse, R. M. (2015). Depression is not a consistent syndrome: An investigation of unique symptom patterns in the STAR*D study. Journal of Affective Disorders, 172, 96‑102.
https://doi.org/10.1016/j.jad.2014.10.010
Fried, E. I., van Borkulo, C. D., Epskamp, S., Schoevers, R. A., Tuerlinckx, F., & Borsboom, D. (2016). Measuring Depression Over Time . . . or not? Lack of Unidimensionality and Longitudinal Measurement Invariance in Four Common Rating Scales of Depression. Psychological Assessment. https://doi.org/10.1037/pas0000275
Furukawa, T. A., Cipriani, A., Leucht, S., Atkinson, L. Z., Ogawa, Y., Takeshima, N., … Salanti, G. (2018). Is placebo response in antidepressant trials rising or not? A reanalysis of datasets to conclude this long-lasting controversy. Evidence-Based Mental Health, 21(1), 1‑3. https://doi.org/10.1136/eb-2017-102827
Gelenberg, A. J., Thase, M. E., Meyer, R. E., Goodwin, F. K., Katz, M. M., Kraemer, H. C., … Khan, A. (2008). The History and Current State of Antidepressant Clinical Trial Design: A Call to Action for Proof-of-Concept Studies. The Journal of Clinical Psychiatry, 69(10), 1513‑1528.
Hamilton, M. (1960). A rating scale for depression. Journal of Neurology, Neurosurgery, and Psychiatry, 23, 56‑62.
Hieronymus, F., Emilsson, J. F., Nilsson, S., & Eriksson, E. (2016). Consistent superiority of selective serotonin reuptake inhibitors over placebo in reducing depressed mood in patients with major depression. Molecular Psychiatry, 21(4), 523‑530. https://doi.org/10.1038/mp.2015.53
Ioannidis, J. P. (2008). Effectiveness of antidepressants: an evidence myth constructed from a thousand randomized trials? Philosophy, Ethics, and Humanities in Medicine, 3, 14.
https://doi.org/10.1186/1747-5341-3-14
Khan, A., Bhat, A., Kolts, R., Thase, M. E., & Brown, W. (2010). Why Has the Antidepressant–Placebo Difference in Antidepressant Clinical Trials Diminished over the Past Three Decades? CNS
Neuroscience & Therapeutics, 16(4), 217‑226. https://doi.org/10.1111/j.1755-5949.2010.00151.x Khan, A., Kolts, R. L., Thase, M. E., Krishnan, K. R. R., & Brown, W. (2004). Research design features and
patient characteristics associated with the outcome of antidepressant clinical trials. The American Journal of Psychiatry, 161(11), 2045‑2049.
https://doi.org/10.1176/appi.ajp.161.11.2045
Khan, A., Mar, K. F., & Brown, W. A. (2018). The conundrum of depression clinical trials: one size does not fit all. International Clinical Psychopharmacology, 33(5), 239‑248.
https://doi.org/10.1097/YIC.0000000000000229
Khan, A., Redding, N., & Brown, W. A. (2008). The persistence of the placebo response in antidepressant clinical trials. Journal of Psychiatric Research, 42(10), 791‑796.
https://doi.org/10.1016/j.jpsychires.2007.10.004
Khan, A., Schwartz, K., Kolts, R. L., Ridgway, D., & Lineberry, C. (2007). Relationship between depression severity entry criteria and antidepressant clinical trial outcomes. Biological Psychiatry, 62(1), 65‑71. https://doi.org/10.1016/j.biopsych.2006.08.036
Kirsch, I., Deacon, B. J., Huedo-Medina, T. B., Scoboria, A., Moore, T. J., & Johnson, B. T. (2008). Initial Severity and Antidepressant Benefits: A Meta-Analysis of Data Submitted to the Food and Drug Administration. PLOS Med, 5(2), e45. https://doi.org/10.1371/journal.pmed.0050045
Li, C.-T., Bai, Y.-M., Huang, Y.-L., Chen, Y.-S., Chen, T.-J., Cheng, J.-Y., & Su, T.-P. (2012). Association between antidepressant resistance in unipolar depression and subsequent bipolar disorder: cohort study. The British Journal of Psychiatry, 200(1), 45‑51.
https://doi.org/10.1192/bjp.bp.110.086983
Moncrieff, J. (2015). Antidepressants: misnamed and misrepresented. World Psychiatry: Official Journal of the World Psychiatric Association (WPA), 14(3), 302‑303. https://doi.org/10.1002/wps.20243 Moncrieff, J., & Kirsch, I. (2015). Empirically derived criteria cast doubt on the clinical significance of
antidepressant-placebo differences. Contemporary Clinical Trials, 43, 60‑62. https://doi.org/10.1016/j.cct.2015.05.005
Nutt, D. (2014). The Hamilton Depression Scale—accelerator or break on antidepressant drug discovery? Journal of Neurology, Neurosurgery & Psychiatry, 85(2), 119–120.
Rücker, G., & Schwarzer, G. (2014). Presenting simulation results in a nested loop plot. BMC Medical Research Methodology, 14, 129. https://doi.org/10.1186/1471-2288-14-129
Santen, G., Gomeni, R., Danhof, M., & Pasqua, O. D. (2008). Sensitivity of the individual items of the Hamilton depression rating scale to response and its consequences for the assessment of efficacy. Journal of Psychiatric Research, 42(12), 1000‑1009.
https://doi.org/10.1016/j.jpsychires.2007.11.004
Santen, G., Horrigan, J., Danhof, M., & Della Pasqua, O. (2009). From trial and error to trial simulation. Part 2: an appraisal of current beliefs in the design and analysis of clinical trials for
antidepressant drugs. Clinical Pharmacology and Therapeutics, 86(3), 255‑262. https://doi.org/10.1038/clpt.2009.107
Santen, G., van Zwet, E., Danhof, M., & Della Pasqua, O. (2009). From Trial and Error to Trial Simulation. Part 1: The Importance of Model-Based Drug Development for Antidepressant Drugs. Clinical Pharmacology & Therapeutics, 86(3), 248‑254. https://doi.org/10.1038/clpt.2009.105
Trajković, G., Starčević, V., Latas, M., Leštarević, M., Ille, T., Bukumirić, Z., & Marinković, J. (2011).
Reliability of the Hamilton Rating Scale for Depression: A meta-analysis over a period of 49 years. Psychiatry Research, 189(1), 1‑9. https://doi.org/10.1016/j.psychres.2010.12.007
Turner, E. H., Matthews, A. M., Linardatos, E., Tell, R. A., & Rosenthal, R. (2008). Selective Publication of Antidepressant Trials and Its Influence on Apparent Efficacy. New England Journal of Medicine, 358(3), 252‑260. https://doi.org/10.1056/NEJMsa065779
Twisk, J., & Proper, K. (2004). Evaluation of the results of a randomized controlled trial: how to define changes between baseline and follow-up. Journal of Clinical Epidemiology, 57(3), 223‑228. https://doi.org/10.1016/j.jclinepi.2003.07.009
Zarin, D. A., Tse, T., Williams, R. J., Califf, R. M., & Ide, N. C. (2011). The ClinicalTrials.gov Results Database — Update and Key Issues. The New England journal of medicine, 364(9), 852‑860.
TABLE 1: Scenario variations according to design characteristics investigated by simulating trials of antidepressants
Design characteristic
Scenario variation No. of
scenarios Sample size (No. of participants) 1000, 650, 300, 150, 100 5 Threshold for baseline severity (Minimal HDRS score threshold for
inclusion)
10, 11, … , 25 16
Outcome metrics Remission: post-treatment HDRS score < 8
Response: > 50% decrease in HDRS pre-treatment score
HDRS score: score change (continuous outcome)
3 Source population heterogeneity (Proportion of each diagnosis) Reference: 72% DD, 8% BD, 3% SZ, 5% AD, 4% PTSD, 3% AA, 5% GAD Population 1: 100% DD Population 2: 25% BD, 55% DD, 3% SZ, 5% AD, 4% PTSD, 3% AA, 5% GAD Population 3: 20% AD, 58% DD, 8% BD, 3% SZ, 3% PTSD, 3% AA, 5% GAD 4 Drug
characteristics Reference: paroxetine
Hypnotic: acting only on insomnia items: 4-8,13 Anxiolytic: acting only on anxiety items: 4, 9-15 Stimulating: acting only on items 1-3, and 7
4
TOTAL 3840
HDRS = Hamilton Depression Rating Scale, DD = depressive disorder; BD = bipolar disorder; SZ = schizophrenia; PTSD = Post-traumatic stress disorder; AD = adaptive disorder; GAD = generalized anxiety disorder; AA = alcohol abuse
FIGURE LEGENDS
Fig. 1: Calibration of effect sizes for the 4 source populations and the 4 drugs (uncontrollable parameters of trials) by sample size and HDRS threshold for inclusion (controllable design factors).
Fig. 2: Variability of proportion of diagnoses (%) according to Hamilton Depression Rating Scale threshold at inclusion (HDRS) in the reference population (panel A), population 2 (panel B) and population 3 (panel C).
Fig. 3: Simulation results for calculating the power of trials run in 4 source populations with different heterogeneity (uncontrollable parameters) by sample size and HDRS threshold for inclusion, for 3 outcome metrics (controllable design factors).
Fig 4: Simulation results for calculating the power of trials of 4 drugs with selective effects on items of the HDRS (uncontrollable parameters) by sample size and HDRS threshold for inclusion, for 3 outcome metrics (controllable design factors).
Figure 1 Calibration of effect sizes for the 4 source populations and the 4 drugs (uncontrollable parameters of trials) by sample size and HDRS threshold for inclusion (controllable design factors).
Figure 2 Variability of proportion of diagnoses (%) according to Hamilton Depression Rating Scale threshold at inclusion (HDRS) in the reference population (panel A), population 2 (panel B) and population 3 (panel C)
Figure 3 Simulation results for calculating the power of trials run in 4 source populations with different heterogeneity (uncontrollable parameters) by sample size and HDRS threshold for inclusion, for 3 outcome
metrics (controllable design factors). 177x237mm (300 x 300 DPI)
Figure 4 Simulation results for calculating the power of trials of 4 drugs with selective effects on items of the HDRS (uncontrollable parameters) by sample size and HDRS threshold for inclusion, for 3 outcome metrics