HAL Id: hal-00295567
https://hal.archives-ouvertes.fr/hal-00295567
Submitted on 10 Dec 2004
HAL is a multi-disciplinary open access
archive for the deposit and dissemination of
sci-entific research documents, whether they are
pub-lished or not. The documents may come from
teaching and research institutions in France or
abroad, or from public or private research centers.
L’archive ouverte pluridisciplinaire HAL, est
destinée au dépôt et à la diffusion de documents
scientifiques de niveau recherche, publiés ou non,
émanant des établissements d’enseignement et de
recherche français ou étrangers, des laboratoires
publics ou privés.
revisit to the contribution of aircraft emissions
J. Hendricks, B. Kärcher, A. Döpelheuer, J. Feichter, U. Lohmann, D.
Baumgardner
To cite this version:
J. Hendricks, B. Kärcher, A. Döpelheuer, J. Feichter, U. Lohmann, et al.. Simulating the global
atmospheric black carbon cycle: a revisit to the contribution of aircraft emissions. Atmospheric
Chemistry and Physics, European Geosciences Union, 2004, 4 (11/12), pp.2521-2541. �hal-00295567�
www.atmos-chem-phys.org/acp/4/2521/ SRef-ID: 1680-7324/acp/2004-4-2521 European Geosciences Union
Chemistry
and Physics
Simulating the global atmospheric black carbon cycle: a revisit to
the contribution of aircraft emissions
J. Hendricks1, B. K¨archer1, A. D¨opelheuer2, J. Feichter3, U. Lohmann4,*, and D. Baumgardner5
1DLR-Institut f¨ur Physik der Atmosph¨are, Oberpfaffenhofen, Germany 2DLR-Institut f¨ur Antriebstechnik, K¨oln, Germany
3Max-Planck-Institut f¨ur Meteorologie, Hamburg, Germany 4Dalhousie University, Halifax, Canada
5Centro de Ciencias de la Atm´osfera, Universidad Nacional Autonoma de Mexico, Mexico City, Mexico *now at: ETH, Institut f¨ur Atmosph¨are und Klima, Z¨urich, Switzerland
Received: 19 April 2004 – Published in Atmos. Chem. Phys. Discuss.: 22 June 2004 Revised: 13 October 2004 – Accepted: 1 December 2004 – Published: 10 December 2004
Abstract. The black carbon (BC) burden of the upper tro-posphere and lowermost stratosphere (UTLS) is investigated with the general circulation model (GCM) ECHAM4. The special focus is the contribution of aircraft emissions to the UTLS BC loading. Previous studies on the role of aircraft emissions in the global BC cycle either neglect BC sources located at the Earth’s surface or simplify the BC cycle by as-suming pre-defined BC residence times. Here, the global BC cycle including emissions, transport, and removal is explic-itly simulated. The BC emissions considered include sur-face sources as well as BC from aviation. This enables a consistent calculation of the relative contribution of aviation to the global atmospheric BC cycle. As a further extension to the previous studies, the aviation-induced perturbation of the UTLS BC particle number concentration is investigated. The uncertainties associated with the model predictions are evaluated by means of several sensitivity studies. Especially, the sensitivity of the results to different assumptions on the BC hygroscopic properties is analysed. The simulated UTLS BC concentrations are compared to in-situ observations. The simulations suggest that the large-scale contribution of avia-tion to the UTLS BC mass budget typically amounts to only a few percent, even in the most frequented flight regions. The aviation impact far away from these regions is negligible. The simulated aircraft contributions to the UTLS BC par-ticle number concentration are much larger compared to the corresponding mass perturbations. The simulations suggest that aviation can cause large-scale increases in the UTLS BC particle number concentration of more than 30% in regions highly frequented by aircraft. The relative effect shows a pronounced annual variation with the largest relative aviation impact occurring during winter.
Correspondence to: J. Hendricks
(johannes.hendricks@dlr.de)
1 Introduction
Anthropogenic black carbon (BC) emissions cause signifi-cant perturbations of the global atmospheric aerosol burden (e.g. Penner et al., 1993; Cooke and Wilson, 1996; Liousse et al., 1996; Cooke et al., 1999, 2002). Different atmospheric impacts of BC aerosols have been discussed. Important cli-matic effects due to direct impacts on radiation can be ex-pected (e.g. Schult et al., 1997; Haywood and Ramaswamy, 1998; Myhre et al., 1998; Penner et al., 1998; Cooke et al., 1999; Chung and Seinfeld, 2002; Jacobson, 2002). Addition-ally, indirect climatic effects due to impacts on cloud droplet number concentration and related cloud properties have been considered (e.g. Lohmann et al., 2000). In the upper tro-posphere and lowermost stratosphere (UTLS), BC particles may be involved in ice cloud formation and may affect the frequency and optical properties of cirrus clouds (e.g. De-Mott et al., 1997; Jensen and Toon, 1997; Petzold et al., 1998; Str¨om and Ohlsson, 1998; K¨archer, 1999; Gierens, 2003; K¨archer and Lohmann, 2003; Lohmann et al., 2004).
Significant amounts of BC aerosols have been observed in the UTLS (e.g. Pueschel et al., 1992; Blake and Kato, 1995; Baumgardner et al., 2003, 2004). Three-dimensional (3-D) model calculations indicate a significant BC loading of the UTLS (e.g. Cooke and Wilson, 1996; Liousse et al., 1996; Cooke et al., 1999, 2002; Koch, 2001; K¨ohler et al., 2001; Chung and Seinfeld, 2002). Black carbon aerosols are an important combustion product of aircraft engines (e.g. IPCC, 1999). Therefore, it has been debated whether avi-ation may contribute significantly to the BC budget of the UTLS region. Danilin et al. (1998) discussed global sim-ulations on the atmospheric dispersion of aircraft fuel tracer emissions performed with different 2-D and 3-D models con-sidering pre-defined tracer lifetimes. From the fuel tracer dis-tributions, the aircraft-induced increase in atmospheric BC
mass loading was derived considering typical BC emission indices. Rahmes et al. (1998) performed 2-D simulations on the aircraft contribution to the atmospheric BC mass load-ing includload-ing a detailed representation of processes control-ling the atmospheric BC cycle. The Danilin et al. (1998) and Rahmes et al. (1998) model studies reveal maximum zonal mean aircraft-induced perturbations in the range of 0.1–1 ng(BC)/m3occurring in the northern mid- and high lat-itude UTLS. However, since the effect of surface BC emis-sions on the UTLS region was not included in the models, the relative impact of aviation BC emissions could not be quan-tified. Detailed knowledge about the total BC loading of the UTLS or about the contribution of BC from surface sources to the UTLS BC budget is required to evaluate the relative importance of the aviation impact.
Comparing the observational data provided by Pueschel et al. (1992) and Blake and Kato (1995) with the model stud-ies by Danilin et al. (1998) and Rahmes et al. (1998), one finds that the BC concentrations measured in the northern hemispheric mid- and high latitude UTLS are comparable to the simulated aircraft-induced perturbations. However, re-cent observations by Baumgardner et al. (2003, 2004) reveal that UTLS BC concentrations can be significantly larger than the simulated aviation-induced BC levels. The observational data currently available is too sparse to provide climatolog-ical information on the global BC mass budget. Hence, a robust evaluation of the importance of the simulated aviation impact on the basis of observations is currently not possible. Information on the UTLS background BC concentrations, attributed to BC from surface sources, can be gained from other global model studies focused on the atmospheric dis-persion of BC from surface emissions (e.g. Cooke and Wil-son, 1996; Liousse et al., 1996; Cooke et al., 1999; Koch, 2001; Cooke et al., 2002; K¨ohler et al., 2001; Chung and Seinfeld, 2002). The UTLS background BC concentrations simulated with the various models can show large differ-ences. Since also the aviation-induced perturbations sim-ulated with the different model approaches discussed by Danilin et al. (1998) and Rahmes et al. (1998) differ signifi-cantly, calculations of the relative impact of aviation should be based on a consistent model approach including both sur-face BC emissions as well as BC from aviation. The only study analysing the aviation impact with such a consistent approach was provided by K¨ohler et al. (2001). The study re-veals that the contribution of aviation to the UTLS BC mass loading is small (generally <1%). However, K¨ohler et al. (2001) stressed that, due to the consideration of pre-defined BC half-lifetimes in their simulations, a reliable quantifica-tion of the aviaquantifica-tion impact was not possible. This indicates the need for a more physically-based consistent simulation of the respective contributions of aviation and surface sources to the UTLS BC budget.
In the present study, the impact of aviation on the global BC budget is quantified by means of simulations with a gen-eral circulation model (GCM) considering both 3-D aircraft
BC emissions as well as BC from surface sources. The at-mospheric BC cycle including BC emissions, transport, and removal by wet and dry deposition is simulated explicitly. Aircraft-related BC is treated separately from BC particles resulting from surface emissions to track its atmospheric fate. The previous model studies focused on the atmospheric BC mass loading. Given the potential impact of BC particles on ice cloud formation via heterogeneous nucleation, poten-tial aircraft-induced impacts on the BC particle number con-centration in the UTLS region are also investigated here. In Sect. 2, the model is described in detail. Section 3.1 reports on the simulations performed. The major results as well as the uncertainties associated with the model predictions are discussed in Sect. 3.2. The main conclusions are given in Sect. 4.
2 Model description 2.1 General description
The ECHAM4 GCM (Roeckner et al., 1996) is applied. Stan-dard prognostic variables are vorticity, divergence, tempera-ture, (logarithm of) surface pressure, water vapor and cloud water. The model includes physical parameterizations of radiation, cloud processes, precipitation, convection, diffu-sion, planetary boundary layer dynamics, land-surface pro-cesses as well as gravity wave drag. A spectral transform approach with triangular truncation at zonal wave number 30 (T30) is used. This results in a nominal horizontal resolu-tion of approximately 3.75◦in latitude and longitude. The model domain covers the vertical range from the surface to 10 hPa using 19 vertical layers characterized by a hybrid σ -p-coordinate system. A semi-implicit leap frog scheme is applied for time integration. A time step 1t of 30 min is used. The horizontal and vertical advection of positive def-inite quantities like water vapor, cloud water or trace con-stituents is calculated applying a semi-Lagrangian scheme (Williamson and Rasch, 1994).
2.2 Aerosols and clouds
The model version employed here includes explicit predic-tions of cloud water, cloud ice, as well as cloud droplet and ice crystal number concentration (Lohmann and Roeckner, 1996; Lohmann et al., 1999; Lohmann and K¨archer, 2002). The convective transport of trace constituents is treated ac-cording to Brinkop and Sausen (1997). Aerosols are repre-sented as described by Feichter et al. (1996) and Lohmann et al. (1999). The aerosol module treats the atmospheric cy-cles of sulfate aerosols, carbonaceous particy-cles (organic car-bon as well as BC), sea-salt, and mineral dust aerosols. Par-ticle mass concentrations of the respective aerosol types are predicted each time step. Emissions of BC particles, repre-sentative of the mid-1980s, are considered as described by Cooke and Wilson (1996) resulting in global BC emission
rates of 7.96 and 5.98 TgC yr−1for BC emissions due to
fos-sil fuel combustion and biomass burning, respectively. The hygroscopic properties of BC particles are represented ac-cording to Cooke et al. (1999) assuming that the BC surface emissions can be characterized as 80% hydrophobic and 20% hydrophilic particles and that hydrophobic BC is transformed to hydrophilic BC according to an exponential decay process showing an e-folding time of 24 h. BC is removed from the atmosphere by wet and dry deposition. Dry deposition rates are calculated according to the surface conditions and the BC hygroscopic properties. Wet deposition occurs via precipita-tion scavenging of hydrophilic BC. It is assumed that 90% of the in-cloud hydrophilic BC mass is scavenged by cloud droplets. This is consistent with upper limit in-cloud BC scavenging rates reported in the literature (e.g. Hitzenberger et al., 2001). The BC precipitation flux is then calculated from the in-cloud precipitation formation rate as well as from the efficiencies of below-cloud evaporation and below-cloud scavenging of BC by rain or snow. In contrast to Lohmann and K¨archer (2002), the mass scavenging efficiency of hy-drophilic aerosols by ice is chosen as 5% instead of 10%. With this modification, the sulfate mass concentrations sim-ulated for the tropopause region are in better agreement with recent observations (Dibb et al., 1998, 2000).
To calculate particle number concentrations from the sim-ulated aerosol mass concentrations, prescribed particle size distributions typical of the respective aerosol type are em-ployed. Lognormal size distributions as described by K¨opke et al. (1997) and Hess et al. (1998) are used for each individual aerosol type. Aged BC particles are mostly fractal clusters which can be characterized as long, often multi-connected chains consisting of tiny spherical elements. These spherules are referred to as primary BC particles. Fol-lowing K¨opke et al. (1997), the particle size distribution of the spherules is characterized by a number median diame-ter of d=0.0236 µm and a geometric standard deviation of
σ=2.0. A specific density of the subspheres of 2.3 g cm−3 is assumed. To derive the BC particle number concentration from the BC mass concentration, knowledge about the aver-age number of primary particles agglomerated to form an at-mospheric BC particle is required. The number n of primary particles encountered in single atmospheric BC particles can be highly variable even in the upper troposphere and the stratosphere (e.g. Blake and Kato (1995) or Pueschel et al. (2000) for UTLS BC; Strawa et al. (1999) for stratospheric BC). Observational information on n at these altitudes is too sparse to enable robust assumptions on a representative value of n. The available measurements suggest that n has an or-der of magnitude of 10–100. However, small BC particles are underrepresented in these measurements. Hence, we as-sume that BC particles resulting from surface sources con-tain 10 primary particles on average. With this assumption the BC particle number concentration can be derived from the BC mass concentration. The potential consequences of the choice of n for the results of the present study are
dis-cussed in Sect. 3.2.5. Aircraft-related BC particles can show different sizes and morphologies compared to BC related to surface sources. The treatment of aircraft-induced particles in the model is described below.
2.3 Aircraft BC emissions
Aircraft BC emissions are calculated here from the global aviation fuel consumption data provided by Schmitt and Brunner (1997) for aircraft activity as occurred in 1992. The data contains information on the global distribution of air-craft fuel use and its annual cycle. A detailed error analysis of global aviation fuel consumption scenarios (IPCC, 1999) reveals that the fuel consumption data used here accounts for only 73% of the amount of aviation fuel produced in 1992. Hence, aviation fuel consumption may be underrepresented in the present study by up to 20–30%. According to the an-nual growth rate of aviation fuel consumption (about 4% per year in the 1984 to 1992 period; IPCC, 1999), the aviation fuel use has increased by about 30% from the mid-1980s to 1992. Hence, an underestimation as described above would make the aviation fuel consumption data more conformable with the BC surface emissions which are representative of the mid-1980s.
BC emission rates are derived from the aircraft fuel con-sumption data using BC emission indices (EIs) typical of commercial aircraft operating in 1992. Emission indices for BC mass emission rates, EI(M), have been provided by D¨opelheuer (1997) and Petzold et al. (1999). An update of these EIs including an altitudinal variation is used here. Representative EIs were determined for different altitudes by means of a correlation method considering variations in engine type and power conditions (D¨opelheuer, 2002). As shown in Fig. 1, the EI(M) decreases from values in the range of 0.08 g(BC)/kg(fuel) at the lowest flight levels to values around 0.02 g(BC)/kg(fuel) at 11.5 km and increases again to 0.08 g(BC)/kg(fuel) at 16 km to account for super-sonic aircraft. The 1992 fleet average EI(M) amounts to 0.038 g(BC)/kg(fuel). The correlation method used to deter-mine these EIs is conform to the measured emission data cur-rently available within a maximum deviation of 10%. Hence the potential uncertainties of the correlation method used to calculate the EIs appear to be too small to result in significant uncertainties of the BC simulations performed here.
To derive the number concentration of BC particles re-sulting from aviation, aircraft exhaust BC number-to-mass ratios also representative of the 1992 fleet are employed (D¨opelheuer, 2002). The number-to-mass ratios, also re-ferred to as particle number EIs or EI(N), range from 4.8×10¹⁵ particles/g(BC) at the surface to around 1.6×10¹⁶ particles/g(BC) at cruise altitude (Fig. 1). The correla-tion method used to derive the EI(N) reproduces measured number-to-mass ratios with an accuracy of ±10%. Note, that the EI(N) exceed the number-to-mass ratio assumed for par-ticles related to surface sources (Sect. 2.2) by an order of
Fig. 1. Vertical profiles of aircraft emission indices for the BC mass
(solid) and particle number emission (dashed), representative of the 1992 aircraft fleet. For details see Sect. 2.3 and D¨opelheuer (2002).
magnitude (factor 22 at cruise altitude, factor 7 at surface). This is consistent with measurements of particle size distri-butions of freshly emitted BC. The measurements suggest that BC generated by biomass burning (e.g. Radke et al., 1988; Penner et al., 1998) or fossil fuel combustion (e.g. Maricq et al., 1999) at the Earth’s surface show a much larger fraction of large BC particles (accumulation mode size range;
> ∼100 nm) than BC emitted by aircraft at cruise altitudes which mostly shows particle sizes smaller than 100 nm (Pet-zold et al., 1999). This is mainly caused by the more efficient combustion in aircraft engines.
Annual mean vertically integrated BC emissions due to aviation, derived from the aviation fuel consumption data and the EIs described above, are displayed in Fig. 2. The figure reveals that the major fraction of the aircraft BC emis-sions occur at northern midlatitudes, especially over North America, the North Atlantic, and Europe. The vertical dis-tribution of the BC emission rates considered (not shown) reveals that 38% by mass and 58% by number of the total aircraft BC emissions occur at the main flight levels between 10 km and 12 km altitude. The seasonal variation consid-ered (not shown) can be large in remote areas but is only small in the main flight regions (mostly within 10%). The total global emission rate of BC from aviation amounts to 0.0047 TgC yr−1.
2.4 Aircraft BC mass concentration
To quantify the aircraft contribution to the total BC bur-den in our simulations, aircraft-related BC is numerically represented as an individual trace constituent treated sepa-rately from BC originating from surface sources. The
emis-Fig. 2. Annual mean vertically integrated BC emissions due to
avi-ation. The emission rates were derived from aviation fuel consump-tion data and emission indices for the 1992 global fleet (see Sect. 2.3 for details).
sion rates of BC from aviation are calculated as described in Sect. 2.3. It is likely that aircraft-generated BC particles become hydrophilic due to activation by chemical process-ing or deposition of H2O and water soluble material in
con-trails and perhaps also in plumes that do not form concon-trails (K¨archer, 1999). Hence aircraft-induced BC is generally as-sumed to be hydrophilic in the present study. Therefore, the mass cycle of BC from aircraft is simulated as described in Sect. 2.2 for hydrophilic BC. The particle number concentra-tion of aviaconcentra-tion-induced BC is treated differently from that of BC particles originating from surface sources. This will be described in the following.
2.5 Aircraft BC particle number concentration 2.5.1 General remarks
As mentioned in Sect. 2.2, the number concentration of BC particles from surface sources is derived from the mass con-centration assuming a constant number-to-mass ratio. This appears to be justified since BC from surface sources can probably be regarded as aged aerosol in the UTLS character-ized by a quasi-invariant size distribution. However, BC from aircraft may possess highly variable number-to-mass ratios ranging from those values which are characteristic of fresh exhaust (Sect. 2.3) to smaller values typical of aged parti-cles. The latter may show a larger degree of agglomeration and may also be mixed with particulate matter not generated by aircraft. Many processes relevant for the ageing of BC from aircraft, for instance, the processing of BC by clouds, are currently not well understood. Many effects of aircraft
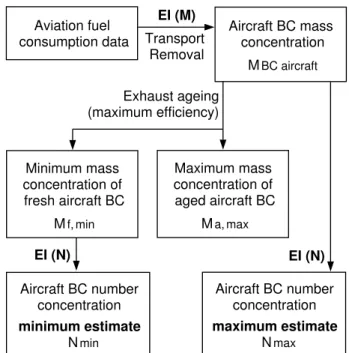
BC ageing are conceivable, but observational confirmation is lacking. Regarding these uncertainties, a detailed quan-tification of the BC particle number concentrations was not attempted in this study. Nevertheless, maximum and min-imum estimates of the aircraft-induced BC particle number perturbations were performed (Fig. 3).
2.5.2 Maximum estimate
A maximum estimate Nmax of the number concentration of
BC particles from aircraft can be obtained by assuming that the number-to-mass ratio is not affected by particle ageing. Therefore, the high BC number-to-mass ratio EI(N) typical for fresh exhaust (Sect. 2.3) applies to the total mass concen-tration simulated for BC from aviation MBCaircraf t: Nmax=EI (N ) × MBCaircraf t (1) For details on the implementation of Eq. (1), we refer to Sect. 2.5.4.
2.5.3 Minimum estimate
A minimum estimate of the number concentration of aircraft-generated BC particles can be achieved considering only the particle fraction which was not affected by ageing processes reducing the particle number-to-mass ratio. To achieve this,
MBCaircraf t is subdivided into “fresh” BC with the mass
concentration Mf and “aged” BC with the mass
concen-tration Ma. “Fresh” BC is generated in the model
accord-ing to the BC emission rate. The transformation of “fresh” to “aged” particles is parameterized considering the major ageing processes which potentially reduce the number-to-mass ratio. Considering a maximum efficiency of these age-ing processes results in a minimum estimate Mf,min of the
amount of “fresh” BC from aviation.
To account for the BC ageing caused by aerosol-aerosol interactions in aircraft plumes, we follow the approach by K¨archer and Meilinger (1998) to parameterize aircraft ex-haust particle ageing. According to this approach, the dom-inant aerosol-aerosol interaction leading to changed BC par-ticle number concentrations in ageing aircraft plumes is the scavenging of BC particles by larger liquid background aerosols in the accumulation mode size range. This pro-cess, which is still relevant after dispersion of the exhaust to large scales, results in liquid particles showing one or sev-eral BC immersions. Following the approach by K¨archer and Meilinger (1998), the number of fresh aircraft BC particles (not scavenged by larger aerosols) is estimated here as:
Nf(t + 1t ) = Nf(t ) ×exp[−Ks,bNl(t )1t ]. (2)
Here Nf(t ) and Nl(t ) are the number concentrations of
fresh aircraft-generated BC particles and accumulation mode background particles, respectively, Ks,bis a coagulation
efficient, and 1t is the model time step. A coagulation co-efficient of Ks,b=10−8cm3s−1 was chosen based on Fuchs
Aviation fuel consumption data EI (M) Transport Removal Aircraft BC number concentration minimum estimate Nmin EI (N) Aircraft BC mass concentration MBC aircraft Minimum mass concentration of fresh aircraft BC Mf,min Maximum mass concentration of aged aircraft BC Ma,max Exhaust ageing (maximum efficiency) EI (N) Aircraft BC number concentration maximum estimate Nmax
Fig. 3. Flow chart of the approach to obtain minimum and
maxi-mum estimates of the number concentration of BC particles from aircraft. For a detailed description of the method, we refer to Sects. 2.4 and 2.5.
(1964) and on the particle sizes of aircraft-generated BC and background aerosols (Petzold et al., 1999; Schr¨oder et al., 2002). The number concentration Nl(t )is calculated from
the simulated liquid aerosol mass concentration and observed aerosol size distributions (Schr¨oder et al., 2002). In order to obtain a minimum estimate of the aircraft BC particle num-ber concentration, the maximum possible scavenging rate should be considered. Therefore, Nl was increased by a
ftor of 5 to represent maximum number concentrations of ac-cumulation mode particles observed in the UTLS (Petzold et al., 2002; Minikin et al., 2003).
In order to calculate Mf,min, it is assumed that the mass
transformation rate scales with the rate of number transfor-mation given by Eq. (2). This assumption is justified since the size distribution of aircraft-generated BC is dominated by particles in a comparatively narrow size range (e.g. Pet-zold et al., 1999) and, therefore, impacts of particle size on the scavenging process are of secondary importance.
Ageing of aircraft-induced BC populations may also oc-cur via cloud processing. BC particles from aircraft can be scavenged by cloud droplets or ice crystals. The BC parti-cles can then be removed by precipitation or can be released by re-evaporation of clouds or precipitation. In the case of re-evaporation, the released aircraft BC particles could be incorporated within larger agglomerates of scavenged par-ticles. Hence, cloud processing potentially results in a re-duction of the aircraft BC particle number-to-mass ratio. In order to perform a minimum estimate of the amount of fresh
Table 1. Summary of model runs.
Experiment Description
BASE standard simulation, τBC=24 h
PHIL as BASE, but BC generally hydrophilic PHOB as BASE, but τBC=48 h
NOICE as BASE, but scavenging of aerosols by cloud ice is neglected above the 400 hPa level.
τBC:=e-folding time for transformation of hydrophobic to
hy-drophilic BC.
aircraft-generated BC Mf,min, the maximum potential
im-pact of cloud processing has to be considered in the model. Therefore, the fresh aircraft BC is transformed into aged BC as soon as significant cloud activity occurs within the air mass carrying the BC particles. The transformation is acti-vated as soon as the cloud liquid water content and the cloud droplet number concentration exceed 5 mg m−3and 10 cm−3 or as soon as the ice water content and the ice crystal number concentration exceed 0.5 mg m−3and 0.1 cm−3. These val-ues can be regarded as lower limit thresholds for the occur-rence of significant cloud activity (e.g. Pruppacher and Klett, 1997).
Aircraft exhaust BC can also interact with contrail ice which is not considered in the simulations performed here. Exhaust BC particles can be incorporated into contrail ice by serving as heterogeneous ice nuclei or by coagulation scav-enging by contrail ice particles (K¨archer, 1999). Incorpora-tion during contrail formaIncorpora-tion substantially reduces the num-ber concentration of the BC particles but is unlikely to cause persistent changes of their number-to-mass ratio in the case of short-lived contrails (Schr¨oder et al., 1998). Loss of BC particles due to scavenging by contrail ice becomes relevant only in ageing persistent contrails (K¨archer, 1999). Hence, only in the case of persistent contrails interactions of BC with contrail ice may cause significant reductions of the BC par-ticle number-to-mass ratio. The magnitude of these changes has not yet been quantified by measurements. Persistent con-trails form at or above ice saturation. Since the frequency of ice supersaturated regions mostly is smaller than 25% in the main flight areas (Gierens et al., 2000), the impact of contrail ice particles on BC from aviation is neglected here.
Since the aircraft BC mass fraction Mf,min obtained as
described above is not affected by reductions in number-to-mass ratio, it retained the particle number-number-to-mass ratio EI(N) typical of the fresh exhaust (Sect. 2.3). Therefore, a minimum estimate Nmin of the number concentration of
aviation-induced BC particles can be derived from Mf,min
as:
Nmin=EI (N ) × Mf,min (3)
2.5.4 Technical realisation
The mass concentration M of BC from aircraft can be in-fluenced by BC emissions occurring at different locations. Therefore, local application of Eqs. (1) and (3) requires a constant EI(N). In our simulations, EI(N) varies with altitude and BC from aviation can experience vertical transport and mixing. To overcome this problem, prognostic equations are solved for Mf,min, Ma,max, and the corresponding number
concentrations Nf,min and Na,max. Ma,max is the
comple-mentary amount of Mf,min(Mf,min+Ma,max=MBCaircraf t). Nf,min is equivalent to Nmin, and Na,max is the number
concentration of aged particles resulting from the assump-tion that the number-to-mass ratio is unaffected by particle ageing. Na,max has to be added to Nf,min to obtain Nmax.
The production of Nf,min is calculated from EI(N) and the
aviation BC mass emission rate. Transport and removal of the number concentrations are simulated in analogy to BC mass (Sect. 2.2). Particle ageing is considered according to Sect. 2.5.3.
3 Model studies
3.1 Description of the simulations
To assess the impact of aviation on the atmospheric BC bud-get, a set of model experiments (Table 1) was performed us-ing the model framework described in Sect. 2. A simulation with the standard version of the model was performed which is taken as the reference simulation and which will be re-ferred to as the “BASE” simulation.
The relative contribution of aircraft emissions to the BC budget of the UTLS depends on the corresponding contribu-tion of BC from surface sources which currently is uncer-tain (Sect. 1). A key unceruncer-tainty in simulations of the atmo-spheric BC cycle is the efficiency of BC removal. There-fore, the atmospheric residence time of BC can be mis-represented which complicates the evaluation of BC fluxes from the surface to the UTLS. To investigate the impact of this uncertainty on the UTLS BC budget simulated here, two additional model experiments were performed assum-ing increased/decreased BC removal efficiencies. This was achieved as follows: BC is removed from the atmosphere by wet and dry deposition. The efficiency of the simu-lated BC wet deposition is strongly controlled by the hy-groscopic properties of BC which currently are not well un-derstood. In contrast to hydrophobic BC, hydrophilic BC can be scavenged by cloud droplets and ice particles. There-fore the wet deposition efficiency of BC depends on the ratio of hydrophilic to hydrophobic BC. The hygroscopic proper-ties of BC also control its dry deposition efficiency, since hydrophilic BC is deposited more efficiently over wetted surfaces. Hence, the simulated ratio of hydrophilic to hy-drophobic BC is a key parameter controlling the efficiency
of both wet and dry BC removal processes. In the BASE simulation, 80% of the BC emissions from surface sources are assumed as hydrophobic, 20% as hydrophilic (Sect. 2.2). With an e-folding time of 24 h, hydrophobic BC is assumed to become hydrophilic. In the first sensitivity experiment, BC particles are generally assumed to be hydrophilic (ex-periment “PHIL”). Consequently, BC is removed more effi-ciently compared to the BASE simulation. In a second sen-sitivity experiment, an e-folding time of 48 h is assumed for the conversion of hydrophobic into hydrophilic BC (exper-iment “PHOB”). Therefore BC is removed less efficiently compared to the BASE simulation.
In the global model study by Danilin et al. (1998) on the aviation impact on the UTLS BC load (Sect.1), the impact of wet removal was neglected above 400 hPa. In order to make the results of the present study more comparable to the previ-ous study and in order to assess the impact of BC removal in high clouds, a third sensitivity experiment (“NOICE”) was accomplished. Cloud water in the UTLS is mainly present in the ice phase. In the NOICE simulation, scavenging of BC by ice particles is neglected above the 400 hPa pressure level. The NOICE simulation will be discussed in Sect. 3.2.4 where we compare our results to the simulations performed by Danilin et al. (1998).
The model experiments described above are based on sim-ulations assuming a prescribed annual cycle of sea surface temperatures according to climatological values for the re-spective month. For each individual experiment, 4-year in-tegrations were performed after a 15-month model spin-up. To provide a robust statistical base for the main conclusions, additional 6 model years were simulated for the BASE ex-periment. The prolonged (10-year) integration leads to very similar conclusions than the 4-year BASE simulation. The differences in the UTLS BC load occurring between the 4-year and the 10-4-year simulations are generally not larger than a few percent. There is no trend detectable in the UTLS. These statements hold for total BC and for aircraft-induced BC as well. Hence, with regard to the high computational expenses of the simulations, prolonged integrations were not performed for the PHIL, PHOB and NOICE experiments. 3.2 Results and discussion
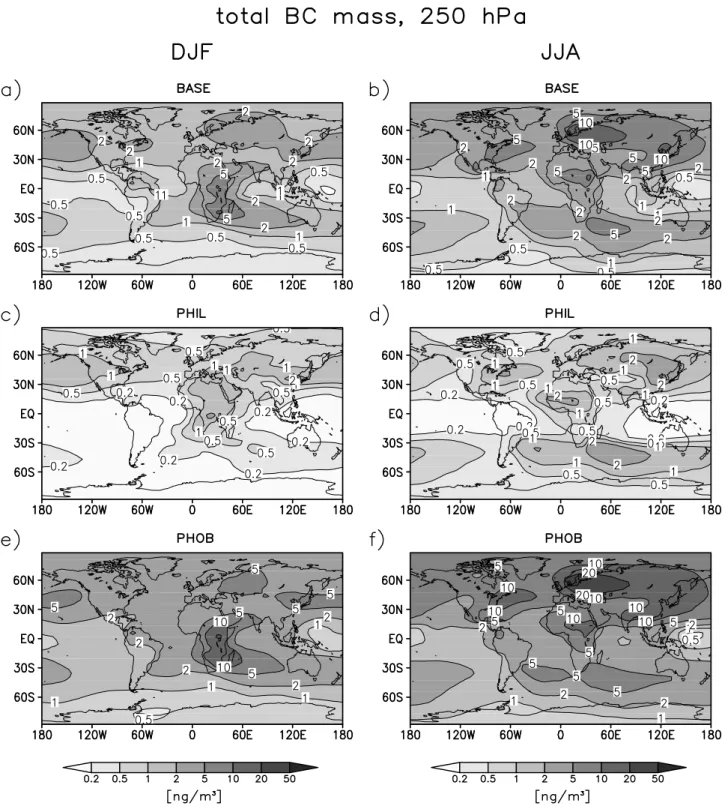
3.2.1 Global distribution of UTLS BC mass loading Global distributions of the total BC mass concentration simu-lated for the 250 hPa pressure level are shown in Fig. 4. The 250 hPa level is chosen since it is located within the main aircraft flight levels. The figure shows results obtained for winter and summer conditions in the BASE, the PHIL and the PHOB experiments.
The BC concentrations simulated in the BASE simulation for 250 hPa range between about 0.5 and 10 ng/m3. The BC concentration fields at that pressure level clearly reflect the spatial and temporal variability of the BC surface sources
de-scribed, for instance, by Liousse et al. (1996) and Cooke and Wilson (1996). As it will be shown in Sect. 3.2.4, the UTLS BC mass budget simulated here is dominated by BC origi-nating from the surface.
The southern hemispheric BC sources are dominated by biomass burning. Due to the strong temporal and spatial vari-ability of biomass burning events, also the BC concentrations simulated for 250 hPa in the southern hemisphere are charac-terized by a strong spatial and seasonal variability. At several locations, the southern hemispheric BC fields simulated for spring and autumn conditions (not shown) are very different from the BC fields obtained for the winter and summer sea-sons.
The BC emissions in the northern hemisphere, especially in the extratropics, are dominated by fossil fuel combustion. The major emission regions of BC from fossil fuel combus-tion are North America, Europe, and Southeast Asia. Due to upward transport of BC from the boundary layer, the plumes of these emission regions can clearly be identified at 250 hPa showing a significant spatial shift induced by westerly flows. Since the seasonal variation of the fossil fuel combustion source is small (such variation is not considered here for sur-face sources), these plumes are the persistent features in the northern midlatitude BC concentration field at 250 hPa at all seasons. The corresponding concentrations are highest dur-ing summer and lowest durdur-ing winter which can be attributed to the seasonal cycle in vertical transport efficiency.
As in previous global model studies (e.g. Cooke and Wil-son, 1996; Cooke et al., 2002), the results obtained in the PHIL and PHOB experiments reveal that the BC concentra-tions simulated for the UTLS show a marked sensitivity to the prescribed hygroscopic properties of BC. When BC is to-tally hydrophilic (case PHIL), the simulated UTLS BC con-centrations are significantly smaller compared to the BASE case. If a larger fraction of BC is hydrophobic (case PHOB), the UTLS BC concentration increases by factors around 2 compared to the reference experiment. These differences are also reflected in the total atmospheric BC burden which, on average, amounts to 0.213, 0.174 and 0.244 TgC in the BASE, PHIL and PHOB simulations, respectively.
3.2.2 Comparison to observations
The sensitivity experiments described above were performed since the current knowledge about the BC hygroscopicity and BC-cloud interactions is poor. To evaluate which of the experiments is most realistic with regard to UTLS BC, the model results have to be compared to observations. Some data sets are available focusing on BC concentrations in air-craft plumes (e.g. Petzold et al., 1999). Due to the small spa-tial scales of the plumes, these data cannot be used for evalu-ating large-scale model output. Only a few data sets of UTLS BC measurements not taken in young aircraft plumes are cur-rently available (Pueschel et al., 1992; Blake and Kato, 1995; Baumgardner et al., 2003, 2004). These measurements were
Fig. 4. Total BC mass concentration (ng/m3) at 250 hPa (main aircraft flight level) during northern hemispheric (NH) winter (left) and summer (right) simulated in the experiments BASE (a, b), PHIL (c, d) and PHOB (e, f). The results represent 4-year averages of the December to February and the June to August periods, respectively.
carried out at a large variety of locations during different episodes. Nevertheless, from a climatological point of view, this data base is too sparse to perform a robust model eval-uation. However, given the lack of additional data, we used
the measurements to obtain a first guess of the model qual-ity. Additional observations of BC in the UTLS are needed to consolidate the model evaluation.
BASE 0.01 0.10 1.00 10.00 observed [ng/m3 ] 0.01 0.10 1.00 10.00 modelled [ng/m 3 ] BC modelled / observed
BK95: Central Pacific, Caribbean BK95: eastern North America BK95: western North America BK95: northern high latitudes BEA03 (LAP): 70N-90N BEA03 (LAP): 60N-70N PHIL 0.01 0.10 1.00 10.00 observed [ng/m3 ] 0.01 0.10 1.00 10.00 modelled [ng/m 3 ] BC modelled / observed PHOB 0.01 0.10 1.00 10.00 observed [ng/m3 ] 0.01 0.10 1.00 10.00 modelled [ng/m 3 ] BC modelled / observed
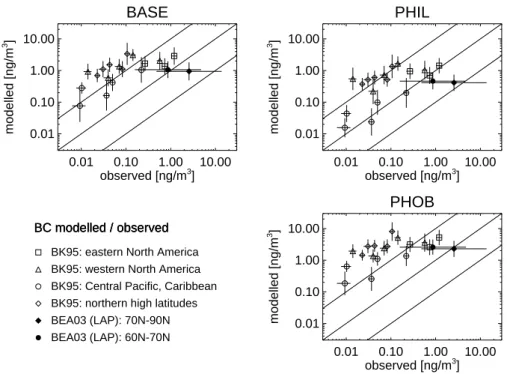
Fig. 5. Comparison of simulated UTLS BC concentrations with in-situ observations of BC (Blake and Kato, 1995, referred to as BK95) and
light absorbing particles (LAP) (Baumgardner et al., 2003, 2004, referred to as BEA03). Simulated BC concentrations (ng/m3) are plotted against observed values. The simulated BC values represent median concentrations and standard deviations (variability of 12-h averages) extracted from the 4-year model output for the geographical positions, altitudes, and months corresponding to the respective observations. Data is shown for the different cases BASE (top left), PHIL (top right) and PHOB (bottom right). Observed values are local values and their uncertainties (BK95) or median values and standard deviations (BEA03). Equity of simulations and observations as well as deviations by one order of magnitude are indicated by diagonal lines. Only measurements performed between 5 and 15 km altitude were considered. Since the original observational data are normalized to standard (STP) conditions, the data has been adjusted to local conditions. See Sect. 3.2.2 for more details.
Figure 5 shows BC concentrations simulated in the BASE, PHIL and PHOB experiments in comparison to the observa-tional data documented by Blake and Kato (1995) (BK95). This data set includes BC concentrations measured from air-craft in the UTLS during different field campaigns at vari-ous locations. Parts of the data were already described by Pueschel et al. (1992). For the comparison, we considered the BC concentrations of the data points located between 5 and 15 km altitude as well as the corresponding uncertainties (data taken from Table 1 in BK95 and adjusted from standard to ambient conditions). The analysis method used by BK95 to derive BC concentrations from wire impactor samples did not take into account the fractal shape of BC particles and did not account for particle bounce. Strawa et al. (1999) showed with a modified method that these simplifications lead to an underestimation of the BC concentration by a factor of 6 on average. Furthermore, Blake and Kato (1995) stressed that small BC particles tend to be underrepresented in the wire impactor samples. Black carbon particles immersed within larger spherical liquid aerosols are generally not detected by the BK95 and the Strawa et al. (1999) method. These un-certainties have to be carefully considered when simulated BC concentrations are compared to the BK95 data. The
un-certainties provided by BK95 (Table 1 in BK95) which are shown in Fig. 5 are probably too low.
The simulated BC concentrations plotted in Fig. 5 were ex-tracted from the model output for the locations, altitudes, and months of the respective measurements. Since the simulated BC concentrations show an asymmetric frequency distribu-tion (frequency maximum shifted towards small concentra-tions), median concentrations are analyzed here rather than averages. The median values as well as the corresponding standard deviations displayed in Fig. 5 were derived from 12-hourly averaged model output assuming a lognormal fre-quency distribution of the BC concentrations. The resulting concentrations are more representative for the values typi-cally occurring in the simulations than the corresponding av-erages.
Figure 5 also shows comparisons of the simulations to the recent aircraft measurements of light absorbing parti-cles (LAP) performed by Baumgardner et al. (2003, 2004) (BEA03) in the UTLS over the North Atlantic and the Arc-tic Sea during a winter episode in 2003. A newly developed single particle soot photometer was applied for these mea-surements. The uncertainty of this method is reported as
The technical details are described by Baumgardner et al. (2003, 2004) and Stephens et al. (2003). The major fraction of the observed LAP particles was found to be BC. However, a large fraction (>40%) was found to be non-BC particles mainly composed of metals. For comparing the data to the simulations, the measured data was averaged over flight seg-ments defined by projecting the flight tracks on the model grid. In analogy to the analysis of the simulations, median LAP concentrations and corresponding standard deviations are then derived from these averages. Therefore, the data was subsumed for the areas between 60◦N and 70◦N and north of 70◦N, respectively. Only those measurements taken above 5 km (all measurements were taken below 15 km) were considered. Differences of the resulting BC concentrations shown in Fig. 5 to the values presented by Baumgardner et al. (2004) are due to the use of median concentrations instead of averages and due to the inclusion of data taken in the upper troposphere.
Given the large uncertainties of the BK95 data, a de-tailed quantitative comparison of these data to the simula-tions would be not reasonable. Nevertheless, some qual-itative features can be compared. The spatial variation of the BC concentrations simulated in the BASE case is similar to that observed by BK95. Both the measurements and the simulations show a marked contrast between polluted con-tinental and remote marine air masses. The smallest BC concentrations occur over the central Pacific whereas large concentrations are found over eastern North America. The data points over western North America, where continental and marine influences compete, tend to show medium con-centrations in the BK95 data as well as in the simulation. This is also the case for the northern high latitude data. Nev-ertheless, the differences in the BC concentration occurring between polluted continental and remote areas are more pro-nounced in the measurements. This possibly reflects that BC immersed within larger liquid aerosol is underrepresented in the BK95 data. Black carbon occurring in remote areas may have been transported over long distances. This implies a large probability that a significant fraction of this BC has been immersed and, therefore, is not detected with the BK95 method.
The BC concentrations simulated in the BASE experiment are well accordable with the BEA03 data taken north of 70◦N. Taking into account that about 50% of the LAP is BC, the simulated and observed median BC concentrations nearly match. Between 60◦N and 70◦N, the simulated BC
con-centrations are similar to the LAP concon-centrations observed by BEA03. However, the simulated concentrations exceed the observed values after taking into account that only about 50% of the observed LAP is BC. Nevertheless, within the given variability ranges, the simulations are accordable with the measured values. It should be addressed whether the measurements could be biassed due to the lower detection particle size limit of 0.15 µm. Observations performed by Neus¨uß et al. (2000a,b, 2002) and Matta et al. (2003) under
a variety of conditions indicate that the BC mass contained in particles smaller than 0.15 µm mostly is small. The con-tribution of these particles to total BC was generally below 30% during the measurements. Hence, the absence of small particles in the observations appears to be of secondary im-portance for this comparison.
The BC concentrations simulated in the PHIL and PHOB experiments which are also displayed in Fig. 5 show spatial variations quite similar to those simulated in the BASE case. However, the simulated absolute BC loadings show marked differences to the BASE experiment. As already discussed in Sect. 3.2.1, the PHIL and PHOB simulations tend to show smaller and larger concentrations, respectively. When we consider that about 50% of the LAP is BC, the PHIL experi-ment is well accordable with the BEA03 measureexperi-ments taken between 60◦N and 70◦N but shows too small concentrations
north of 70◦N. Under the same assumption, the PHOB
sim-ulation shows too much BC. Hence the BASE simsim-ulation ap-pears to be most conformable with the BEA03 data. Given the large uncertainty of the BK95 data, we therefore focus on the BASE case in the assessment of the aviation impact (Sects. 3.2.4 and 3.2.5).
3.2.3 Comparison to other global model studies
Comparisons of BC simulations with the observational data by Blake and Kato (1995) have also been performed in other global model studies (Cooke et al., 1999, 2002; Koch, 2001). As in the simulations performed here, the BC concentrations simulated by Cooke et al. (2002) and Koch (2001) show a similar spatial variation as observed by Blake and Kato (1995). Cooke et al. (1999) focused on altitudinal variations and did not analyse the geographical dependence. Due to the large uncertainties inherent in the measurements, the quality of the UTLS BC concentrations simulated by the different models cannot be evaluated here. Nevertheless, it is worth-while to compare the UTLS BC concentrations obtained with different global model systems.
As mentioned in Sect. 1, simulations of the UTLS BC load are discussed in a couple of global model studies (Cooke and Wilson, 1996; Liousse et al., 1996; Cooke et al., 1999, 2002; Koch, 2001; K¨ohler et al., 2001; Chung and Seinfeld, 2002). Only surface emissions were considered in these studies, ex-cept for K¨ohler et al. (2001) who considered both surface sources and aircraft emissions. The UTLS BC concentra-tions obtained with the different model approaches can show significant deviations. The zonal mean BC concentrations simulated for the pressure range between 300 and 200 hPa in the northern hemisphere vary from values of 1–10 ng/m3 (Li-ousse et al., 1996, and this study) to values of 10–50 ng/m3 (Cooke and Wilson, 1996; Koch, 2001). The studies by Chung and Seinfeld (2002), Cooke et al. (1999, 2002) and K¨ohler et al. (2001) show intermediate concentrations. The corresponding BC concentrations in the southern hemisphere
Fig. 6. Contribution of aviation to the BC mass concentration at 250 hPa (main flight level) during NH winter (a, b) and summer (c, d)
as simulated in the BASE experiment. Absolute contributions (0.01 ng/m3)(a, c) and relative contributions (% of total BC mass)(b, d) are displayed. The results represent 4-year averages of the December to February and the June to August periods, respectively.
are typically an order of magnitude smaller but mostly show similar differences between the various model approaches.
The discrepancies can have manifold reasons. The studies of Cooke et al. (1999) and Cooke et al. (2002) take into ac-count BC emissions from fossil fuel combustion only which causes marked differences to the other studies especially in the tropics and the southern hemisphere where biomass burn-ing is the dominatburn-ing BC source. The simulations by Cooke et al. show comparatively small BC concentrations in the southern hemispheric UTLS. The other studies include BC from both biomass burning and fossil fuel combustion. Since the total emission rates vary only slightly between these
studies, differences in the emission scenarios probably are of secondary importance for the simulated UTLS BC bud-get. Sensitivity experiments performed in some of the stud-ies demonstrate that the simulated UTLS BC concentrations are very sensitive to the treatment of BC wet removal (see also Sect. 3.2.1). Hence, parts of the deviations described above can probably be attributed to different representations of the BC hygroscopicity, precipitation scavenging or precip-itation itself. The studies by Danilin et al. (1998) and Rogers et al. (2002), where aircraft emission tracer simulations per-formed with a large set of global models were compared, in-dicate that also differences in the transport characteristics of
Fig. 7. Left: Vertical distribution of zonal mean total BC mass concentration (ng/m3) during NH winter (a) and summer (c) simulated in the BASE experiment. Right: Corresponding BC contribution of aviation (0.01 ng/m3)(b, d). The displayed concentrations represent 4-year averages of the December to February and the June to August periods, respectively.
the models can be very important. Hence, also the transport scheme applied in the present study is a potential source of uncertainty (see also Sect. 3.2.4).
Due to the lack of extensive observations of BC in the UTLS, it is currently not possible to evaluate the quality of the simulations discussed above. Nevertheless, the UTLS BC concentrations simulated by the different models neglecting aircraft emissions are similar to or even larger than the avail-able observed concentrations. This suggest a very large con-tribution of BC from surface sources to the UTLS BC budget. Given the distinct differences in UTLS BC simulated with the different models, absolute contributions of different sources to the atmospheric BC cycle are not necessarily com-parable if they were estimated with different models. This implies that a quantitative investigation of the relative impact of aircraft emissions to the atmospheric BC budget should be based on a consistent model approach including all relevant BC sources. Comparisons of simulations including only the aviation source (Danilin et al., 1998; Rahmes et al., 1998) with the results of other studies focusing on simulations of
BC from surface sources are not reasonable. In the present study, simulations including both BC from aviation and from surface sources are performed. Estimates of the absolute and relative aviation impacts based on these simulations are dis-cussed below.
3.2.4 Contribution of aviation to BC mass loading
Figure 6 highlights the absolute and relative contribution of BC from aviation to the BC mass concentration at 250 hPa (main flight level) as simulated in the BASE case for win-ter and summer conditions. The amount of BC resulting from aviation is largest at northern midlatitudes. Maximum contributions of more than 0.05 ng/m3 occur in the main flight areas over North America, the North Atlantic and Eu-rope. The aviation contribution at 250 hPa generally exceeds 0.02 ng/m3 at northern midlatitudes and decreases strongly from the northern to the southern hemisphere. The abso-lute aviation impact is largest during summer when the in-flow from lower layers carrying higher amounts of aircraft BC (Fig. 7) is largest. Similarly to BC from surface sources
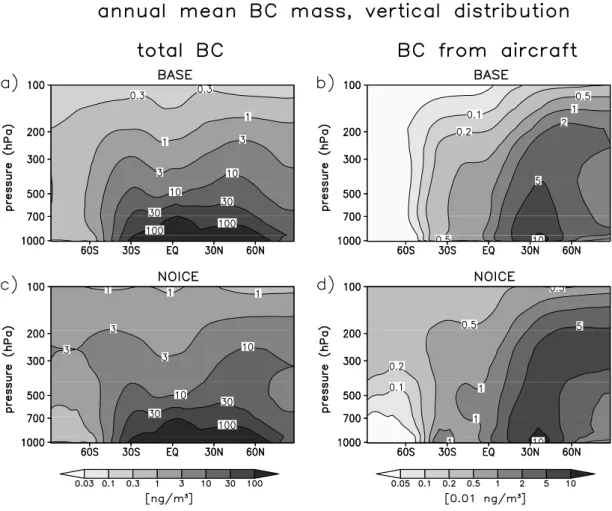
Fig. 8. As Fig. 7, but annual mean BC mass concentrations obtained in the BASE (a, b) and NOICE (c, d) simulations.
(Sect. 3.2.1), BC emitted by aircraft at low altitudes can be transported into the UTLS and can be further dispersed there by efficient westerly flows. Note that the aircraft-induced BC perturbations simulated for spring and autumn condi-tions (not shown) exhibit no extraordinary features and fit smoothly in the annual cycle suggested by the results ob-tained for winter and summer.
Compared to the total BC mass concentrations present at 250 hPa (Fig. 4), the contribution from aircraft is small. Max-imum relative contributions of 2–3% during winter and 1–2% during summer are simulated. The aviation-induced pertur-bations of UTLS BC are clearly smaller than the inter-annual variability of the mass concentration of northern hemispheric UTLS BC originating from the surface (standard deviations of around 0.1–1 ng/m3 in the 10-year BASE simulation). Hence, the simulations reveal that the contribution of avi-ation to the UTLS BC mass budget is of limited impor-tance. This result is similar to the findings of the model study by Kjellstr¨om et al. (1999) for aviation sulfur emis-sions. Kjellstr¨om et al. (1999) demonstrated that the fraction of the UTLS sulfate mass loading resulting from air traffic typical of 1991/1992 probably is very small, even in the most frequented flight regions (<1% north of 40◦N).
Vertical distributions of zonal mean total and aviation-induced BC mass concentration are displayed in Fig. 7. The zonal means of the simulated total BC mass concentrations range from more than 100 ng/m3in the boundary layer at low latitudes and northern midlatitudes to values on the order of 1 ng/m3in the UTLS and the lower and middle troposphere at southern mid- and high latitudes. A distinct seasonal cy-cle of UTLS BC is simulated for the northern midlatitudes showing the largest concentrations during summer when con-vective upward transport from the boundary layer is most ef-ficient. The contribution of BC from aviation is largest at northern midlatitudes where the zonal mean aviation contri-bution ranges from up to 0.1 ng/m3in the lower troposphere to values around 0.01–0.05 ng/m3in the UTLS. The vertical distributions reveal that the relative aircraft-induced BC per-turbation is largest in the UTLS. Despite that mass concentra-tions of BC from aircraft are largest in the lower troposphere, the aviation-induced perturbation is very small compared to the large lower tropospheric BC loading resulting from other sources.
Annual averages of the zonal mean aircraft-induced BC perturbations simulated in the BASE and the NOICE ex-periments are presented in Figs. 8b and d. The BASE
experiment shows distinct differences to the corresponding results of the previous studies by Danilin et al. (1998) and Rahmes et al. (1998)(see also Sect. 1). In the BASE ex-periment, the aviation-induced BC perturbations amount to 0.01–0.05 ng/m3 in the northern hemispheric UTLS. The corresponding BC perturbations derived by Danilin et al. (1998) from aircraft fuel tracer simulations with a previous version of the ECHAM GCM assuming a constant emis-sion index of 0.04 g(BC)/kg(fuel) range between 0.05 and 0.2 ng/m3. The smaller values obtained in the present study are mainly attributed to changes in the BC emission indices as well as to the different representation of BC removal. In the present study, the emissions index decreases from 0.08 g(BC)/kg(fuel) at the surface to values between 0.02 and 0.03 g(BC)/kg(fuel) in the main flight altitudes (Sect. 2.3; Fig. 1). Since the aviation fuel consumption assumed by Danilin et al. (1998) is similar to that assumed here, the dif-ferences in the BC emission indices lead to less efficient UTLS BC emissions in the present study. In contrast to the BASE simulation performed here, removal of trace con-stituents by precipitation was neglected by Danilin et al. (1998) above the 400 hPa level. At these altitudes, precip-itation occurs mainly due to the sedimentation of ice crys-tals. The NOICE simulation demonstrates that neglecting the scavenging of BC by ice above 400 hPa increases the aviation-induced BC perturbation by more than a factor of 2 (Figs. 8b and d).
Hence the adoption of updated emission indices as well as the inclusion of in-situ BC removal by precipitation largely explain the differences in the aviation-induced BC pertur-bations occurring between the BASE experiment and the ECHAM simulation discussed by Danilin et al. (1998). Dif-ferences in the transport characteristics of ECHAM version 3 used by Danilin et al. (1998) and ECHAM version 4 which was employed here appear to be of secondary importance for the dispersion of subsonic aircraft emissions (Rogers et al., 2002).
Nevertheless, the ECHAM results presented in the Danilin et al. (1998) model intercomparison show differences to the results of some other participating models. Since tracer re-moval was handled identically in the models, these discrep-ancies are mainly caused by different tracer transport charac-teristics. The maximum fuel tracer concentrations simulated by Danilin et al. (1998), which were generally obtained in the main flight levels, vary by a factor of 10 between the different model approaches. The largest maximum perturba-tions were simulated by some of the 2-D models. The maxi-mum fuel tracer concentrations which correspond to the air-craft BC concentrations obtained in the 2-D model study by Rahmes et al. (1998) are also in the upper range of the values simulated by Danilin et al. (1998). ECHAM is among the models showing comparatively small concentrations. Never-theless, the differences documented by Danilin et al. (1998) stay within a factor of 2 when the fuel tracer amount is in-tegrated over the northern hemispheric UTLS. The variation
further decreases to less than 1.5 when the results of the 2-D models are not taken into account. This reveals that differ-ences in the models transport characteristics can cause large local differences in the simulated concentrations but that the large-scale features of the simulated aviation fuel tracer dis-tributions are much less sensitive.
It can be concluded that the relative contribution of avi-ation to the UTLS BC budget suggested by the simulavi-ations performed here is only small. The simulated large-scale con-tribution does not exceed a few percent, even in the most frequented flight areas. The absolute aviation-induced BC perturbation simulated here is smaller than suggested by pre-vious studies. This is mainly due to the consideration of up-dated BC emission indices as well as the inclusion of precip-itation scavenging of BC within ice clouds. These modifica-tions reduce the aircraft-induced UTLS BC perturbamodifica-tions ob-tained in the present simulations for the northern hemispheric UTLS by factors of about 2–5. Without these changes, the simulations are consistent with previous simulations (Danilin et al., 1998). The model intercomparison by Danilin et al. (1998) suggests that potential changes in the transport char-acteristics of the model may increase the aircraft-induced perturbations locally but would not cause large changes of the integral effect. The model intercomparison by Rogers et al. (2002) reveals that increasing the vertical resolution of the model would change the results only slightly.
The UTLS concentrations of BC from surface sources sim-ulated by other global models mostly are larger than those obtained here (Sect. 3.2.3). This suggests that the relative impact of aviation on the UTLS BC budget, if simulated with these models, could be even smaller than obtained here. However, such investigations were not performed yet with these models. Only K¨ohler et al. (2001) provided a consis-tent simulation of BC from aviation and surface sources. The relative contributions of aviation to the UTLS BC budget ob-tained by K¨ohler et al. (2001) (generally <1%) are smaller than suggested by the simulations performed in the present study.
The simulations performed here reveal that BC scaveng-ing by ice is of high relevance for the UTLS BC budget. Although measurements by Str¨om and Ohlsson (1998) sug-gest that significant amounts of BC from aircraft are incor-porated into ice crystals and, therefore, can be removed from the UTLS via ice sedimentation, the scavenging efficiency of BC by ice crystals is still uncertain. However, our simu-lations demonstrate that varying the assumptions on the re-moval efficiency of BC by ice sedimentation has a similar effect on the concentrations of BC from aircraft and from surface sources (Fig. 8). Hence, the relative contribution of aviation to the UTLS BC budget simulated here appears to be not very sensitive to the assumptions on BC removal in ice clouds.
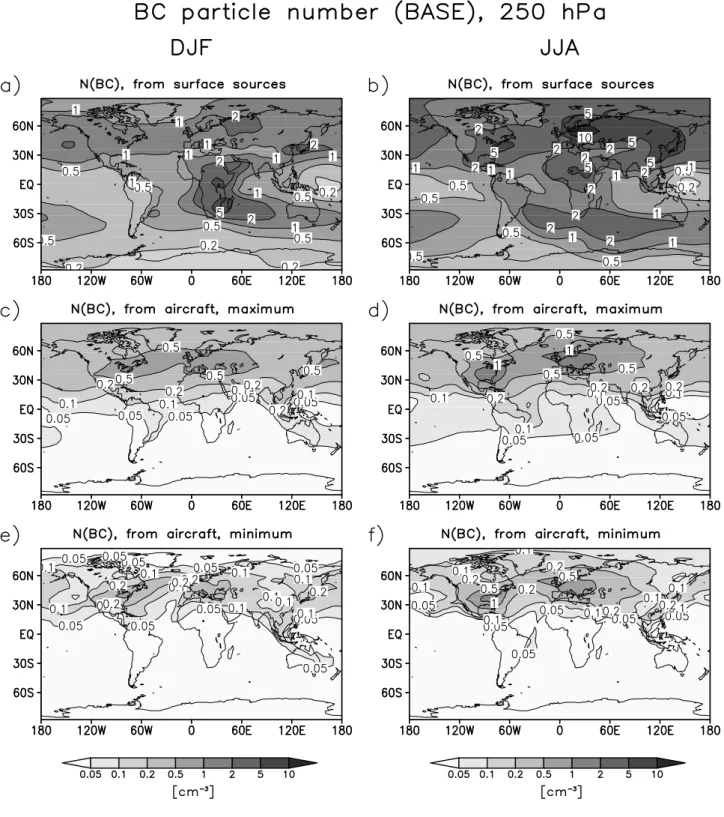
Fig. 9. Particle number concentrations (cm−3) of BC at 250 hPa (main aircraft flight level) during NH winter (left) and summer (right) simulated in the BASE experiment. (a, b): Number concentrations of BC particles resulting from surface sources. (c–f): Number concentra-tions of aviation-induced BC particles obtained when ageing of aviation BC (see Sect. 2.5.3) is neglected (c, d) and when efficient ageing of aviation BC is considered (e, f). The displayed concentrations represent 4-year averages of the December to February and the June to August periods, respectively.
Fig. 10. Relative contribution (%) of BC from aviation to the total BC particle number concentration at 250 hPa (main aircraft flight level)
during NH winter (left) and summer (right) simulated in the BASE experiment. (a, b): Ageing of aviation BC (see Sect. 2.5.3) is neglected.
(c, d): Efficient ageing of aviation BC is considered. The displayed contributions represent 4-year averages of the December to February and
the June to August periods, respectively.
3.2.5 BC particle number concentration
Given the small aircraft-related perturbations of the BC mass concentration simulated here, the question should be ad-dressed whether a larger perturbation of the BC particle num-ber concentration can be expected. Figure 9 highlights the BC particle number concentrations simulated for the 250 hPa level in the BASE experiment for winter and summer condi-tions. The spatial variation in number concentration of BC particles from surface sources (Figs. 9a and b) is very similar to the corresponding variation of total BC mass concentra-tion (Figs. 4a and b). This is due to the constant number-to-mass ratio assumed for BC originating from the surface (Sect. 2.2). The number concentration of surface-related BC particles simulated for 250 hPa typically ranges between 0.2
and 10 cm−3and generally exceeds 1 cm−3at northern mid-latitudes.
Number concentrations of aircraft-induced BC particles simulated for 250 hPa are highlighted in Figs. 9c–f. When the large number-to-mass ratios typical of fresh aircraft ex-haust BC (Sect. 2.3) are generally considered for BC from aircraft, a maximum potential contribution of aviation to the number concentration of UTLS BC particles can be esti-mated (Sect. 2.5.2). As displayed in Figs. 9c and d, these maximum estimated particle number concentrations range between about 0.2 and 1 cm−3at northern midlatitudes and mostly exceed 0.5 cm−3in the most frequented flight regions over North America, the North Atlantic, and Europe.
Relating these maximum estimates for the number con-centration of BC from aviation to the number concon-centrations
Fig. 11. As Fig. 9, but vertical distributions of zonal mean BC particle number concentrations (cm−3) are highlighted. obtained for surface-related BC particles, a maximum
esti-mate for the relative contribution of BC from aviation to the total BC number concentration can be provided. During win-ter (Fig. 10a), the maximum estimated aviation contribution amounts to more than 20% over large parts of the northern hemisphere. The largest contributions range up to 40% and are simulated for the main flight areas. Even during summer (Fig. 10b), when the background BC burden is largest, maxi-mum estimated contributions of 10–30% are obtained for the northern hemisphere. As in the case of the BC mass concen-trations, the perturbations simulated for spring and autumn (not shown) fit smoothly into the seasonal cycle suggested above. In large parts of the most frequented flight areas, the maximum estimated aircraft-induced perturbations are larger
than the inter-annual variability of the number concentra-tion of surface-related BC particles (standard deviaconcentra-tions of around 0.1–1 particles/cm3in the 10-year BASE simulation). Hence, the simulations indicate a high potential of aviation to induce significant increases in the UTLS BC particle num-ber concentration. If BC particles from aircraft can serve as heterogeneous ice nuclei, this might have important implica-tions for the formation of cirrus clouds (e.g. Jensen and Toon, 1997; K¨archer and Lohmann, 2003; Lohmann et al., 2004).
As discussed in Sect. 2.5.3, a minimum estimate of the number concentration of BC from aircraft was performed considering the major ageing processes of BC from aviation and assuming the ageing to be very efficient. The results presented in Figs. 9e, f, 10c, and d reveal that even this
minimum particle number concentration would make a rele-vant contribution to the total UTLS BC particle number con-centration. The minimum estimated aircraft contribution at 250 hPa frequently exceeds 10% in the northern hemisphere and amounts up to 20% in the main frequented flight areas.
Corresponding to the results shown in Fig. 9, vertical dis-tributions of the zonal mean particle number concentration of BC emitted at the surface as well as of BC resulting from aviation are displayed in Fig. 11. As in the case of mass con-centration, the vertical distributions indicate that the relative aircraft-induced perturbation of the BC particle number con-centration is largest in the UTLS. In the lower and middle troposphere, the aviation-induced contribution is small com-pared to the large numbers of BC particles originating from the surface.
In comparing the estimates of number concentrations of BC particles originating from aviation and from surface sources, we recall that a constant number-to-mass ratio is assumed for BC particles originating from the surface. As described in Sect. 2.2, this number-to-mass ratio is derived from the assumption that the surface-related BC particles contain n=10 spherically shaped primary particles on av-erage. The morphologies of BC particles collected in the tropopause region (Blake and Kato, 1995; Pueschel et al., 2000) and the lower stratosphere (Strawa et al., 1999) reveal that much larger agglomerates can reside at these altitudes. Hence, the average n may be larger than assumed. If these large BC particles mainly originate from surface sources, the number concentrations of the surface-related BC parti-cles could be lower than simulated here. Consequently, the relative impact of aviation on the UTLS BC particle number would be larger than estimated above. However, it is not clear whether the BC morphologies supplied by the limited num-ber of measurements are representative of UTLS BC. Fur-thermore, the origin (aviation or surface) of the observed BC particles is not known. Due to a lack of observational data on the UTLS BC particle number concentration, a validation of the simulated BC particle numbers is currently impossible.
4 Conclusions
Simulations with the ECHAM4 GCM were performed to as-sess the global BC budget. The special focus was to quantify the impact of aviation on the global UTLS BC mass and par-ticle number loading. The main findings resulting from these simulations are:
1. The BC mass concentrations simulated for the UTLS typically range between 0.1 and 10 ng/m3 and mostly exceed 1 ng/m3 in the northern midlatitude UTLS. A good agreement with recent observational data on UTLS BC mass loading taken over the North Atlantic and the Arctic Sea (Baumgardner et al., 2003, 2004) was found. The model is capable of reproducing the spatial
variation of UTLS BC concentrations observed at dif-ferent locations of the globe in earlier measurements by Blake and Kato (1995). Nevertheless, the large uncer-tainty of these measurements hampers a detailed evalu-ation of the model quality.
2. The UTLS BC mass loading induced by aircraft typ-ically ranges between 0.01 and 0.1 ng/m3 at northern midlatitudes where the aviation impact is largest. Hence the contribution of aircraft to the total BC mass load-ing simulated here for the UTLS is small. The relative large-scale contribution does not exceed a few percent, even in areas highly frequented by aircraft.
3. The number concentrations of BC particles derived from the UTLS BC mass loading originating from sur-face sources typically range between 0.1 and 10 cm−3 and frequently exceed 1 cm−3at northern midlatitudes. Observational data suitable to perform a validation of the simulated UTLS BC particle number concentrations are urgently required.
4. The simulations suggest that the perturbations in UTLS BC particle number concentrations resulting from air-craft are larger than the corresponding perturbations of the BC mass loading, mainly caused by the small sizes of aircraft-generated BC particles. Large-scale number concentrations of UTLS BC resulting from aircraft of more than 0.5 cm−3are simulated for the main flight ar-eas when BC particle number-to-mass ratios typical of fresh aircraft exhaust are considered. This corresponds to an aviation contribution to the total BC particle num-ber concentration ranging between 10 and 40%. Even when an efficient ageing of the aircraft particle exhaust is taken into account which leads to a reduction of the BC particle number-to-mass ratio, the aviation contri-bution still amounts to 10–20% in the main flight areas. Hence the simulations indicate a large potential of avi-ation to induce significant perturbavi-ations in UTLS BC particle number concentration.
5. Large-scale impacts of aviation on the BC mass and par-ticle number concentrations are very small in the lower troposphere.
In the light of these findings, we evaluate the potential cli-matic impacts of BC emissions from aviation as follows:
Direct climatic impacts: A first estimate of the direct im-pact of BC from aviation on the atmospheric radiation bud-get was provided by IPCC (1999). The direct radiative forc-ing attributed to the aviation-induced BC increase was es-timated to be very small. A global mean forcing of only +0.003 (+0.001 to +0.006) W/m2was calculated considering the emissions of the 1992 fleet. The aviation-induced BC perturbation assumed in these calculations was significantly larger than the BC increase simulated in the present study.


![[PDF] Cours Pascal les structures itératives pdf | formation informatique](data:image/gif;base64,R0lGODlhAQABAIAAAP///wAAACH5BAEAAAAALAAAAAABAAEAAAICRAEAOw==)