HAL Id: hal-00301655
https://hal.archives-ouvertes.fr/hal-00301655
Submitted on 25 Oct 2005
HAL is a multi-disciplinary open access
archive for the deposit and dissemination of
sci-entific research documents, whether they are
pub-lished or not. The documents may come from
teaching and research institutions in France or
abroad, or from public or private research centers.
L’archive ouverte pluridisciplinaire HAL, est
destinée au dépôt et à la diffusion de documents
scientifiques de niveau recherche, publiés ou non,
émanant des établissements d’enseignement et de
recherche français ou étrangers, des laboratoires
publics ou privés.
Seismic detection and characterization of landslides and
other mass movements
E. Suriñach, I. Vilajosana, G. Khazaradze, B. Biescas, G. Furdada, J. M.
Vilaplana
To cite this version:
E. Suriñach, I. Vilajosana, G. Khazaradze, B. Biescas, G. Furdada, et al.. Seismic detection and
characterization of landslides and other mass movements. Natural Hazards and Earth System Science,
Copernicus Publications on behalf of the European Geosciences Union, 2005, 5 (6), pp.791-798.
�hal-00301655�
SRef-ID: 1684-9981/nhess/2005-5-791 European Geosciences Union
© 2005 Author(s). This work is licensed under a Creative Commons License.
and Earth
System Sciences
Seismic detection and characterization of landslides and other mass
movements
E. Suri ˜nach, I. Vilajosana, G. Khazaradze, B. Biescas, G. Furdada, and J. M. Vilaplana
Grup d’Allaus (RISKNAT Research Group), Dept. Geodin`amica i Geof´ısica, Fac. de Geologia, Universitat de Barcelona, Mart´ı i Franqu`es s/n, 08028 Barcelona, Spain
Received: 1 August 2005 – Revised: 28 September 2005 – Accepted: 29 September 2005 – Published: 25 October 2005 Part of Special Issue “Documentation and monitoring of landslides and debris flows for mathematical modelling and design of mitigation measures”
Abstract. Seismic methods used in the study of snow avalanches may be employed to detect and characterize land-slides and other mass movements, using standard spectro-gram/sonogram analysis. For snow avalanches, the spec-trogram for a station that is approached by a sliding mass exhibits a triangular time/frequency signature due to an increase over time in the higher-frequency constituents. Recognition of this characteristic footprint in a spectro-gram suggests a useful metric for identifying other mass-movement events such as landslides. The 1 June 2005 slide at Laguna Beach, California is examined using data obtained from the Caltech/USGS Regional Seismic Network. This event exhibits the same general spectrogram features ob-served in studies of Alpine snow avalanches. We propose that these features are due to the systematic relative increase in high-frequency energy transmitted to a seismometer in the path of a mass slide owing to a reduction of distance from the source signal. This phenomenon is related to the path of the waves whose high frequencies are less attenuated as they traverse shorter source-receiver paths. Entrainment of material in the course of the slide may also contribute to the triangular time/frequency signature as a consequence of the increase in the energy involved in the process; in this case the contribution would be a source effect. By applying this commonly observed characteristic to routine monitoring al-gorithms, along with custom adjustments for local site ef-fects, we seek to contribute to the improvement in automatic detection and monitoring methods of landslides and other mass movements.
Correspondence to: E. Suri˜nach
1 Introduction
Seismic detection in real or quasi-real time of natural events associated with mass movements such as landslides, debris flows, rock falls and snow avalanches can provide timely warnings to people, reducing the associated risk. Detection even in remote, uninhabited areas can be helpful in charac-terizing return periods. Moreover, the seismic characteriza-tion of these phenomena can serve to remove them as “noise” events, masking other potentially important seismic signals such as earthquakes or volcanic and man-made explosions of interest.
In addition to the most common application of seismol-ogy to the discrimination and analysis of assumed station-ary, point-source phenomena such as explosions and earth-quakes, these methods have also been applied to the study of mass movements. Landslide signals recorded by seismome-ters were investigated in the early 20th century; two of the eminent researchers in this area were Galitzin (1915) and Jef-freys (1923). More recent analyses have been carried out by Norris (1994) and Wiechert et al. (1994), on rockfalls and landslides, respectively. Uhira et al. (1994) studied seismic waves excited by pyroclastic flows in erupting volcanoes in an attempt to clarify the source mechanism of seismic waves. Most of these studies have been based on time series obtained with seismometers.
Snow avalanches were first investigated seismologically by Lawrence and Williams (1976). Suri˜nach et al. (2000) demonstrated that seismology can be successful in detecting and determining the characteristics of snow avalanches. Seis-mic sensors have also been used for debris flows (e.g. Arat-tano, 2003; Arattano and Marchi, 2005). Additional sensors such as microphones, hydrophones or accelerometers have also been used in the study of mass movements (e.g. Van Lancker and Chritin, 1991; Hagerty et al., 2000; Itakura et al., 2000; Huang et al., 2004).
792 E. Suri˜nach et al.: Seismic detection and characterization of landslides and other mass movements -2.0 -1.5 -1.0 -0.5 0.0 0.5 1.0 1.5 2.0 x 10 -3 Amplitude (m/s) Time (s) Frequency (Hz) 0 20 40 60 80 100 0 5 10 15 20 25 30 35 40 45 50 -220 -210 -200 -190 -180 -170 (dB) 0 10 20 30 40 50 0 0.5 1 1.5 2 2.5 3 3.5 4 4.5 5x 10 -8 Frequency (Hz) Spectral Amplitude (ms Hz) (a) (b) (c)
Fig. 1. (a) E-W component seismogram (100 sps) of La Sionne
(Switzerland) artificially released dry/mixed avalanche on 20 February 2000, 09:40 UTC recorded at station C (Fig. 4c). (b) Run-ning spectra with a 128-sample window and 50% overlap. (c) Total spectrum of the avalanche signals (excluding the explosion).
In general, the recorded seismic time series of these phe-nomena are complex since the wave field obtained at a point receiver is composed of many phase arrivals. This results from the existence of moving multi-seismogenic sources and from the complexity of the wave propagation in heteroge-neous media and the rugged topography that usually accom-panies the phenomena. Energy attenuation through inter-nal frictiointer-nal losses (anelasticity) and geometrical spreading with distance must also be taken into account.
Although the mass movements stated above are different in nature and have, in general, different characteristics, they can all be regarded as moving seismogenic sources because the material propagation down slope due to gravity produces ground vibration. This vibration can be recorded and sep-arated from the seismic ambient noise if this is sufficiently energetic. It is in this regard that these phenomena are con-sidered in the present paper.
The snow avalanche team of the Universitat de Barcelona (UB) has been studying the characteristics of snow avalanches since 1994, using seismic methods (Sabot et al., 1998; Suri˜nach, 2004). We have studied the seismic signals of avalanches that occurred in the valleys of Bo´ı Ta¨ull and N´uria (Catalan Pyrenees), Vall´ee de La Sionne (Swiss Alps)
and at the test site in Ryggfonn (Norway). Our aim is to con-tribute to a better understanding of the dynamics of avalanche propagation. The detection of snow avalanches is also within our scope.
During our experiments different types of snow avalanches (flow and size) were recorded at several distances. Avalanches were triggered by explosives experts by drop-ping explosives from a helicopter or by detonating them on land. In addition to the seismic signals we also analyzed in-formation obtained simultaneously from video images and field observations including cartography, type of flow and de-posits. These data allowed us to identify general and specific characteristics of the seismic signals of the different types of avalanches in the time and frequency domains. The evolution in time of the frequency content (running spectra or spectro-gram) of the signals provided valuable information on the snow avalanches (Biescas et al., 2003). Similar methods are used routinely to complement the time signal analyses in the seismic monitoring of volcanic areas in order to distinguish the different types of seismic events produced by volcanoes (e.g. Iba˜nez et al., 2000; Del Pezzo, 2003). Spectrograms are also useful as a complement in locating pyroclastic flows (Jolly et al., 2002). Information contained in spectrograms is also included in the design of algorithms of detection and classification of seismic events by means of neural networks (Wang and Teng, 1995; Scarpetta et al., 2005). Neverthe-less, none of the above studies had considered in detail the specific characteristic shapes of the calculated spectrograms associated with various types of mass movements, which is the main subject of our paper. Specifically, we describe the results obtained in our earlier studies of snow avalanches and discuss their applicability to other types of mass movements.
2 Methods and results
Seismic records from avalanches were obtained with differ-ent types of seismometers. All were three-compondiffer-ent geo-phones with eigenfrequencies of 0.2, 1, and 2 Hz, respec-tively and a cut-off of 40 Hz. Data were recorded with different sampling rates (100, 200 and 400 sps). All data were homogenised converting the amplitude of the signals to ground motion (m/s) using the corresponding transfer func-tion of the equipment and then filtered using an order 4 But-terworth band pass filter. Time series, total spectrum (TS) and spectrogram (RS) of all the records were analysed. Fig-ure 1 shows the E-W component of the avalanche signal ob-tained at Vall´ee de la Sionne (site C, Fig. 4c). This was a triggered dry/mixed avalanche that descended a 2500 m long path and reached the recording station at ∼70 s. The time series in Fig. 1a at 7.4 s shows the signal of the explosion that triggered the avalanche. After this signal, at ∼40 s, the increased signal-to-noise ratio allows visual detection of the avalanche arrival. The TS of the portion of the signal corre-sponding to the avalanche is shown in Fig. 1c plotted on a linear scale. In Fig. 1b the RS shows the evolution of the fre-quencies and their partitioning. In our RS representation the
x 10-9 0 10 20 30 40 50 0.0 0.2 0.4 0.6 0.8 1.0 1.2 Frequency (Hz) Time (s) 50 100 150 200 250 300 350 0 5 10 15 -225 -220 -215 -210 -205 -200 -195 -190 -185 (dB) 0 50 100 150 200 250 300 0 5 10 15 20 25 30 35 40 45 50 -215 -210 -205 -200 -195 -190 -185 -180 -175 -170 -165 (dB) Time (s) 0 10 20 30 40 50 0 1 2 3 4 5 6 7 8 9x 10 Frequency (Hz) -8 Time (s) Frequency (Hz) 0 10 20 30 40 50 60 70 0 5 10 15 20 25 30 35 40 45 50 -220 -210 -200 -190 -180 -170 (dB) -1.0 -0.5 0.0 0.5 1.0 x 10⁻³ -1.5 -1.0 -0.5 0.0 0.5 1.0 1.5x 10 -5 -2 -1 0 1 2 x 10⁻⁴ Amplitude (m/s) x 10-8 0 10 20 30 40 50 0.0 0.2 0.4 0.6 0.8 1.0 1.2 1.4 1.6 1.8 Spectral Amplitude (ms Hz) Frequency (Hz) (a) (d) (g) (b) (c) (e) (f) (h) (i)
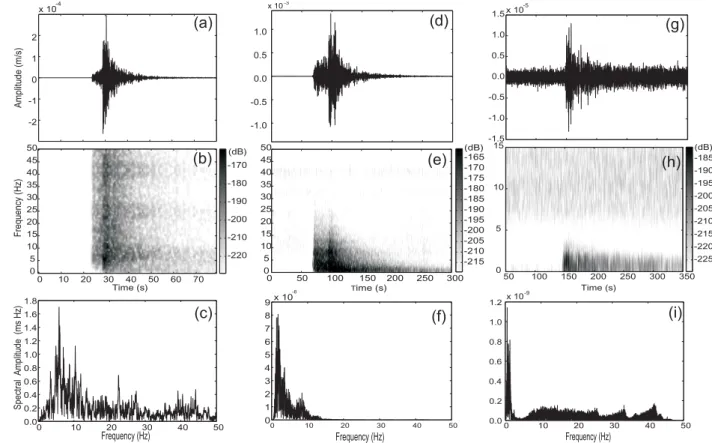
Fig. 2. E-W component seismogram (100 sps) recorded at station C in La Sionne, Switzerland (Fig. 4c). Top: seismograms. Middle:
spectrograms. Bottom: full spectra. (a) Local (52.8 km), ML 2.0 earthquake of 10 April 2002, 13:6:29.2 UTC at Zermat, Switzerland. (b) Regional earthquake (228.2 km), ML 5.1, 11April 2003, 09:26:57.6 UTC in northern Italy. (c) Teleseismic recording (6931.6 km) of ML 6.7 event of 17 April 2003, 00:48:46.8 UTC in Qinghai, China. All running spectra with a 128-sample window and 50% overlap.
spectral amplitudes are given in a grey shade scale; the dark-est colours correspond to the maximum amplitudes in dB. The sharp band of high spectral amplitude at ∼7 s covering all the frequencies corresponds to the explosion. Two bands at ∼18 and ∼35 Hz oscillating in time affect the whole RS. These bands correspond to harmonics associated with the he-licopter flying over the area. The RS facilitates the detection of the onset of the avalanche signal because of the coherent signal behaviour. The gradual increase in frequencies and amplitudes with time is evident at ∼18 s, which indicates a detection of the avalanche that is earlier than in the time se-ries.
One result of our earlier studies that is worth highlighting concerns the running spectra (RS) of the signals produced by snow avalanches. The reproducibility of these was ob-served and discussed by Biescas et al. (2003). One constant characteristic observed in the RS of the studied avalanches is an increase in the high frequency content (and amplitude) of the signal with time when the avalanche approaches the sen-sor, which is responsible for the triangular shape observed in the RS (Fig. 1b). This feature seems to be peculiar to the signals of snow avalanches and is not observed in other nat-ural or artificial seismogenic sources such as helicopters, ex-plosions or earthquakes. For the sake of comparison, Fig. 2 shows the time series (E-W component), RS and total spec-trum (TS) of three different type earthquakes: local, regional
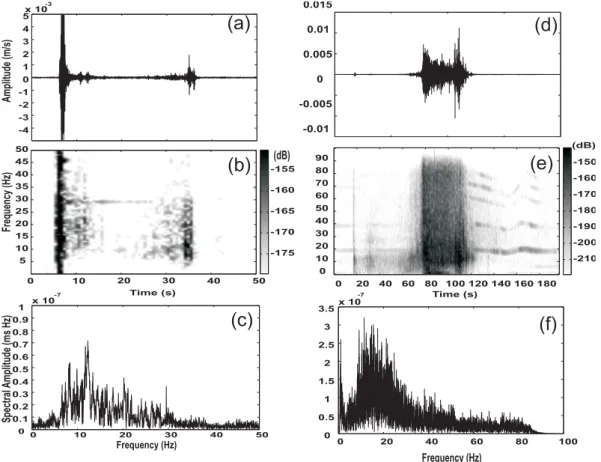
and teleseism that were recorded at the same station at Vall´ee de la Sionne (site C, Fig. 4c) as the avalanche of Fig. 1. Fur-ther characteristics of these earthquakes are given in the cap-tion of Fig. 2. In all these cases, regardless of the frequency range, the shape of the time series and TS functions is simi-lar to those of the avalanches (Figs. 1 and 3). However, the shape of the RS is different. In the RS of earthquakes high spectral amplitudes in all frequencies suddenly appear at the same time (earthquake arrival time), and no triangular shape is observed, indicating that the evolution of frequencies in this case is completely different from avalanches. Likewise, for the explosions (Figs. 1 and 3) the initial shape of the RS does not resemble the triangle. In Fig. 3 the seismic sig-nals of avalanches recorded at two more sites (N´uria, and Ryggfonn) are presented. In both cases the general tendency of the functions is analogous to that of Fig. 1, although the slope of the triangles in the RS and the characteristics of the total spectra are different. Figures 3a–3c correspond to an avalanche recorded at N´uria triggered by explosives. This was a small size dense/wet avalanche that stopped 40 m up slope the seismic station. The length of the path was 150 m. Figures 3d–3f show the signal of a large dry/mixed artifi-cially released avalanche recorded at the Ryggfonn site. This avalanche travelled 2100 m down the path and passed over the sensor at ∼76.
794 E. Suri˜nach et al.: Seismic detection and characterization of landslides and other mass movements -4 -3 -2 -1 0 1 2 3 4 5x 10 -3 Frequency (Hz) (dB) Time (s) 0 10 20 30 40 50 5 10 15 20 25 30 35 40 45 50 -175 -170 -165 -160 -155 Frequency (Hz) 0 10 20 30 40 50 0 0.1 0.2 0.3 0.4 0.5 0.6 0.7 0.8 0.9 1 x 10 -7 Spectral Amplitude (ms Hz) Amplitude (m/s) -0.01 -0.005 0 0.005 0.01 0.015 Time (s) 0 20 40 60 80 100 120 140 160 180 0 10 20 30 40 50 60 70 80 90 -210 -200 -190 -180 -170 -160 -150 (dB) -7 0 20 40 60 80 100 0 0.5 1 1.5 2 2.5 3 3.5x 10 Frequency (Hz)
(a) (d)
(b)
(c)
(e)
(f)
Fig. 3. N´uria and Ryggfonn avalanche signals. Top: seismograms; Middle: spectrograms (RS); Bottom: full spectra (TS). (a) E-W
compo-nent seismogram (100 sps) of the N´uria (Spain) artificially released wet snow avalanche on 1 February 1996. (b) N-S compocompo-nent seismogram (200 sps) of the Ryggfonn site (Norway) artificially released dry-mixed snow avalanche on the 28 February 2004. Running spectra with a 128-sample window and 50% overlap.
In the light of our findings, we can conclude that the trian-gular shape observed in the RS of avalanche seismic signal is a general and independent characteristic of these phenom-ena, regardless of the site and type of flow. This triangular shaped increase in high frequency contents observed in the RS could not be attributed to Doppler Effect (Biescas, 2003). In fact, experimental data and numerical simulations of the seismic wave field caused by moving sources show the trian-gular behaviour of the spectrogram (RS) when the velocity of the moving source approaching the sensor is lower than the wave propagation speed regardless of the scale (Almendros et al., 2002; Anderson et al., 2004; Ketcham et al., 2005). These findings support our proposal that the triangular shape observed in the RS is produced by a moving mass approach-ing the sensor, i.e. the snow avalanche.
Possible explanations for the triangular shape characteris-tics are 1) the anelastic attenuation with distance of the seis-mic waves that propagate in the earth, which is frequency dependent. High frequencies attenuate faster than low fre-quencies (Aki, 1980; Lay and Wallace, 1995); and/or 2) the increase in the energy involved in the avalanche due to the snow entrainment when the avalanche propagates down the path (Gauer and Issler, 2004) resulting in an increase in the amplitude of the signal.
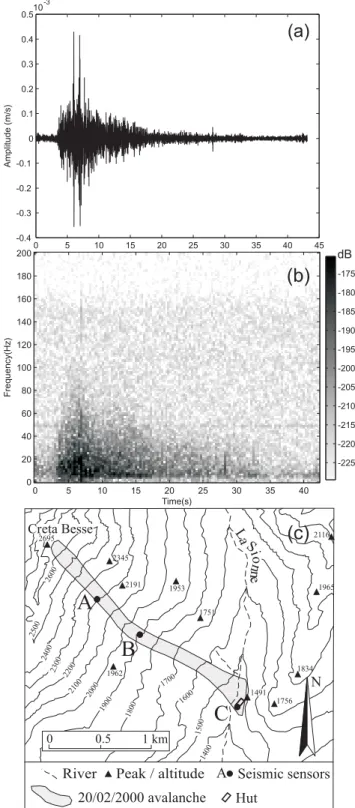
In support of this hypothesis we present a case where the avalanche departs from the sensor. Figure 4 shows the sig-nals corresponding to the same avalanche presented in Fig. 1 but recorded at sensor A (Fig. 4c). The avalanche reaches the sensor at 5–6 s. The increase in frequencies before the avalanche reaches the sensor is abrupt because of the short distance between the releasing zone of the avalanche and the recording site. After 5–6 s the spectrogram shows a decrease in frequencies as the avalanche departs from the sensor caus-ing an inverted triangular shape in the RS. In the same figure, at 12 s, an increase in the amplitudes and frequencies is ob-served, which we attributed to the entrainment of snow. A physical justification of this statement is presented below: a) the amplitude of a seismogram is proportional to the force transmitted into the ground (Aki and Richards (1980), b) for a moving mass this force is proportional to the mass involved and dependent on the angle of the slope (i.e. Brodsky et al., 2003, Eq. 1). Thus, in a first approximation, any mass in-crease in the moving flow is converted into an inin-crease in the net force applied to the ground and, hence, into an increase of the amplitude of the seismogram. This amplitude increase produces a bias of the amplitudes in all frequencies to higher values (i.e. Jolly et al., 2002, Eq. 1), which can be observed in the RS representation. Consequently, the sudden increase
in the amplitudes in all the frequencies observed in the RS in Fig. 4 at approx. 12 s could be attributed to the incorporation of the mass in the flow as observed in the video images.
3 The case of a landslide (Laguna Beach)
In order to confirm our hypothesis that the increase in fre-quencies and amplitudes with time in snow avalanche seis-mic records is related to the mass movement, and that this increase can be observed in other types of mass movements, corroboration by seismic data from such events is necessary. On 1 June 2005, at approx. 06:51 a.m./PDT (13:51 UTC) a significant landslide occurred in the Bluebird Canyon near the town of Laguna Beach in southern California (Tran et al., 2005) (Fig. 5). Considerable landslides have been reported in this area since 1978 (Miller et al., 1979). A 121.405 m2piece of 15 to 18 m deep hillside broke free and slid downwards, destroying dozens of multi-million dollar houses. Since this landslide occurred in an area with a dense state-of-the-art Caltech/USGS Regional Seismic Network (CI), we ex-pected that some of these stations had recorded the seismic signal associated with the landslide. We downloaded seis-mic data from the 10 closest broadband stations of the CI network from the Southern California earthquake data cen-tre (SCEDC, www.data.scec.org) (Fig. 5). We examined a 24-hour section of 3-component, continuous ground motion (m/s) data recorded at 20 sps, and we realised that only sta-tions SDD and LLS, 9 and 23 km respectively from the slide, recorded the signal. However, the SDD signal was barely perceptible. Unfortunately, station STG, close to the event, which could have been of help, seemed to be out of order at the time of the landslide. There were no local earthquakes that could have disturbed our study during the 24 h corre-sponding to our time window.
The instruments at SDD and LSS have an eigenfrequency of 1 Hz and a cut-off frequency of 30 Hz. The time-series, together with their RS of both stations is shown in Fig. 5. We only present the E-W component of the ground motion since the two other components are similar. The initial time in both time series is 12:00 UTC (approx. 2 h before the oc-currence of the landslide). Although, the highest amplitudes in the LLS time series that last approx. 11 h are observed at 14:02:15 (7335 s), first energetic arrivals appear at 13:25:55 (5155 s), which we interpreted as the onset of the landslide (Fig. 5a). The time series from the SDD station exhibits only a small increase in the amplitudes during the landslide and no first arrival can be identified (Fig. 5c). The significantly lower signal-to-noise ratio observed at this station with re-spect to the LLS, was somewhat unexpected, since SDD is located closer to the landslide. This effect could be produced by characteristics of the seismometer, the site and/or the di-rectivity of the wave propagation. To test the significance of these effects, we examined the time series of a local earth-quake recorded at SDD and LSS, which showed a small dif-ference in the amplitudes of the recorded signals. In conse-quence, we suspect that the differences observed in the
land-0 5 10 15 20 25 30 35 40 45 -0.4 -0.3 -0.2 -0.1 0 0.1 0.2 0.3 0.4 0.5 Time(s) Frequency(Hz) 0 5 10 15 20 25 30 35 40 0 20 40 60 80 100 120 140 160 180 200 -225 -220 -215 -210 -205 -200 -195 -190 -185 -180 -175 L a Sio n n e N 1965 1834 1491 1756 1962 1751 1953 2191 2345 2695 2116 14 00 15 00 1600 1700 1800 190 0 200 0 2100 220 0 2300 2400 2500 26 00 Seismic sensors Hut
River Peak / altitude
0 0.5 1 km Creta Besse 20/02/2000 avalanche A
A
B
C
Amplitude (m/s) 10-3 dB(a)
(b)
(c)
Fig. 4. (a) E-W component seimogram (400 sps) of La Sionne
(Switzerland) artificially released dry/mixed avalanche of 20 Febru-ary 2000 09:40 UTC, recorded at station A. (b) Running spectra with a 128-sample window and 50% overlap. (c) Cartography of the avalanche; A, B, C locations of the seismic sensors.
slide records are independent of the stations and are probably caused by other effects (e.g. directivity).
796 E. Suri˜nach et al.: Seismic detection and characterization of landslides and other mass movements Time (s) Frequency (Hz) 4000 6000 8000 10000 12000 14000 16000 0 1 2 3 4 5 6 7 8 9 10 -10 -5 0 5 10 15 20 25 0 1 2 3 4 5 6 7 8 9 x 10⁴ -1 -0.8 -0.6 -0.4 -0.2 0 0.2 0.4 0.6 0.8 1x 10 5 Time (s) Frequency (Hz) 4000 6000 8000 10000 12000 14000 16000 0 1 2 3 4 5 6 7 8 9 10 -170 -165 -160 -155 -1.5 -1 -0.5 0 0.5 1 1.5x 10 -3 0 1 2 3 4 5 6 7 8 9 x 10⁴ Time (s) Amplitude (m/s) Amplitude (m/s) Time (s) (dB) (dB)
(a) (b)
(c) (d) LLS SDD -118.5 -118 -117.5 -117 33 33.5 34 -118.5 -11 -117.5 -117 33 33.5 34 0 510 km CAP GOR BCC PLS SDD STG SRN LLS LGB LTPLaguna Beach Landslide
Fig. 5. Left: Map showing the Laguna Beach landslide (Star) and 10 closest seismic stations of Caltech/USGS Regional seismic network
(CI). Centre: E-W component seismograms (20 sps) recorded at stations (a) LLS (23 km from landslide); (c) SDD (9 km from landslide); (b) and (d) spectrograms (RS) of (a) and (c) respectively with a 128-sample window and 50% overlap.
Time(s) Frequency(Hz) 4000 4500 5000 5500 6000 6500 0 1 2 3 4 5 6 7 8 9 10 -10 -5 0 5 10 15 20 25 (dB)
Fig. 6. Detail of the first part of the Laguna Beach landslide running
spectra of station LLS indicated in Fig. 5b.
Figures 5b and 5d shows the RS corresponding to the in-terval indicated in the time series for both stations. Spec-tra of both time series are limited to 8–9 Hz, although the Nyquist frequency is 10 Hz and data were not filtered. Re-gardless of the scale, the shape of the RS is similar to those of the avalanches. An increase in the frequencies and en-ergy through time also results in a triangular shape. This is more evident at station LLS (Fig. 5b). A detail of the RS in the 5500–6800 s interval is presented in Fig. 6. At approx. (4800 s, 3 Hz) an increase in the amplitudes and frequencies involving all frequencies at 5300 s with a nucleus of high am-plitude centred at (5500 s, 2–4 Hz) is observed. Amam-plitudes
in higher frequencies decrease at ∼6100 s. High amplitude in low frequencies (∼2–4 Hz) still persist. This behaviour is also observed in the RS of the second part of the LLS signal at ∼7800 s (Fig. 5b). At station SDD the triangular shape can also be observed between 6500–8000 s, although it is less clear owing to the compressed scale of time and the low signal-to-noise ratio. We attribute the energy observed from 8000 s with a duration of approx. 11 h to a large move-ment of mass of origin different (plug flow) from that of a turbulent mechanism such as an avalanche or a pyroclastic flow.
4 Discussion and conclusions
The preliminary analysis of the landslide seismic data seems to support our hypothesis that the increase in the frequencies and amplitudes with time in the spectrograms is associated with the mass movements on the surface. Although we com-pared only one landslide to snow avalanches, this is not the only case where similar effects can be observed. For exam-ple, Jolly et al. (2002) present the RS of pyroclastic flows for stations within 1–2 km range at La Soufri`ere Hills Vol-cano (Montserrat), where it is possible to identify a triangular shape. Although, these authors did not specifically focus on this feature, it seems that the directivity effect was present. As in our experiments with snow avalanches, the RS triangu-lar shape is clearer when the flow approaches the recording station. In addition, a typical triangular shape can also be observed in the spectrograms obtained during the laboratory studies of debris flows using hydrophones in a flume (Huang et al., 2004). However, this shape is observed only when the
grain size is large enough to produce sufficient energy to be detected before the flume material arrives at the sensor.
In the light of the examples discussed in this paper, which covers a wide range of distances and energy scales, we con-clude that a characteristic triangular shape appears in the RS representation when the seismic signal of the moving source is recorded at a sensor located in the direction of its prop-agation. This suggests the existence of a general physical mechanism that is responsible for the observed increase in frequency content with time in the RS: the anelastic attenua-tion of frequencies and the mass (i.e. energy) incorporaattenua-tion. Greater distances between source and receiver will produce more low-frequency energy in the spectrogram because of the intrinsic attenuation for high frequency signals. As the source approaches the sensor and the path is shortened, a greater proportion of high frequency energy will be observed as the overall amplitudes increase. Moreover, entrainment of additional material into the moving mass will serve to in-crease overall amplitudes. These factors combine to generate the triangular shape observed in the spectrogram for instru-ments in the path of an approaching mass. Although more work on the influence of site characteristics and other vari-ables is warranted, our findings may prove useful in refin-ing algorithms designed to monitor the occurrence of mass movements.
Acknowledgements. This study is supported by the grants of the Ministry of Education and Science of Spain (MiCYT REN2002-12779-E/RIES and RyC for G. Kh.), the government of Catalonia (RISKNAT PIGC: 2001SGR00081) and the EU (SATSIE EVG1-CT-2002-00059). Field experiments were carried out with the support of Ferrocarrils de la Generalitat de Catalunya, Swiss Federal Institute of Snow and Avalanche Research (SLF) and the Norwegian Geothecnical Institute (NGI). We are indebted to F. Du-four, D. Issler, K. Kristensen, E. Lied, D. Paret, Q. Sabata, F. Sabot and X. Vilajosana for their useful discussions and support in the field. We are also very grateful to C. Rowe for her constructive and helpful comments.
Edited by: M. Arattano Reviewed by: C. Rowe
References
Aki, K.: Attenuation of shear-waves in the lithosphere for frequen-cies from 0.05 to 25 Hz, Phys. Earth Planet. Inter., 21, 50–60, 1980.
Aki, K. and Richards, P. G.: Quantitative Seismology, W. H. Free-man and Company, New York, USA, 557 pp., 1980.
Almendros, J., Chouet, B., and Dawson, P.: Array detection of a moving source, Seismol. Res. Lett., 73, 153–165, 2002. Anderson, T. S., Moran, M. I., Ketcham, S. A., and Lacombe, J.:
Tracked vehicle simulations and seismic wavefield synthesis in seismic sensor systems, Comp. Sci and Eng., 224, 22–28, 2004. Arattano, M.: Monitoring the presence of the debris-flow front and
its velocity through ground vibration detectors, in Debris Flow hazard Mitigation: Mechanics, Prediction and Assesment, edited by Rickenmann and Chen, Millpress, Rotterdam, 2003.
Arattano, M. and Marchi, L.: Measurements of debris flow velocity through cross-correlation of instrumentation data, Nat. Hazards Earth Syst. Sci., 5, 137–142, 2005,
SRef-ID: 1684-9981/nhess/2005-5-137.
Biescas, B.: Aplicaci´on de la sismolog´ıa al estudio y detecci´on de los aludes de nieve, Ph.D. Thesis, Universitat de Barcelona, Barcelona, Spain (ISBN: B. 46927-2003 / 84-688-3758-X), 1– 130 pp., http://www.tdx.cesca.es/TDX-1010103-084042, 2003. Biescas, B., Dufour, F., Furdada, G., Khazaradze, G.,
and Suri˜nach, E.: Frequency content evolution of snow avalanche seismic signals, Surv. Geophys., 24, 447–464, doi:10.1023/B:GEOP.0000006076.38174.31, 2003.
Brodsky, E. E., Gordeev, E., and Kanamori, H.: Landslide basal friction as measured by seismic waves, Geophys. Res. Lett., 30, 2236, 1–5, doi:10.1029/2003GL0184852236, 2003.
Del Pezzo, E., Esposito, A., Giudicipietro, F., Marinaro, M., Mar-tini, M., and Scarpetta, S.: Discrimination of earthquakes and un-derwater explosions using neural networks, Bull. Seismol. Soc. Am., 93, 215–223, 2003.
Galitzin, P. B.: Sur le tremblement de terre du 18 de f´evrier 1911, Comptes Rendus Acad. Sc. de Paris, 160, 810–813, 1915. Gauer, P. and Issler, D.: Possible erosion mechanisms in snow
avalanches, Ann. Glaciol., 38, 384–392, 2004.
Hagerty, M. T., Schwartz, S. Y., Garces, M. A., and Protti, J. M.: Analysis of seismic and acoustic observations at Arenal Volcano, Costa Rica, J. Volcanol. Geo. Res., 101, 27–65, 2000.
Huang, C., Shieh, C., and Yin, H.: Laboratory study of the under-ground sound generated by debris flows, J. Geophys. Res., 109, F01008, doi:10.1029/2003JF000048, 2004.
Iba˜nez, J. M., Del Pezzo, E., Almendros, J., La Rocca, M., Alguacil, G., Ortiz, R., and Garcia, A.: Seismovolcanic signals at Decep-tion Island Volcano, Antarctica; wave field analysis and source modeling, J. Geophys. Res., 105, 13 905–13 931, 2000. Itakura, Y., Fujii, N., and Sawada, T.: Basic characteristics of
ground vibration sensors for the detection of debris flow, Phys. Chem. Earth, 25, 717–720, 2000.
Jeffreys, Sir H.: The Pamir earthquake of 18 February 1911, in re-lation to the depths of earthquake foci, Monthly Notices of the Royal Astr. Soc. Geophys., Supplement 1, 22–31, 1923. Jolly, A. D., Thompson, G., and Norton, G. E.: Locating pyroclastic
flows on Soufri`ere Hills volcano, Montserrat, West Indies, using amplitude signals from high dynamic range instruments, J. Vol-can. Geother. Res., 118, 299–317, 2002.
Ketcham, S. A., Moran, M. L., Lacombe, J., Greenfield, R. J., and Anderson, T. S.: Seismic Source Model for Moving Vehicles, IEEE Trans. Geosci. Remote Sens., 43, 248–256, 2005. Lawrence, W. S. and Williams, T. R.: Seismic signals associated
with avalanches, J. Glaciol., 17, 521–526, 1976.
Lay, T. and Wallace, T. C.: Modern Global Seismology, Academic Press, San Diego, California, 521 pp., 1995.
Miler, Russell V., and Tan, S. S.: Bluebird Canyon landslide of 2 October 1978, Laguna Beach, California, California Geology, 32, 1, 5–7, 1979.
Norris, R. D.: Seismicity of rockfalls and avalanches at three Cas-cade Range volcanoes; implications for seismic detection of haz-ardous mass movements, Bull. Seismol. Soc. Am., 84, 1925– 1939, 1994.
Sabot, F., Naaim, M., Granada, F., Surinach, E., Planet, P., and Fur-dada, G.: Study of the Avalanche Dynamics by means of Seismic Methods, Image Processing Techniques and Numerical Models, Ann. Glaciol., 26, 319–323, 1998.
798 E. Suri˜nach et al.: Seismic detection and characterization of landslides and other mass movements
Scarpetta, S., Giudicepietro, F., Ezin, E. C., Petrosino, S., Del, P. E., Martini, M., and Marinaro, M.: Automatic classification of seis-mic signal at Mt. Vesuvius Volcano, Italy, using neural networks, Bull. Seismol. Soc. Am., 95, 185–196, 2005.
Suri˜nach, E.: Spanish avalanche research: Experimental sites and seismic measurements, in: Snow and Avalanche Test Sites, edited by: Naaim, M. and Naaim-Bouvet, F., Cemagref, 71–183, 2004.
Suri˜nach, E., Sabot, F., Furdada, G., and Vilaplana, J. M.: Study of Seismic Signals of Artificially Released Snow Avalanches for Monitoring Purposes, Phys. Chem. Earth, 25, 721–727, 2000. Suri˜nach, E., Furdada, G., Sabot, F., Biescas, B., and Vilaplana, J.
M.: On the characterization of seismic signals generated by snow avalanches for monitoring purposes, Ann. Glaciol., 32, 268–274, 2001.
Tran, M., Lobdell, W., and Hanley, C.: Laguna Beach Homes De-stroyed in Slide, in: Los Angeles Times, edited, Los Angeles, USA, 2005.
Uhira, K., Yamasato, H., and Takeo, M.: Source mechanism of seis-mic waves excited by pyroclastic flows observed at Unzen Vol-cano, Japan, J. Geophys. Res., 99, 17 757–17 773, 1994. Van Lancker, E. and Chritin, V.: Des avalanches sous bonne
surveil-lance, Neige et avalanches, 96, 10–14, 2001.
Wang, J. and Teng, T. l.: Artificial neural network-based seismic detector, Bull. Seismol. Soc. Am., 85, 308–319, 1995.
Weichert, D., Horner, R. B., and Evans, S. G.: Seismic signatures of landslides; the 1990 Brenda Mine collapse and the 1965 Hope rockslides, Bull. Seismol. Soc. Am., 84, 1523–1532, 1994.