The International Centerfor Research on the Management of Technology
Architecture and Communication Among Product Development
Engineers
Thomas J. Allen
September 1997 WP # 165-97
Sloan WP # 3983
© 1997 Massachusetts Institute of Technology
Sloan School of Management Massachusetts Institute of Technology
38 Memorial Drive, E56-390 Cambridge, MA 02139-4307
Architecture and Communication
Abstract
This paper summarizes some quantitative measures and qualitative observations that we have made regarding the effective of architecture on technical communication. We begin with some early results, showing how the probability that two organizations' members will communicate regularly declines rapidly with the distance between their work locations. . Following this, we assess several objections to these observations and deal with each. We look briefly at the relationships among different media, (i.e., face-to-face, telephone, electronic mail) and how each is affected by separation. Finally, we discuss some examples of architectural strategies for managing communication.
In this paper, we will address a topic that may seem far afield from organizing for research, development and engineering. What could be more remote from the issues of managing a product development organization than a discussion of architecture? Yet with a few moments reflection one quickly realizes that much of what occurs in a matrix or any other form of organization is heavily affected by the location in which people work. Every manager knows that physical proximity is conducive to
communications and relations, between groups and among individuals. Types of Technical Communication.
First, however, we must point out that we must be concerned with several types of technical communication. In some ways this makes the issue of communication more complex, It also complicates the issue of designing an organizational structure
Different forms of organizational structure have very different effects on the several types of technical communication. More important for the present discussion we will also see that the types of communication differ in the degree to which physical separation between communicating parties and architectural considerations affect them.
Technical communication can thus be seen as comprising three distinct types (Table ). The first of these (Type I) exists in nearly all organizations. There has to be
communication to coordinate the work. "The right hand has to know what the left is doing', is a common adage. In engineering, we might say that the parts or subsystems must work together compatibly. The engineers designing those components or
subsystems must therefore remain aware of each other's progress in design. This is what Type I communication is about.
Type II communication is necessary when the knowledge, upon which the organization draws, is dynamic. If knowledge is static, there is no need for this type of
communication. When, however, the knowledge is changing (often dramatically, for product development organizations) there is a need for the staff to keep informed. Type II communication among colleagues plays a major role in keeping the staff up to
date with the state of the art in their specialties.
Finally, where creativity is needed, there is a need for Type ii communication. This is the most unpredictable and most difficult of the three to manage. It is also the most
affected by architecture. Since most of this communication occurs during chance encounters, architecture can strongly promote or impede such occurrences.
Architecture and Communication
Table II
Three Types of Technical Communication
Classification Description
Type I Communication to coordinate the work.
Communication to maintain staff knowledge of new developments in their areas of specialization.
Type III Communication to promote creativity. The Effects of Proximity.
People who work nearby come to know each other better are much more likely to know and understand what each other is doing and consequently can coordinate their work better. In a similar fashion, when the issue is keeping informed of developments inside or outside the organization, physical proximity to those with knowledge of the
developments increases the likelihood of learning of them. So proximity or the distance among work sites affects communication patterns and may support or interfere with the goals of any organizational structure. Managers are generally well aware of this and normally try to map physical locations so that they match the organizational structure. This reinforces the intent of the organizational structure, but as we will see later in this paper, can often lead to less than optimal results.
Reflected in Communication Networks. In our early studies (Allen, 1984) we
devised a technique for mapping organizational communication networks. We had not spent very much time analyzing organizational communication networks before we began to see the effect that the physical location of people had on them. One does not have to look very long at a network such as that in Figure 1, to suspect that something may be interfering with the communication between the two distinct groupings. A little further investigation reveals that the cleavage is not organizational. All of the people
are in the same department. Some even share projects with people in the other cluster. It turns out that one of the clusters is on the second floor of a building and the other one is housed on the fifth floor of the same building. What seems like a modest
separation between people in the same building has, indeed, a profound effect on their interaction patterns. Now, the fact that there are no arrows connecting the two groups does not mean that there is no communication between them. It merely means that any communication that did occur was not sufficiently frequent' to be recognized in the figure.
1Connections are based on communications of at least once a week.
LUCidLIUII MIIU rIlUul Illty Ul Communication.
Situations such as that depicted in Figure 1,
occurred so frequently in our analyses that we decided to see whether we could examine the phenomenon more rigorously and perhaps even quantify the effect.
A -. -- - .__ -I - - . -.. _:- J1
Accoraingly, we oDainea
facilities diagrams from several of the organizations and with map-readers
measured distances between pairs of work stations. Once that was done, we referred to the communication data to
decide which nairs of neole
communicate aout a Figu
technical subject) at least of Physii once a week2. We measured
outward from each
individual's location, using the actual distances that individual would have to walk (Figure 3). Then we counted the number of people whose work stations fell in three meter distance intervals. We then computed, for each three-meter interval, the ratio of the number of people, with whom the focal person communicates, to the total number of engineers and scientists with work stations in that distance interval. If this is done for each individual and then the results are aggregated,
probabilities can be computed for communication within different distance intervals. Plotting these results produces a curve that to no
I. Network for a Single Department Showing the Effects
cal Location.
Figure 2. An Office Layout, Showing the Measurement of Travel Distance Between Work Stations.
2We have examined networks at other frequencies than this, but since once a week seems a
consistent regular level of communication most of the analyses will use this frequency.
_ _ ._ _ _. 1 -I I
r
oI
IOLL
i
I I
II
r
I1ColoAS(
F;~~~-
I -- A -r9~Lr~r~rlk·~I II
i I I - -' -- " 'I-- -- r - F-' . I _ I .-I
I
I
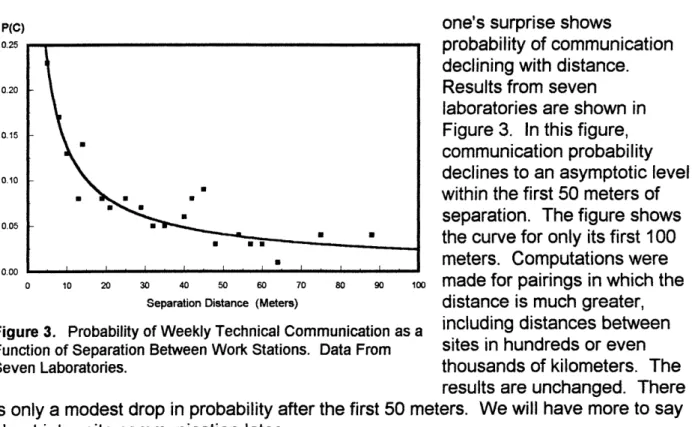
Architecture and Communication P(C) 0.25 0.20 0.15 0.10 0.05 0.00 0 10 20 30 40 50 60 70
Separation Distance (Meters)
Figure 3. Probability of Weekly Technical Commi
Function of Separation Between Work Stations. D; Seven Laboratories.
one's surprise shows
__ .. .E . . _ _ - -: . .. __
prooaility OT communicatlon declining with distance. Results from seven
laboratories are shown in Figure 3. In this figure, communication probability declines to an asymptotic level within the first 50 meters of separation. The figure shows the curve for only its first 100 meters. Computations were
80 90 ,oo made for pairings in which the
distance is much greater, inication as a including distances between
ata From sites in hundreds or even thousands of kilometers. The results are unchanged. There is only a modest drop in probability after the first 50 meters. We will have more to say about inter-site communication later.
Comparison of Results Across Industries and Cultures.
There are distinct differences in communication behavior across disciplines. Chemists, for example (Menzel, 1960), have been shown to read more than most other
disciplines. Perhaps the effect of distance on communication would vary by discipline as well. The studies we have done cannot address this question directly, since we did not segregate respondents by discipline. We can make comparisons across industries, however, assuming a modest correlation between industry and discipline. These
comparisons show very little difference among industries. The regression lines are remarkably similar in all of the organizations we have studied. And the organizations are in a variety of industries.
Perhaps a more likely effect would be that of culture. Certainly people are more accustomed to walking in some cultures than in others (even within the developed world). Americans are notorious, for example, for their avoidance of walking, relying on the automobile for even very short distances. Again we see little difference among the regression lines, at least in Europe and North America. Analyses were performed in the United States, and in several European countries, including Sweden, Germany, Ireland and the U.K.. In fact in a completely independent study (Bertodo,1990) finds a function for a British organization (Figure 4) remarkably similar to that of Figure 3. To the author's knowledge, no comparable studies have been done in Asian countries, but it is probably safe to assume that the results would be similar there.
Physical Location or Organizational Location?
One very possible explanation of the curve in Figure 3 is that it is merely an artifact of the way in which people are located within facilities. As mentioned earlier, managers tend to locate people together, who work together. Such people naturally tend to communicate more with one another than with others with whom they have no work relationship. Ergo, there is a decline in likelihood of technical communication as physical separation increases.
This could very well be the case. If so, it would not be distance or proximity that affects communication probability but strength of working relationship. To test this possibility, we will control for working relationship and then again test for a relationship between separation distance and probability of technical communication. To control for working relationship, we will use the fact that the unit of analysis in Figure 3 is a "pair." This curve is based on measurements made on pairs of people, not individuals. The pair either communicates at a given frequency or does not. The pair is situated with a particular walking distance between them. Pairs can also share or not share many other characteristics (Cf. Tomlin, 1977), for a complete and thorough discussion of the many characteristics shared or not shared by pairs of engineers or scientists and their effect on communication). We will select two of these now and use them as surrogates for working relationships. The first of these is department membership. Relations here are based heavily on the need to keep technically informed. The department is usually the vehicle for keeping engineers and scientists abreast of new knowledge within their fields of specialization. We could expect, on average, relationships among individuals within a department should be stronger than relationships with people in other
departments. There would therefore be a greater need to communicate with fellow department members than with people from other departments.
The second surrogate is
P(C) project team membership.
When two people are members of the same project team that usually means that some form of working relationship exists between them. They must usually coordinate their work. The strength of this
relationship and the need to coordinate will vary across pairs within any project team. The average, however, should
0 20 40 60 80 100 120 be greater for within team Separation Distance (Meters) relationships than for
Figure 4. A Replication of the Relationship [Bertodo, 1990 #15] relationships outside the team.
U. U 0.25 0.20 0.15 0.10 0.05 0nn00
Architecture and Communication
Using the two surrogates as controls, we will first separate all pairs in which both members of the pair belong to the same organizational unit. Using these pairs, we will re-compute the relationship between communication probability and separation
between work stations. Then we will take the remaining pairs (cross-unit) and plot them.
The results for departmental pairs are interesting. (Figure 5) The two plots are quite separate, but similar in shape. The existence of a departmental relationship adds to communication probability by a constant amount, which is independent of distance (Figure 6). When one thinks about it, this should not be too surprising. Common
departmental membership should increase the likelihood of communication without regard to separation distance. It has nothing to do with distance. On the other hand, you are more likely to
communicate with someone in your department, who is also in the next office than with a departmental colleague, who is in the next building.r
sr_;o
4Ae
-0 10 20 30 40 50 60rroec rUela lons[I[ps prouce a
Distance (Meters) similar, but usually stronger,
effect (Figure 4-6). This is due Figure 5. The Effect of Sharing or Not Sharing a Department, to the interdependence of
(Data taken from a single organization). nd e
project activities and the strong need for Tvye technical
communication among team P(C) members. So the strength of
the 'project effect' is a function
of the degree of
interdependence among project subsystems or elements
{P=f(l~)}.
Varghese George, in an interesting unpublished study, examined the 'departmental effect' and found it to be, at least in part, an inverse
function ot department size DISTANCE
{D=f(1/N)}]. His data for D = f(IIN)
departments of size five to 48 Figure 6. The Effect of Shared Departmental Membership on are plotted in Figure 4-7. the Relationship.
0.40 0.30 a a'a c 0.20 o E 0.10 A m 6 . . - - - . - .- .1 - - __ - - - ---I ,.,,.~,..,,,, ~l.l---.~~~~...rr,--,l
P(C) Smaller units are more
. O - wo.s ra eLeroy
_--UUi f,5V, Ild:f lllUI 1[KI oW Uclf
another better and, on average, communicate more. They are often organized around
narrower specialties and
members therefore share more in common, in terms of their specialization. In addition, the author has to speculate that the rate of change of technology (dK/dt) will also have an impact
o 10 20 30 40 5o on the departmental effect.
Size of Group The more rapidly the
Figure 7. Probability of Regular Technical Communication as a knowledge base of a
Function of Departmental Size. department is advancing, the greater the need and
motivation for members to communicate. With a mature, stable technology, there is not as great a need for communication, so sharing departmental membership will not as greatly affect communication probability. With a more dynamic technology, the probability of communication among department members will be greater. Therefore, we can propose that D = f(1/N; dK/dt).
So the probability that a pair of scientists or engineers will engage in frequent technical communication is a function of the degree to which they share a common base of knowledge; the rate at which that knowledge base is developing; the size of their organizational unit; the degree of interdependence in their work and the distance between their work stations. We can say that the probability
of freauent technical
communication among P = f(Iss)
engineers and scientists is Figure 8. The Effects of Shared Departmental or Project
determined by their locations in Membership. physical and organizational
space. 1.00 0.90 0.80 0.70 0.60 0.50 0.40 0.30 0.20 0.10 n m
Architecture and Communication
The Interaction Between Physical and Organizational Location. Now, let us look briefly at the interaction between physical and organizational location. If, for example, we take the curve of intradepartmental communication from Figure 6, and add to this a plot of interdepartmental communication, we should end with something like Figure 9. We know, mathematically, that the curve for interdepartmental communication should fall slightly below the overall curve and probably be closer to it than is the curve for intradepartmental communication. This results from the fact that usually there will be more interdepartmental than intradepartmental pairings.
Let us assume that one pair exists in which the individuals are separated by a distance S1, as shown. These two people are in the same department. So their probability of communication will be p,. Another pair of people is much closer together, being
separated by only a distance of S2, where S2 is much less than S.. They are in different departments so their communication probability is P2. Here, in spite of greater
proximity, P2 is less than p,. This does not tell us anything that we do not know from common sense. People in the same department are, on average, more likely to have a
need to communicate than are people in separate departments. Furthermore, we do not choose communication partners solely from propinquity. Therefore we will walk past the offices of people, with whom we have no need to communicate, to reach the office of the person with whom we want to talk.
Telecommunication.
The thought is probably in the
s3 s2 reader's mind tnat tnese efnects
Distance SI may be all right for face-to-face
communication, for that is what
Figure 9. Combining the Effects of Organizational and Physical we have been considering.
Separation or Proximity. However, is not it for these
reasons that the telephone was invented? It was not. Nevertheless, as distance increases should not the probability of telephone communication increase and thus have telephone substitute for face-to-face communication? That sounds reasonable. What about electronic mail? Will not that function in the same way? That is, in fact, what we expected. What we found is a bit different.
First, as we have suggested, we expected to find the probability of telephone communication would increase with distance, as face-to-face probability decays. When we had engineers report telephone and electronic mail as well as face-to-face
P(C)
p3
p
2p,
communications, we found that, following a 'near field' rise the use of all media
decayed with distance. This should not have surprised us. Many studies have shown a decline in telecommunication with distance. (Mayer, 1993), for instance, cites studies
showing, " ... that between 40 and 50 percent of the telephone calls originating from a household are made within a two-mile radius". (Biksen and Eveland, 1986) similarly show a decline in the use of electronic mail with distance.
One reason for the pattern observed in our data is t
.U z 0r .I W -oJ 0 m o CL Q 0.05 0.02 0.01 0.005 0.002 0.001 0.0005 0.0002 0.0001 0.0 01 0.0002 0.0005 0.001 0.002 0.005 0.01 0.02 PROBABILITY OF FACE-TO-FACE COMMUNICATION
Figure 10. The Relationship Between Telephone and Fac-to-Face Communication Between Locations
hat all of these media, as well as the written medium, are correlated in their use. We communicate with nearly the same people through all of these media. For example, we talk with the same people by telephone, with whom we talk face-to-face. We also send electronic mail messages and written memoranda to the same people. We do not keep
separate sets of people, some of whom we communicate with
.03 by one medium, some by another. The more often we see someone face-to-face, the more likely that we will
telephone that person or communicate by another medium. Evidence for this shown in Figure 10. These
data are from a study in which Oscar Hauptman (Allen and Hauptman, 1989) monitored the communication among the sites of a geographically dispersed computer
manufacturer (Laboratory 'I'). When we relate the probability of face-to-face
communication to that of telephone, we find nearly all of the points are on the diagonal. The probabilities are equal for most pairings of separate sites. The only exceptions are for sites that are near enough to allow more face-to-face contact. Had there been any substitution of telephone for face-to-face, points would have fallen in the upper left quadrant. There are no points in that quadrant.
More important, perhaps, is the fact that telephone and electronic mail (at least in its present form) are, what we might call, 'bandwidth limited'. We mean this in more than just the physical sense. Discussing anything that is complex or abstract by telephone or electronic mail is very difficult. We need to meet directly with the person. We may phone or send an electronic message, but that is usually to arrange the meeting at which the real communication takes place. We call and say, "Will you be in this afternoon? I really have to come over and talk to you about something."
N I N .j ' .. I~-. · *' I ..-.. ,··~~~~~~~~~~~~~~~~~~,o .· dra-, ° U · · I° · I I I I I .
Architecture and Communication
Low Complexity Information
Within a Floor Within a Building Within a Site Between Sites Within a Floor Within a Building Within a Site Between Sites
High Complexity Information
0 20 40 60
Proportion of Contacts
r Face-to-Face
E Telephone
80
Figure 11. Communication Medium as a Function of Information Complexity and Distance.
0 20 40 60
Proportion of Contacts
"] Face-to-Face
E Telephone
80
Figure 12. Communication Medium as a Function of Information Complexity and Distance
The evidence for this comes again from the Hauptman study. When asked to indicate the complexity of each communication, and also the medium, respondents evidenced a strong correlation between the two. Telephone was used for less complex
communication (Figure 11). Face-to-face was used for more complex information (Figure 12). Both observations are largely independent of the distance separating the communicating pair.
The reasons for this are manifold. First, many things, particularly technical ideas and problems, are difficult to communicate verbally. We need the assistance of diagrams or sketches. In addition, we often need the feedback that often comes from looking into the other person's eyes. The eyes communicate understanding. Anyone, who has ever taught a class, will testify to this. When that glazed appearance comes over the students' eyes, you know that you have lost them. Similarly, in describing an idea or technical problem to someone, you can tell whether they are following you. If the indication is negative, you are prompted to restate the information in a different way. This feedback system is invaluable in guiding communication. Telephone
communication normally does not allow this feedback. Even video phones, at least, in the near term, will not probably provide sufficient resolution to give the same amount of information, that is available in a face-to-face encounter. Written communication and the most prevalent forms of electronic mail suffer the additional difficulty that they are
I
i-
:ni
~ . O I j . i r I r i 10asynchronous. Any feedback at all on understanding is delayed in time. Video
conferencing and some new forms of electronic mail allow people to see one another, and this can be a very great help, as is the video phone. None yet provide the very broad band communication available in a direct encounter. Most video conferencing suffers the additional drawback of being restricted to formally scheduled meetings. This is a help mainly for Type I technical communication. Types II and Il are seldom communicated through formal meetings.
The Danger of Managers Generalizing From Their Own Behavior. A serious danger exists in the temptation of managers to generalize from their own experience.
Managers communicate by telephone far more, than engineers or scientists. They tend then to believe that the telephone (or electronic mail) will work as well for the engineers as it does for them. "Why do they need to travel?" What is forgotten is that, on
average, managers deal with less complex information than do the engineers and scientists reporting to them. A much greater proportion of management information than technical information can be communicated by telephone. When we distinguish between managers and engineers or scientists and between telephone and face-to-face communication by plotting separate networks, the managers stand out as telephone users while engineers and scientists communicate face-to-face. When, however, managers face a complex issue, they too recognize the need to meet with the other parties, in the same room.
Implications of the Results, So Far.
Restricting ourselves for now to a consideration only of face-to-face communication of technical knowledge, there are some clear implications that follow from the analysis.
One does not have to search very far to find examples of buildings that seem to have been designed to prevent people interacting. Occasionally, this might not be a bad purpose. However, many of these buildings house organizations in which good technical communication among the staff is highly desirable.
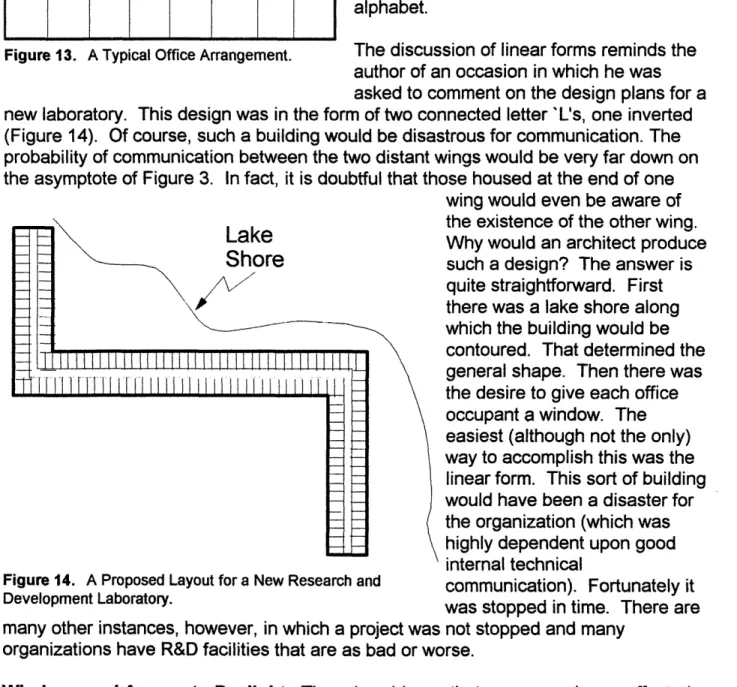
Avoidance of Linear Forms. The first conclusion from the analysis should be the obvious one that when communication is desired among engineers and scientists their work stations should be located in a way that minimizes the travel distance among them. Unfortunately, the traditional and most common form of office layout does just the opposite. There has long been a tradition of stringing offices in a linear fashion along corridors (Figure 13). This, of course, maximizes the average separation distance among the occupants of the offices.
Architecture and Communication
Frequently, this is exaggerated to an even greater and worse degree. Linear forms are combined in various ways, producing
buildings arranged like the letters of the alphabet.
Figure 13. A Typical Office Arrangement. The discussion of linear forms reminds the author of an occasion in which he was asked to comment on the design plans for a new laboratory. This design was in the form of two connected letter 'L's, one inverted (Figure 14). Of course, such a building would be disastrous for communication. The probability of communication between the two distant wings would be very far down on the asymptote of Figure 3. In fact, it is doubtful that those housed at the end of one
Lake
Shore
[1T llIi11 lII 111I 11 I 1 1111 I
i I I I
Figure 14. A Proposed Layout for a New Research and
Development Laboratory.
many other instances, however, in which a project was organizations have R&D facilities that are as bad or wc
wing would even be aware of the existence of the other wing. Why would an architect produce such a design? The answer is quite straightforward. First there was a lake shore along which the building would be
contoured. That determined the general shape. Then there was the desire to give each office
occupant a window. The easiest (although not the only) way to accomplish this was the
linear form. This sort of building would have been a disaster for the organization (which was highly dependent upon good
internal technical
communication). Fortunately it was stopped in time. There are not stopped and many
)rse.
Windows and Access to Daylight. There is evidence that some people are affected in mood and even in effectiveness by artificial light. The degree to which most people are affected is, at least problematic.
The importance of having a window in one's office is probably overestimated. Asked for their preferences, most people will naturally prefer having a window over not having
one. But that has nothing to do with performance. Even those who strongly want access to daylight are probably largely unaffected in their work when that desire
1 I I I I 11i I I II rT I ll HTl l l l l | l l l l l l J_ --·.... ..,.·.·.,.··· 12 I II
r'
" . . . . . Iremains unfulfilled.
Several major, and quite renowned laboratories have no offices with windows. The Watson Laboratories of IBM and the Holmdel Laboratory of the former AT&T Bell Telephone Laboratories are but two examples of this. None of the offices or
laboratories in either of the two buildings is provided with a window. Windows, in both cases, open into public space, corridors or an atrium. We cannot prove that the performance of the organizations housed in these two buildings isn't impaired by this. But since most would agree that these are very high performing organizations, the absence of windowed offices probably has not harmed them too much.
Brill (1981), in an interesting experiment, found that employees' desires for window access decreased as that access was made more difficult. In this experiment, the occupants of a building were asked to indicate how important it was for them to have access to a window in their work space. In the 'before' condition, work stations were arranged in an open floor plan with no partitions. Although, the distance to a window varied by work station, everyone could at least see the windows. In the 'after'
condition, some areas were given partitions of a height that blocked vision only if the occupant were seated. Standing, the occupants could see the windows to about the same degree as was possible in the original open plan. Other areas received higher partitions, which blocked vision even when the work station occupant was standing. Surprisingly, as the windows became visually less accessible, their importance in the eyes of the occupants actually declined (Table II).
There are many objections, which the reader may voice to this study. Brill answered at least some of them by asking the building occupants also to evaluate the importance of being able, "to see outside" (Table II). Since none of them really had a window that they "owned" in either the before or after conditions, windows were not being taken away from them. The ability to see outside was being reduced or made more difficult, however.
Windows can often present a status problem in assigning offices. They are seldom equal in terms of the view they present. The author is reminded of a building with which he is closely acquainted. On one side of the building the windows open on a beautiful river front view, with sailboats in season and an attractive city skyline across the river. The other side of the building fronts on a local gas works. Given these circumstances, to shift an office assignment from the river side to the gas works side can, at the very least, present difficulties.
Architecture and Communication 14 .: . . '.-.. . .'-.' ·... , . . , . . . .
Im ortance of Bein Ablete Outside -:' -- -- " -Proportion : ,',. - Responding as:
Unimportant Indifferent Important
Before Condition 81% 7% 1 1% (no partitions) After Condition #1 59 22 19 (1.5m partitions) After Condition #2 59 15 26 (2.0m Dartitions) From Brill (1981).:
To avoid these status problems, in laboratories such as Watson and Holmdel, private windows were eliminated entirely. The main corridors are on the periphery and are glass-walled. Everyone is therefore equal in the sense that they can step into the corridor and check on the weather or simply be refreshed by the external view.
Locating corridors on the perimeter of the building allows everyone to jointly 'own' them. There are many other examples of this sort. The point to be made is that given a
choice, people will opt for windows, but there is no evidence that the absence of windows in individual offices will detract from performance. Other things equal, giving people what they want is reasonable, although their performance might not be
enhanced. Other things are not always equal, however, and if the desire for daylight access results in linear building forms, there can be an adverse effect on performance. Fortunately, there are more creative ways of bringing daylight into a building. Atria are frequently used for this purpose and from our perspective, these have the additional benefit of allowing visual contact between floors.
Overall Shape of Buildings.
The circle is, of course, the shape that minimizes separation distances in a plane. A more conventional solution would be a square. So to minimize separation, a square, single story building would appear to be the most desirable. We say single story because the evidence from our studies indicates that vertical separation always has a more severe effect than an equivalent amount of horizontal separation. Unfortunately, we cannot quantify the difference. Having a conversion factor to translate vertical into an equivalent amount of horizontal separation would be helpful. Unfortunately, this has proven elusive. Too much depends upon the nature of the vertical connections.
Overcoming Vertical Separation. Wide open, brightly lighted, accessible staircases are very dimly lighted comer stairs with heavy steel fire doors. Regular running, reliable elevators are different from the alternative, and so on. The best way to get people to travel between floors is to provide escalators. Retail stores proved this to be true a long time ago. Escalators proved to the best way to attract customers to upper floors. Escalators are very expensive and are therefore seldom found in office
buildings or laboratories. Retail stores have long believed the expense to be more than offset by the benefits. We would like to be able to give the reader a number that would quantify the effect of escalators, but we cannot. Retail stores are able to do this by comparing sales on floors accessible by escalator with floors that are so accessible. It remains for someone to make the same comparison in a product development
laboratory, in terms of number of contacts among staff. Until such a quantification is performed, we can rely on the evidence presented in Allen (1984) that the benefits of contact among technical staff are great. They are not as easily quantified as are retail sales. Still, they should be sufficient to warrant some investment and escalators in multistory facilities are one investment that would have a high potential benefit.
Escalators in fact do more than merely reduce the barrier to vertical movement. As the department stores learned, they allow browsing along the way. In traveling between the first and fourth floors, for example, the traveler gets to see parts of the second and third floors as well. The department stores capitalize on this and concentrate
attention-getting items near the elevators. This browsing can, in a sense, be extended to the R & D laboratory where "people browsing" is often desirable. Recall the third type of communication noted in Table I. The unanticipated, impromptu encounters often produce the most creative ideas. Open movement between floors with 'people browsing' on the way creates conditions in which this type of communication is more likely to occur.
At some point, however, the mean separation distance among occupants will be greater in a single story building than it is in a two story building of the same floor area.
Attempts have been made to estimate the size that a building would have to reach before this were true (Allen and Fusfeld,1975). There is no single solution, though. Everything depends upon the number and location of the vertical connections stairways and elevators). The cost and availability of real estate will usually be the determining factor dictating the number of floors in a building. We recommend making the building as low as possible within the constraints of land cost, and when additional floors are added, provide many, easily accessible connections between them.
Visual Contact. Visual contact is very important in stimulating communication. While we have no hard data to support the assertion, our qualitative observations lead us to conclude that people need to be prompted occasionally and reminded of the existence of potential technical communication partners. This holds true for all three types of communication. In the first instance, coordination, an engineer might be reminded,
Architecture and Communication
"Oh there's so and so, I had better tell him of the change that I'm going to have to make in my design". In the second instances, knowledge transfer, most large organizations have the problem that their engineers and scientists either don't know or forget about the diversity and quality of the technical talent available within the organization. In our original studies (Allen, 1984) we were often able to locate experts within an
organization in situations in which engineers had gone to lesser authorities outside of their organization for information. The existence of internal expertise is far too often under-publicized and under-utilized. But even when the experts' existence is known, people often have to be reminded. Engineers have a tendency to want to work out problems on their own. If, however, they were occasionally to see those who could help, they might be prompted to seek that help, "Oh, there's so and so, perhaps he could help me on this one." The third, or creativity-stimulating, type of communication is probably the most affected by visual contact. If people do not see one another, they will not have the opportunity for the creativity-inducing contacts.
What does all of this have to do with vertical separation? One of the major barriers to visual contact in a building is the separation of floors. In most buildings, each floor is visually isolated. Consequently there is a tendency for our image of the building to be just that floor on which we happen to be. When we exit the elevator on a given floor of
a building, we rapidly forget about the existence of the other floors. Our mental image of a building is thus limited to a single floor. We need to be reminded of the existence of the other floors. There are a number of ways of doing this, the atrium being one and we will illustrate these through examples of buildings in which visual contact between floors has been enhanced in various ways.
The Effect of Atria. A very effective way of providing visual contact between floors in a building is the atrium. An atrium, particularly one that is centrally located enables people to see across to other floors as well as their own. This reminder of the
existence of the existence of other floors, and of the people housed there, helps to overcome the normal isolation of from one another. Two examples help to illustrate the point
The Decker Building of Corning Glass Works. Corning Glass Works several years ago
constructed a building to house their Manufacturing Engineering organization. The building was going to have to be three stories, due restrictions on land space available at the most desirable site. The architects3, realizing that multi-story buildings present
difficulties for communication, asked the author for advice on overcoming the isolation of separate floors. In response, we recommended first that they make as easy as possible to travel between floors. Open, easily accessible staircases, elevators and, if the budget would permit, escalators are the way to do this. Furthermore, it would be desirable to provide some form of visual contact between floors. The architects
3Davis, Brody and Associates of New York City
responded to this advice in a very creative fashion. They designed a building with an atrium running its entire length. The atrium begins at the
entrance and reception area, narrows and continues at an angle toward the rear and there opens again to contain a dining area on the ground floor (Figure 15).
From almost any point, on any floor, you can see some part of
ne MU1Ier ToIUUIrs. ;O yUU are Figure 16, A view of the Atrium from the Ground Floor of the
Decker Building (Courtesy of Coming Glass Works). . v I "~~~~~~~~
constantly reminded of their existence. Most of the work stations on each floor are of , the office landscape variety,
with a combination of low and high panels. The enclosed offices seen in Figures 15 & 16 have glass walls front and back so they do not obstruct the view through to the atrium. There are curtains which can
hon rWnu-V F #kv frIr hi At thft
;A IJ lJ Ul Wll II 11 VI iIVI y, L.JUL LIIV
Figure 15. Coming's Decker Building, Showing the Atrium norm is to leave these open. Opening as a Triangle in the Front, Continuing Down the Middle of
the Building and Re-opening as a Triangle in the Rear. In addition to the atrium, which provides visual reminders of the other floors there is provision for easy travel between floors. There are elevators toward the front and rear of the building (cylindrical shapes in Figure 15) an open stairway and ramp rising from the reception area and escalators in front and rear. Has all of this been effective? We were unable to sample communication before the organization moved into the building. We did, however, sample after occupancy.
Comparing the probability of regular weekly technical communication between adjacent floors with that computed for two other buildings (without atria) shows a markedly
higher value for the Decker Building (Table ill). Again a word of caution: there are many other differences between the organizations. We have no control over work relationships or any other form of relation which might exist between floors in the three
Architecture and Communication 18 organizations. Nevertheless, a difference of the magnitude of that shown in Table III,
leads one to suspect that the provision of visual contact and easy vertical movement certainly did no harm. There is also some evidence of an anecdotal sort. Occupants report occasions of seeing someone on a different floor and being reminded of something that they wanted to discuss with that person. The author has experienced the effect personally. Upon phoning someone in the building, I was told by a secretary, "He's not in his office right now", followed by "Oh, wait a minute. I see him down there. I'll get his attention." The visual contact does seem to aid communication.
:
-
1
- -" -...
-
-
-
T able III' ": - : : : :: . 'i-...
i . :-.:·::': .':: . . ~: - :.. : . : : .. '.Probabilitty of Regula r Weekly: Technical Communication Between Floorsof a::
...
: :-':::.:::-: ·-:. '.. ' Building::::::: :
Oranization P(C)
Laboratory H : :-- 0.04
Labra 'I' - -0.01
Decker Builing, Comin Gla Wo.rksi;<;i< 4
-Ov~i
The Steelcase Corporate Development Center. Steelcase, a company itself
specializing in office environments, decided in the late 1980s to construct a major new Corporate Development Center to house the principal functional departments involved in innovation. The building was going to be fairly large (more than 60,000 square meters) to house all seven departments4, for which it was intended. The departments had been spread among several buildings located at three sites around a metropolitan area. The purpose of bringing the departments together was to improve
communication among them. With this in mind, the architects5 were charged with the responsibility of designing a building that would promote communication. To do this in a large building which was going to have to be several stories high was a challenge. To reduce the isolation of floors, an atrium was introduced in the center of the building (Figure 4-16)6. The building has a square footprint and the atrium is approximately 21 meters square directly in the center. It begins at the entry floor and continues to the
4Research & Development, Product Engineering, Industrial Design, Manufacturing Engineering, Marketing, Purchasing and Corporate Communications.
5WBDC of Grand Rapids, Michigan.
6The large object in the center of this picture is a kinetic sculpture, in the form of a large
third, at which point it is divided into four triangular atria by a centralized cluster of offices, occupied by the heads of the departments. The atrium provides visual contact
between floors near the center of the building. To provide visual contact between floors, at the perimeter, the
outer walls lean back and form a pyramid (Figure 17). The outer walls are of fritted glass, to reduce solar heating and
glare. A person standing at the perimeter of one floor can thus see floors above and below
(Figure 18) In additional to the visual connection between floors, there are elevators and
escalators for vertical travel..
Figure 18. A View of the Steelcase Atrium (Courtesy of Steelcase, Incorporated).
Figure 17. An External View of the Steelcase Corporate Development Center (CDC). Courtesy of Steelcase, Incorporated.
What has been the effect? In this case, we were able to sample communication before and after occupancy. Some of the buildings, in which the departments were formerly housed, had more than one floor. This provided the opportunity to compute an
empirically derived probability of communication between, just as had been done in the case of the Decker Building. The same was done with the communication data
Architecture and Communication 20
The data show an 85 percent increase in probability of regular weekly communication between adjacent floors (Table IV). Probability of communication between those with a two floor separation exceeds that for those on adjacent floors in the old facilities. The reader should, of
Table IV
Probability of Regular Weekly Technical Communication Before and After
: -:: Occupancy of the Corporate- Development Center (CDC) Number of Floors
Separation Old Buildings: CDC
one 0.026 0.048
two - 0.032
course, be very wary of these numbers. First of all, the people, who are separated by floors in the new building are not the same as those, who had a floor separating them
in the old buildings. The nature of the work relationships that exist between floors differs as well. There are many reasons, besides the building, that could have caused an increase. There are equally many reasons why the resulting probability of
communication is less than it was in the Decker Building. Nevertheless, the data from the two buildings is intriguing and indicates that we can overcome the effects of vertical separation. It is certainly a subject worthy of further study.
Determining Office 'Adjacencies'.
In assigning office space, one of the principal problems to be resolved is that of
adjacencies. Who should be located next to whom? This problem exists at both the group level and the individual
level. Groups are usually situated in a facility on the
basis of communication, but only Type I communication is considered in doing this. The question most generally Figure 19. Visual Contact Between Floors at the Perimeter of asked is, "Which groups work
together most frequently?" In a sense, a matrix is drawn up, although seldom formally or explicitly, relating all pairs of groups on the basis of the degree to which they work together.
What we are going to suggest is that the matrix be made formal and explicit (Table V). The estimate to be made is that of work interdependence, the need for coordination or the need for Type I communication. But we will not necessarily locate those groups (or individuals) who are high on this measure near to one another. A second matrix should be laid out first. In this matrix, the estimate to be made is that of the potential for Type III communication. In other words, if two groups (or individuals) were to communicate, would creative results be expected? This is, of course, a subjective estimate, but management very often does make estimates of this sort. "If we could only get B to talk with D, something might result!" This is usually followed with, "But they work in such different areas, that we can't get them together."
Positioning people or groups such as these, physically near to one another will increase the probability of Type III communication and can potentially produce the hoped-for results. A price must be paid for this, however. The price comes in the form of slightly reduced efficiency for some groups or individuals who have a high need for Type I communication. In order to locate those with a high Type III communication potential near one another, some pairs with a high need for Type I communication will have to be moved farther apart.
Architecture and Communication 22
Table V
. I I t .I .. I. . . -. __ Ad ' II I
- -:A_:-io ning We" .·--iII II~~~~~~~~~~~~~~~~~~~~~~~~~~~~~~~~~~~~I I IIII
':?:~'.. x:.foretemng:ficLjcees:.. -:'a ~ t :A.M -L
1Gro--up -- Group :-- : - -Wor:- Creative
Ir P-
1:
:interdependence : Potential I ___ -__--__B_ HighHigh
':;":"'.""?:--'/"'? . .. .- O. W -. -. .-. : . '.. '':' 8' '·' ` " '''' '""' ' ' ' '' :.: : :-: :. :- ...C..' -·--
-High
High :.. .. :i ow i i : : .~., :~;..;..:: ;:? '-:' :i-'.,.i:. -..'- -.. : - .' .. '.--. .:' .- '.-",:'-: = .- --.'.': ' . - ... D | High Low.
I .'- . I -: IITypes I and II Technical Communication. The reader will recall, however, that it is Type I communication that suffers least as a result of physical separation. The need to coordinate work, brought about by interdependence in the nature of work, will force communication even over substantial distances. Recall the higher curve for those with a project relationship in Figure 8. Since pairs of groups or individuals that are high on this measure will be less affected by physical separation, they can be positioned farther apart if necessary. One the other hand, Type III communication is the most affected by separation, so when that type of communication is desired, pairs must be located very near to one another.
This being the case, the manager should look in Table V, first for pairs for which P is high and lw is low. These pairs must be located near one another because Type III
communication is desired and probably will not occur unless they are close together. The next pairings chosen should be those for which I, and P are both high. Then the pairs with high Iw and low P should be positioned. Finally there are the remainder, for
I T .- . - -... .. ... , - . . . .. . . -: ...-1-..- ··. ;. ·· ·- · · ·
··--I
:,.::I. ._which both Iw and Pc are low. It usually matters very little where these are located relative to one another, since there is little need for them to communicate.
Type II Technical Communication. The analysis thus far has ignored any need for that communication which keeps technical professionals informed of developments in their specialties. In the case of group adjacencies, when groups are often formed around a specialty, this need will be managed through intra-group communication. In such cases, it is not an issue for group adjacencies. This is not the case for
individuals, but it can be factored into the analysis in the same manner as Types I and
III communication. A matrix taking this into account is shown in Table VI. The estimate of the need for Type II communication can be made largely on the basis of how rapidly knowledge is changing in a given specialty or discipline.
The reader will recall that the vulnerability of the three types of communication to physical separation is in reverse order to their numbering. Adjacency decisions should therefore be made on the basis of Type Ill needs first then Types II and I.
Type III communication will not happen unless people 'accidentally' come into contact with one another. What we are doing is managing these "accidents", using physical location of work stations and traffic patterns to increase their likelihood of occurrence in those situations in which we believe there will be a payoff. There is a greater force (the need for current information) driving Type II and so it is less dependent upon accidental encounters. While we should structure adjacencies to promote this type of
communication, it can usually be managed after taking care of Type III. Within Type 11, there is a priority ordering. Adjacencies are more important for those specialties that are changing most rapidly. Where knowledge is changing, a higher frequency of
contact is required in order to stay in touch. So pairings of individuals or groups should be rank ordered on the basis of the rate at which knowledge is changing in their
disciplines or specialties and adjacencies assigned in that order.
Finally there is Type I communication. This is normally used as the basis for
determining adjacencies, and that is perfectly all right in most organizations. But most organizations are different from R&D organizations and have little or no need for communication of Types 11 and Ill. The criterion that in case is efficiency.
Interdependent groups or individuals are located near one another in order to minimize travel time thereby increasing efficiency. In the present analysis, we have introduced a second criterion, effectiveness, and have argued that sometimes that is more important than efficiency. Communication of Types II and III contribute to effectiveness, Type I communication contributes to both efficiency and effectiveness. In order to enhance effectiveness, some of the efficiency associated with Type I communication must sometimes be sacrificed in order to increase the probability of Types II and III
occurring. Highly interdependent pairs of groups or individuals can be situated farther apart if necessary, in order to locate pairs that would benefit from Type II or especially Type III communication. The greater the degree of interdependence, the more this can
Architecture and Communication
be done without loss of effectiveness. The only loss will be in terms of efficiency. This loss of efficiency has been labeled 'functional inconvenience',(Becker, 1990) because it can increase organizational effectiveness by making some things a little more
inconvenient than they might have been. The concept of 'functional inconvenience' also operates in those situations in which we locate conference rooms or laboratories remote from office areas in order to influence travel patterns in a building.
Ta
... le.. *
A ble En - ;-- --: --- -::
--:::-A Matrix for Determining Office --:::-Adjacencies.
..Group ndiiuor :lndividua -Group or Individua . Workdepe' ' Interdepe ndence: Potential for Keeping Creative Potential . (Pc) .' . . ... . :: . .-
Will Proximity Always Overcome Communication Problems?
Up to this point, we have certainly sounded as though physical proximity is the solution to all of any organization's problems. Perhaps, we have not been that extreme, but we have made it appear that proximity would always produce increased communication, and that new well-designed buildings were the answer. That is certainly not always the
IIII I I I I I I I~~~~~~~~~~~~--l - . .. ., · , ,, , , , I I_ I a :Jjil
l
24case, as the following example indicates.
A couple of years ago, the Vice President for Technology of 'Company J' become very concerned over the lack of communication among his organizational sub-units. These were located in several different locations distributed around a metropolitan area. The obvious answer to the problem of poor communication seemed to be to locate all of them together in a single building.
Before he went to his board for approval and budget, however, he felt that he should have more concrete evidence of the problem. He asked whether we would do a communication sampling study. Since we were interested, at the time, in measuring communication in a geographically dispersed organization, we agreed.
The communication sampling confirmed the manager's suspicions. Sub-units within his organization did not communicate well at all. The Netgraph7displayed in Figure 19
shows the situation clearly. Communication within departments is displayed in the square matrices along the diagonal. Communication between departments is shown in the rectangular matrices that are off the diagonal of the Netgraph. In this case the former are well filled and the latter are sparse. Even the technology sub-units, which
had been created to support the more business-oriented sub-units show very little contact with their 'customer' groups. The picture certainly looked appropriate for a new building to house all of the sub-units.
Closer examination reveals that, in some instances, units housed in the same building did not communicate any more than those that were geographically separated (Figure 19). This provoked our curiosity. So we went out to inspect the buildings in which this occurred. We expected to find some physical barriers, integral to the building,
preventing one group from coming into contact with the other. What we found was that the building itself was no impediment. The units were housed in separate ends of the
7A Netgraph is a matrix representation of a communication network as developed by Varghese
George.. Each individual in the network is assigned a row and a column in the matrix. If any pair of people communicate (in the present case, at a minimum frequency of once per week), the cell
connecting that pair is filled in. In this particular Netgraph, the rows and columns are ordered by organizational unit. Therefore the square sub-matrices on the diagonal are the internal communication
matrices for the different departments. The rectangular matrices lying off the diagonal show communication between departments.
Architecture and Communication Det#1 De#2 Dept#3 Dept#4 Dept#6 Dept#6 Dept#7 Oept#8 Dept#9 Dept#10 Dept#11 Dept#12 Dept#13 8g88 8 i 8 8 gr 8 8
Figure 20. A 'Netgraph', Showing the Amount of
Communication Within Each Department (Square Matrices Along the Diagonal) and the Lack of Communication Between Departments (Rectangular Matrices Off the Diagonal), in One Company.
Now what is an entrepreneur like? Well they
building, but it was a single floor and there were no barriers integral to the building. The units, themselves, however, had created their own barriers, each sealing off its own territory with temporary walls and filing cabinets and anything else that could be used for the purpose.
When we presented our observations at a meeting of the sub-unit
managers, there was absolutely no indication of surprise. They had known this all along. It seems the company had, over the years, greatly
encouraed internal
entrepreneurship. They had been very successful at it. They had been able to move into several new market areas with new products as a result of this spirit of entrepreneurship. The sub-unit managers were the
entrepreneurs, who had done this. are nothing if not independents. They want to run their own 'show. The internal entrepreneurs behaved as if they were
running their own businesses, independent of the rest of the rest of the corporation. This may be a good thing in many ways, but it sacrifices the advantage of having the resources of a large corporation behind. Even the supporting advanced technology groups were largely ignored. Each business wanted to develop its own technology. How did the technology respond? They turned themselves into entrepreneurial business units as well. The result of all of this was an assemblage of small
independent 'companies', all largely ignoring the resources and synergy potentially available to them through interaction with the other groups. Would putting all of these units together in a single building, even a well designed one, increase communication among them? That is very doubtful. Proximity will not always result in increased communication.
8See [Roberts, 1991 #18] for a thorough study of entrepreneurs both internal and external and
their characteristics.
REFERENCES
Allen, T.J. (1984). Managing the Flow of Technology: Technology transfer and the Dissemination of Technological Information Within the R&D Organization.
Cambridge, MIT Press.
Allen, T.J. and Alan Fusfeld, (1975). Research laboratory architecture and the structuring of communications. R&D Management, 5(2): 153-163.
Allen, T.J. and Oscar Hauptman, (1989). The influence of communication technologies on organization structure: A conceptual structure for future research. Communication Research, 14(5): 575-587.
Becker, F. (1990). The Total Workplace: Facilities Management and the Elastic Organization. New York, Van Nostrand Reinhold.
Bertodo, R.G., (1990). Evolution of an engineering organization. International Journal of Technology Management, 3(6): 693-710.
.Biksen,J.D. and.Eveland, T.K. (1986). New Office Technology: Planning for People. New York, Pergamon Press.
Brill (1981).
Mayer, W.G., (1993). Trends in media usage. Public Opinion Quarterly, 57(4): 593-611.
Menzel, Herbert (1960) Review of Studies in the Flow of Information
Among Scientists, Columbia University, Bureau of Applied Social
Research
Tomlin, Breffni, (1977). Dyadic Technical Communication in a Geographically Dispersed Research Organization. Sloan School of Management. Cambridge, Massachusetts, Massachusetts Institute of Technology.

![Figure 4. A Replication of the Relationship [Bertodo, 1990 #15] relationships outside the team.](https://thumb-eu.123doks.com/thumbv2/123doknet/14077982.463244/7.933.122.627.781.1062/figure-replication-relationship-bertodo-relationships-outside-team.webp)