HAL Id: hal-00327956
https://hal.archives-ouvertes.fr/hal-00327956
Submitted on 26 Aug 2005HAL is a multi-disciplinary open access
archive for the deposit and dissemination of sci-entific research documents, whether they are pub-lished or not. The documents may come from teaching and research institutions in France or abroad, or from public or private research centers.
L’archive ouverte pluridisciplinaire HAL, est destinée au dépôt et à la diffusion de documents scientifiques de niveau recherche, publiés ou non, émanant des établissements d’enseignement et de recherche français ou étrangers, des laboratoires publics ou privés.
On the observation of mesospheric air inside the arctic
stratospheric polar vortex in early 2003
A. Engel, T. Möbius, H.-P. Haase, H. Bönisch, T. Wetter, U. Schmidt, I.
Levin, T. Reddmann, H. Oelhaf, G. Wetzel, et al.
To cite this version:
A. Engel, T. Möbius, H.-P. Haase, H. Bönisch, T. Wetter, et al.. On the observation of mesospheric air inside the arctic stratospheric polar vortex in early 2003. Atmospheric Chemistry and Physics Discussions, European Geosciences Union, 2005, 5 (4), pp.7457-7496. �hal-00327956�
ACPD
5, 7457–7496, 2005
Mesospheric air in the stratosphere
A. Engel and the balloon teams Title Page Abstract Introduction Conclusions References Tables Figures J I J I Back Close
Full Screen / Esc
Print Version
Interactive Discussion
EGU Atmos. Chem. Phys. Discuss., 5, 7457–7496, 2005
www.atmos-chem-phys.org/acpd/5/7457/ SRef-ID: 1680-7375/acpd/2005-5-7457 European Geosciences Union
Atmospheric Chemistry and Physics Discussions
On the observation of mesospheric air
inside the arctic stratospheric polar
vortex in early 2003
A. Engel1, T. M ¨obius1, H.-P. Haase1,*, H. B ¨onisch1, T. Wetter1, U. Schmidt1, I. Levin2, T. Reddmann3, H. Oelhaf3, G. Wetzel3, K. Grunow4, N. Huret5, and M. Pirre5
1
Institut f ¨ur Atmosph ¨are und Umwelt, J. W. Goethe Universit ¨at Frankfurt, Frankfurt, Germany
2
Institut f ¨ur Umweltphysik, Ruprecht – Karls Universit ¨at Heidelberg, Heidelberg, Germany
3
Institut f ¨ur Meteorologie und Klimaforschung, Forschungszentrum Karlsruhe, Karlsruhe, Germany
4
Institut f ¨ur Meteorologie, Freie Universit ¨at Berlin, Berlin, Germany
5
Laboratoire de Physique et Chimie de l’Environnement, CNRS and Universit ´e d’Orl ´eans, Orl ´eans, France
*
now at: DEKA Bank, Frankfurt, Germany
Received: 18 July 2005 – Accepted: 18 August 2005 – Published: 26 August 2005 Correspondence to: A. Engel ([email protected])
ACPD
5, 7457–7496, 2005
Mesospheric air in the stratosphere
A. Engel and the balloon teams Title Page Abstract Introduction Conclusions References Tables Figures J I J I Back Close
Full Screen / Esc
Print Version
Interactive Discussion
EGU
Abstract
During several balloon flights inside the Arctic polar vortex in early 2003, unusual trace gas distributions were observed, which indicate a strong influence of mesospheric air in the stratosphere. The tuneable diode laser (TDL) instrument SPIRALE (Spectro-scopie InFrarouge par Absorption de Lasers Embarqu ´es) measured unusually high
5
CO values (up to 600 ppb) on 27 January at about 30 km altitude. The cryosampler BONBON sampled air masses with very high molecular Hydrogen, extremely low SF6 and enhanced CO values on 6 March at about 25 km altitude. Finally, the MIPAS (Michelson Interferometer for Passive Atmospheric Sounding) Fourier Transform Infra-Red (FTIR) spectrometer showed NOy values which are significantly higher than NOy*
10
(the NOy derived from a correlation between N2O and NOy under undisturbed condi-tions), on 21 and 22 March in a layer centred at 22 km altitude. Thus, the mesospheric air seems to have been present in a layer descending from about 30 km in late January to 25 km altitude in early March and about 22 km altitude on 20 March. We present corroborating evidence from a model study using the KASIMA (KArlsruhe Simulation
15
model of the Middle Atmosphere) model that also shows a layer of mesospheric air, which descended into the stratosphere in November and early December 2002, before the minor warming which occurred in late December 2002 lead to a descent of upper stratospheric air, cutting of a layer in which mesospheric air is present. This layer then descended inside the vortex over the course of the winter. The same feature is found
20
in trajectory calculations, based on a large number of trajectories started in the vicin-ity of the observations on 6 March. Based on the difference between the mean age derived from SF6 (which has an irreversible mesospheric loss) and from CO2 (whose mesospheric loss is much smaller and reversible) we estimate that the fraction of meso-spheric air in the layer observed on 6 March, must have been somewhere between 35%
25
ACPD
5, 7457–7496, 2005
Mesospheric air in the stratosphere
A. Engel and the balloon teams Title Page Abstract Introduction Conclusions References Tables Figures J I J I Back Close
Full Screen / Esc
Print Version
Interactive Discussion
EGU
1. Introduction
Diabatic descent inside the stratospheric polar wintertime vortices of both hemispheres is a well known phenomenon which can be diagnosed based on tracer observations (e.g. Bauer et al, 1994; Greenblatt et al., 2002; Podolske et al., 1989). This downward transport is part of the large scale Brewer Dobson circulation. Due to the relative
iso-5
lation of the air masses inside the vortices, the descending air masses conserve many of their characteristics. The origin of the air masses descending into the polar vortex is therefore important when determining their chemical properties. Some observations show that air can also descend from the mesosphere into the polar stratospheric vortex (e.g. Fisher et al., 1993; Kouker et al. 1995; Ray et al., 2002; Rinsland et al., 1999),
10
which is supported by modelling studies (e.g. Plumb et al., 2002; Siskind et al., 1997). As mesospheric air has a different chemical composition in comparison to strato-spheric air, it is important to know how much air is descending from the mesosphere into the stratospheric polar vortex for a quantitative understanding of stratospheric chemistry. Due to reactions taking place in the thermosphere and upper mesosphere,
15
mesospheric air is enhanced in reactive nitrogen compounds (e.g. Solomon et al., 1985), which can effect ozone (e.g. Konopka et al., 2005a1, b2). Furthermore, meso-spheric air is enhanced in CO (Lopez-Valverde et al., 1996) and is expected to show enhanced levels of molecular hydrogen and depleted values of water vapour, which may influence the chemistry of OH radicals.
20
Many studies have used changes in correlations between ozone and long lived
trac-1
Konopka, P., Engel, A., Funke, B., M ¨uller, R., Grooß, J. U., G ¨unther, G., Wetter, T., Stiller, G., von Clarmann, T., Glatthor, N., Oelhaf, H., Wetzel, G., Lopez-Puertas, M., Pirre, M., Huret, N., and Riese, M.: Ozone loss driven by nitrogen oxides and triggered by stratospheric warm-ings may outweigh the effect of halogens, Nature, submitted, 2005a.
2
Konopka, P., Gross J. U., M ¨uller, R., G ¨unther, G., Riese, M., v. Clarman, Th., Glatthor, N., Kellmann, S., Stiller, G., Funke, B., and L ´opez-Puertas, M.: Halogen versus NOxinduced ozone loss in the Arctic middle stratosphere during the 2002–2003 winter and spring, in preparation, 2005b.
ACPD
5, 7457–7496, 2005
Mesospheric air in the stratosphere
A. Engel and the balloon teams Title Page Abstract Introduction Conclusions References Tables Figures J I J I Back Close
Full Screen / Esc
Print Version
Interactive Discussion
EGU ers to quantify ozone depletion inside the polar vortex, especially in the distorted
north-ern hemispheric vortex (see, e.g. Proffitt et al., 1990; M¨uller et al., 1997, 2001). These studies assume an initial correlation (usually observed in early winter or late fall, i.e. before the onset of any heterogeneous activation of chlorine compounds) and then evaluate the change in this correlation with time to infer chemical ozone depletion.
5
Plumb et al. (2000) showed that mixing of air masses with different origin can lead to changes in correlations which are caused by dynamics, not by chemistry. If meso-spheric air is transported into the polar vortex in significant amounts, air masses with a very different chemical fingerprint and also a different relationship between ozone and long lived tracers may influence the stratospheric composition. The maximum of the
10
ozone mixing ratio is typically found in the upper stratosphere around 3 hPa, the meso-sphere and upper stratomeso-sphere are characterised by decreasing ozone with altitude, in contrast to the middle stratosphere where ozone increases with altitude. Conse-quently, ozone and long lived tracers like e.g. CH4 or N2O should be correlated in the mesosphere, whereas they are anticorrelated with respect to each other in the lower
15
and middle stratosphere. Any descent of mesospheric air into the stratosphere will consequently lead to a change in the correlation between ozone and long lived tracers. The effect of dynamical processes on the correlation between trace gases has been considered in some studies of ozone depletion (e.g. M ¨uller et al., 2001). Changes in correlations have also been used to study denitrification inside the polar vortices (e.g.
20
Fahey et al., 1990). Kondo et al. (1999) and Wetzel et al. (2002) were able to show that their observed anomalous correlation between N2O and NOyinside the polar vortex in February and March 1997 was indeed mainly caused by dynamical effects.
Downward transport of mesospheric air is, therefore, an important phenomenon which has a significant impact on the chemical composition of the polar stratosphere
25
and is important in studies of ozone depletion as well (e.g. Konopka et al., 2005a1, b2). As mentioned above, CO, H2and NO may be good tracers of mesospheric air for such studies. All of these tracers, however, have a limited lifetime. As shown by Redd-mann et al. (2001) SF6 has a mesospheric sink, which leads to a decrease of SF6
ACPD
5, 7457–7496, 2005
Mesospheric air in the stratosphere
A. Engel and the balloon teams Title Page Abstract Introduction Conclusions References Tables Figures J I J I Back Close
Full Screen / Esc
Print Version
Interactive Discussion
EGU mixing ratios in the mesosphere. SF6and CO2are both used as age tracers in studies
of stratospheric transport. Engel et al. (2002) showed that mean age values derived from both tracers were very similar when the mean age was between 2 and 5 years, whereas there was a slight tendency for SF6 derived mean age to be higher for older air samples. Such differences have indeed been observed inside the polar vortex (Ray
5
et al., 2002; Plumb et al., 2002) and at mid latitudes in an air mass which was charac-terised as a remnant of the polar vortex (Strunk et al., 2000). In both cases the high mean age values derived from SF6were attributed to the presence of mesospheric air. The mean age derived from SF6 observations and its difference from the mean age derived from CO2are, therefore, also an indicator for the contribution of mesospheric
10
air.
Here we present observations of tracers performed during a series of balloon flights launched from the ESRANGE balloon and rocket launch facility near Kiruna, Sweden (67.9◦N, 21.1◦E) in early 2003. All balloons where launched as part of the ENVISAT (ENVIronment SATellite) validation activities. Measurements of different tracers are
15
presented, depending on the observational capabilities of the instruments on board the payloads. The species observed include tracers for which profile observations dis-play specific mesospheric structures. We focus on observations with a balloon-borne cryogenic whole air sampler on 6 March 2003. These observations are used to di-agnose the presence of mesospheric air in the stratosphere which must have been
20
recently transported downward into the stratosphere. The data are interpreted using the KASIMA Model. We show that KASIMA can reproduce the observed differences in SF6and CO2derived mean age, as well as the vertical structure of the age distribution. Trajectory studies using the FUB (Free University of Berlin) Model and heating rates calculated for the actual situation also show the same features. They also show that
25
above the layer of mesospheric air, a large fraction of the polar vortex air is of tropical origin, in agreement with the findings of Konopka et al. (2005a)1. The downward trans-port of mesospheric air is discussed in light of the meteorological situation. Finally we estimate the fraction of mesospheric air present in the stratospheric layer investigated.
ACPD
5, 7457–7496, 2005
Mesospheric air in the stratosphere
A. Engel and the balloon teams Title Page Abstract Introduction Conclusions References Tables Figures J I J I Back Close
Full Screen / Esc
Print Version
Interactive Discussion
EGU
2. Characteristics of mesospheric air
Mesospheric air has quite a different chemical composition compared to stratospheric air. This plays an important role when diagnosing transport and mixing from tracer ob-servations and also has an impact on chemical processes. In general mesospheric air has higher mixing ratios of CO (e.g. Rinsland et al., 1999; Lopez-Valverde et al., 1996),
5
NO (Siskind et al., 1997) and H2(LeTexier et al., 1988) then stratospheric air, whereas water vapour is expected to show reduced levels in comparison to stratospheric air (Kouker et al., 1995). Dissociation and ionisation reactions of molecular nitrogen are the source of NO, whereas CO is produced from the photolysis of CO2. NO and CO have a rather similar chemistry in the mesosphere and lower thermosphere, as noted
10
by Solomon et al. (1985). Both molecules have rather short lifetimes in the sunlit meso-sphere and lower thermomeso-sphere due to reactions with atomic oxygen in the case of CO and photolysis in the case of NO. However, once they are transported into the dark high latitude winter atmosphere, their local lifetime increases, resulting in high mixing ratios in the wintertime mesosphere (Solomon et al., 1985; Siskind et al., 1997). Another
15
tracer which shows significant differences between the stratosphere and the meso-sphere is SF6. While no sink processes for SF6are known in the stratosphere, it can be depleted in the mesosphere due to photolysis and electron attachment processes (see, e.g. Reddmann et al. (2001) for an overview of SF6 chemistry). This process may influence the age determination based on SF6observations. The other age tracer
20
often used in the stratosphere, CO2, also has a sink in the upper atmosphere, where its photolysis is the source of CO. However, once air masses reach the stratosphere and the sunlit atmosphere the sink processes which yield CO should be reversible and CO2 should be re-produced by the reaction of CO with OH radicals. Mesospheric air should thus be recognizable by enhanced values of NO, CO, H2, lower values of water
25
vapour and a difference in the mean age determined from SF6 and CO2, respectively. Of these different indicators of mesospheric influence CO should have the shortest chemical lifetime, as it is expected to return to its typical stratospheric mixing ratios on
ACPD
5, 7457–7496, 2005
Mesospheric air in the stratosphere
A. Engel and the balloon teams Title Page Abstract Introduction Conclusions References Tables Figures J I J I Back Close
Full Screen / Esc
Print Version
Interactive Discussion
EGU the order of about 10 to 20 ppb within a few months. Molecular hydrogen has a
some-what longer chemical lifetime, whereas the difference in SF6- and CO2-derived mean age should be conserved, except for dynamical mixing processes, which should tend to decrease the difference, when mesospheric air is mixed with stratospheric air. NO, another mesospheric tracer, will go into equilibrium with other nitrogen species in the
5
stratosphere. The total amount of NOy should, however, stay enhanced.
3. Observations
During the ENVISAT validation campaign, which was carried out from the ESRANGE Balloon and Rocket launch facility near Kiruna, Sweden (67.87◦N, 21.06◦E), a series of balloon payloads was launched to measure a suite of chemical species. The
mea-10
surements of mesospherically influenced air come from several different instruments. The instruments and the observations are described briefly below (see also Table 1). 3.1. Spirale
SPIRALE is a balloon-borne instrument providing simultaneous in-situ measurements of atmospheric species from the tropopause up to 40 km. SPIRALE uses tuneable
15
laser diodes in the mid-infrared (3 µm to 10 µm). This region has been chosen be-cause molecular line strengths are the highest. The emission part of the instrument is composed of six liquid nitrogen cooled lead salt laser diodes. The six laser beams pass through a 3.5 m multipass Herriott cell located under the gondola. The cell is de-ployed above the tropopause. Eighty six reflections occur, giving a 300 m optical path.
20
Species concentrations are retrieved from direct absorption, by fitting experimental spectra and spectra calculated using HITRAN 2001 database. The technological flight took place in 1999 followed by two flights in 2001 and 2002 at mid-latitudes. The instru-ment provides measureinstru-ments with a vertical resolution of a few meters. The absorption detection limit is close to 10−5. Several species can be detected on the same diode
ACPD
5, 7457–7496, 2005
Mesospheric air in the stratosphere
A. Engel and the balloon teams Title Page Abstract Introduction Conclusions References Tables Figures J I J I Back Close
Full Screen / Esc
Print Version
Interactive Discussion
EGU by a judicious choice of the micro spectra on a specific mode. Relative uncertainties
on concentrations have been evaluated (3% for CH4and N2O, 5% for O3 and CO and depending on altitude, 3 to 20% for NO2, 5 to 20% for HNO3and 7 to 15% for HCl). A detailed description of the instrument and its operating mode can be found in Moreau et al. (2005).
5
The SPIRALE gondola was launched from ESRANGE on 21 January 2003 and reached a ceiling altitude of nearly 32 km. The observations presented were taken during the ascent of the balloon. In the lower part of the N2O profile a lot of structure is observed. Comparison with the two reference profiles shown in Fig. 1 suggests that the observations were partly inside and partly outside of the vortex or in the vortex
10
edge region. This feature is confirmed by PV maps. Between 15 and 19 km altitude SPIRALE sampled outside vortex air as can be seen from the much higher N2O values than those of the reference profile. In this region the N2O values are close to the mid latitude reference profile. Above 20 km altitude there is a sharp decrease in N2O mix-ing ratios and above 22 km altitude the SPIRALE observations fall in the range of the
15
reference profile for inside vortex conditions. The CO vertical distribution shows typi-cal stratospheric values between 25 and 10 ppb in the altitude range between 15 and 27 km. Just above 27 km altitude, a sharp increase in CO mixing ratios is observed, with maximum values above 500 ppb of CO in a layer between 30 and 31 km altitude. As explained above, enhanced CO values are typical of the high latitude winter
meso-20
sphere. E.g. ISAMS measurements in January 1992 showed values up to 4 ppm of CO in the high latitude winter mesosphere (Lopez-Valverde et al., 1996). The elevated CO is, therefore, a clear sign of mesospheric air in the stratosphere.
3.2. Bonbon on TRIPLE
TRIPLE is a multi-instrument payload carrying a cryogenic whole air sampler
(BON-25
BON) (Schmidt et al., 1987; Engel et al., 1997), a Chemical Conversion Resonance fluorescence instrument for the measurement of ClO and BrO (Woyke et al., 1999) and a Lyman-α hygrometer (FISH) (Z ¨oger et al., 1999). The samples collected by
ACPD
5, 7457–7496, 2005
Mesospheric air in the stratosphere
A. Engel and the balloon teams Title Page Abstract Introduction Conclusions References Tables Figures J I J I Back Close
Full Screen / Esc
Print Version
Interactive Discussion
EGU BONBON are analysed for a large suite of trace gases, including the most prominent
CFCs, N2O, CH4, H2, CO, SF6and CO2. Most measurements are given relative to the NOAA/CMDL scale (e.g. Elkins et al., 1993; Conway et al., 1994), with the exception of SF6, which is given on the scale defined by Maiss and Levin (1994) and CO and H2 which are calibrated relative to a standard provided by the Oregon Graduate
Insti-5
tute (OGI) (Khalil and Rasmussen, 1988, 1990). As explained above, H2, CO and SF6 can be used to detect the influence of mesospheric air. The balloon was launched on 6 March 2003 when the polar vortex was well above Kiruna, and reached an altitude of more than 32 km. Figure 2 shows the vertical distribution of N2O, H2, CO and SF6. N2O shows a very steep vertical gradient, with mixing ratios falling below 5 ppb above
10
22 km, indicating that the samples were collected well inside of the polar vortex. Above this altitude there is a slow increase with altitude, with values at the top of the profile reaching between 18 and 19 ppb. CO and H2 show maximum values in a layer at an altitude of about 25 km, i.e. several km above the minimum values of N2O. In the same layer which shows high mixing ratios of CO and H2, a local minimum in SF6is observed,
15
whereas CO2shows no significant structures in this region. Just below the maximum of H2, one sample shows particularly low values of H2. Such values are expected in the upper stratosphere near 50 km altitude, especially in the summer hemisphere, when the photochemical loss of H2 is at it maximum (LeTexier et al., 1988). However, the model used by LeTexier et al. (1988), also predicts a local minimum in H2in the high
20
latitude winter stratosphere (see their Fig. 8).
3.2.1. Mean age of air from SF6and CO2observations
The observations of SF6 and CO2 were used to derive the mean age (Γ) of air in the stratosphere, using tropospheric time series derived from SF6 observations by NOAA/CMDL (Geller et al., 1997, updated) and IUP Heidelberg (Maiss and Levin,
25
1994, updated) and CO2 measurements by NOAA/CMDL (Conway et al., 1994, up-dated). As a first approximation we have calculated the mean age using the formulas given in Volk et al. (1997), which requires a parameterisation of the width of the age
ACPD
5, 7457–7496, 2005
Mesospheric air in the stratosphere
A. Engel and the balloon teams Title Page Abstract Introduction Conclusions References Tables Figures J I J I Back Close
Full Screen / Esc
Print Version
Interactive Discussion
EGU spectrum (∆) to correct for non-linearity in the tropospheric growth rates. We have
used a time period of 15 years before the sampling date for the fit to the tropospheric data. The parameterisation of the width of the age spectrum (∆=0.7*Γ2) was chosen as in Engel et al. (2002), which is based on Hall and Plumb (1994) and also showed most consistent results between our CO2and SF6derived mean age values. In a
sec-5
ond step we have then used the estimated mean age value to explicitly calculate the Greens function describing the age spectrum, again using the same parameterisation for the width of the age spectrum, and integrating it in time, in order to determine the time interval over which one should fit in order to represent 98% of the tropospheric input. We then fitted a second order polynomial to the tropospheric reference data
10
using this time period, which would cover 98% of the tropospheric input. Using this procedure, shorter fit intervals are used for low mean age values, which leads to a better representation of the tropospheric data. As the non-linearity in the tropospheric time series of CO2 and SF6 are rather small, the differences between this procedure and the procedure used in Engel et al. (2002) are less than 0.5 years.
15
As noted above, SF6 can be irreversibly chemically destroyed in the mesosphere. While CO2can also be photolysed in the upper mesosphere, this leads to the formation of CO, which, further down in the atmosphere can be oxidised again to reform CO2. The observed enhanced mixing ratios of CO indicate that this may have happened, yet the effect is small, as the maximum CO value only reaches about 200 ppb, which
20
corresponds to an error in the mean age derived from CO2of less than 2 months. In the absence of loss processes, the age values derived from SF6and CO2are expected to agree within their error bars. Engel et al. (2002) showed that for several observations performed between 1997 and 2000 this was indeed true when mean ages ranged between 2 and 5 years. The mean age profiles obtained using SF6 and CO2 are
25
compared in Fig. 3. There is a large difference in derived mean age around 25 km altitude, with SF6 derived mean age of more than 10 years, in contrast to the CO2 derived mean age, which shows values around 5 years, typical for stratospheric air at these altitudes (see, e.g. Engel et al., 2002). As the measured SF6 must be affected
ACPD
5, 7457–7496, 2005
Mesospheric air in the stratosphere
A. Engel and the balloon teams Title Page Abstract Introduction Conclusions References Tables Figures J I J I Back Close
Full Screen / Esc
Print Version
Interactive Discussion
EGU by chemical breakdown in the mesosphere, this SF6-based result does not represent
a mean age equivalent to mean atmospheric transport times. In the following we will, therefore, call this term the apparent age. Note that the CO2-derived mean age and these SF6-derived apparent age values also show differences above and below this level, indicating that air masses above and below the layer at 25 km also have partly
5
mesospheric characteristics. 3.3. MIPAS-B
MIPAS-B is an advanced cryogenic FTIR spectrometer specially tailored to the oper-ation on a stratospheric balloon gondola (Friedl-Vallon et al., 2004). Equipped with suitable subsystems, MIPAS-B allows precise limb emission sounding of IR active
at-10
mospheric constituents. Vertical profiles of ozone and a considerable number of key radicals and reservoir species of the nitrogen, hydrogen, and chlorine families as well as source gases can be obtained simultaneously with an altitude resolution of 2 to 3 km. As an emission sounder, MIPAS-B is independent of any extraterrestrial light source. Careful instrument characterisation is performed for the instrumental line shape (ILS),
15
field of view (FOV), line of sight (LOS), and radiometric calibration. Retrievals of trace gas profiles are performed with a non-linear least squares fitting procedure (H ¨opfner et al., 2002). The error estimation includes random noise as well as the mutual influence of the fitted parameters, temperature errors, LOS inaccuracies, and spectroscopic data errors. The precision of retrieved profiles is typically 3–7% and the accuracy reaches
20
7–15 % (see, e.g. Wetzel et al., 2002).
The MIPAS-B instrument was launched on 20 March 2003 from Kiruna. The balloon reached a ceiling altitude of 31 km. Several series of limb scans were performed. The instrument can be adjusted in order to observe in a specified direction. Here we present results of a limb scan measured during the night (around 22:00 UT) when the
25
instruments field of view was directed into the vortex. Figure 4 compares the N2O observations of MIPAS-B with our reference profiles. Over the entire altitude range there is a remarkable agreement. As with the in-situ observations from the cryogenic
ACPD
5, 7457–7496, 2005
Mesospheric air in the stratosphere
A. Engel and the balloon teams Title Page Abstract Introduction Conclusions References Tables Figures J I J I Back Close
Full Screen / Esc
Print Version
Interactive Discussion
EGU whole air sampler, the lowest values of N2O are not observed at the top of the profile
but rather around 22 to 23 km altitude.
4. Model calculations and meteorological situation
In order to investigate when the mesospheric air was transported into the stratosphere, we performed model calculations using the KASIMA model and trajectory calculations
5
with the FUB model. In particular, we will use the apparent age derived from modelled and measured SF6as a tracer of mesospheric air for the comparison.
4.1. Model calculations and comparison with data
The model experiments were made with the KASIMA model environment. A multi-annual run in a similar manner as described in Reddmann et al. (2001) was started
10
in model year 1989. As meteorological input the ERA40 re-analysis and subsequent operational analyses were used up to 1 Pa, using only the ECMWF temperature as a tendency term (see Kouker et al., 1999). Resolution was T21 in the horizontal cor-responding to about 5 deg in spherical coordinates, and 750 m in the vertical from 10 up to 25 km. Above 25 km levels increase to about 3 km at 120 km pressure altitude,
15
which is the top level of the model. From the eight different chemical tracers described in Reddmann et al. (2001), the tracer with the longest chemical lifetime, which includes all known back reactions, was used to initialize a short-term transport experiment with a horizontal resolution of T63 (equivalent to about 2 deg) and a vertical resolution of 250 m up to 30 km. The date of initialization was chosen to the day of the year (DOY)
20
340 in 2002. This tracer was transported as a completely inert tracer until March 2003. Note, that the calculation of the tracer distribution in the model results from a 10 year run, where the model is about at equilibrium conditions.
ACPD
5, 7457–7496, 2005
Mesospheric air in the stratosphere
A. Engel and the balloon teams Title Page Abstract Introduction Conclusions References Tables Figures J I J I Back Close
Full Screen / Esc
Print Version
Interactive Discussion
EGU 4.2. Model comparison for 6 March 2003
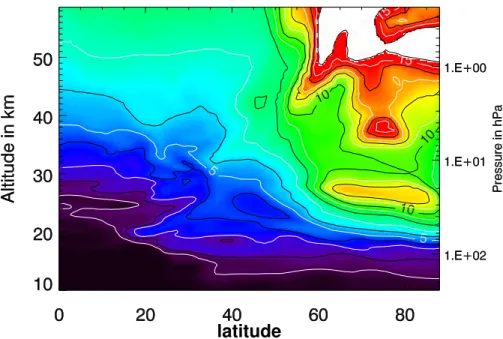
Figure 5 shows a meridional vertical cross section of the apparent mean age calcula-tion from the modelled SF6 with the formulas of Volk et al. (1997), which account for non-linearity on the tropospheric growth rate of SF6, along 20◦E for 6 March 2003, the day of the observation with the cryogenic whole air sampler. Apparent age values
5
above seven years are rated to be unrealistic and reflect the impact of mesospheric breakdown of SF6. The model shows the same layered structure in apparent age val-ues as the observations on that day. In the observations, the apparent age peak is situated a little lower (around 25 km altitude) than in the model (maximum at around 27 km). This may, however, be due to the snapshot nature of the observations, which
10
may not have caught the maximum values of apparent age present in the atmosphere. The apparent age values from the model (maximum of between 12 and 13 years) are a little higher than the observations (maximum about 11 years). This may be due either to the large uncertainties in the mesospheric chemistry of SF6or to the integration which occurs during the collection of the samples. As in the observations, the effect of
meso-15
spheric air in the model calculations is not limited to one layer, but is also observed above and below this layer which shows the maximum impact. The model also shows, that air with very strong mesospheric influence should have been present above 35 km altitude. This is, however, above the observation altitude of the cryosampler for that day.
20
4.3. Temporal development of the mesospheric air intrusion
From the observations of the SPIRALE instrument it is clear that mesospheric air was present in the stratosphere already in late January 2003. The SPIRALE observations also indicate a layered structure, as observed in the cryosampler and MIPAS-B results. It is thus likely that the observed mesospheric air was transported into the stratosphere
25
already early during the winter. Figure 6 shows the vertical cross sections of the zonal mean of the apparent age derived from the KASIMA cacluations for the DOY 300–360
ACPD
5, 7457–7496, 2005
Mesospheric air in the stratosphere
A. Engel and the balloon teams Title Page Abstract Introduction Conclusions References Tables Figures J I J I Back Close
Full Screen / Esc
Print Version
Interactive Discussion
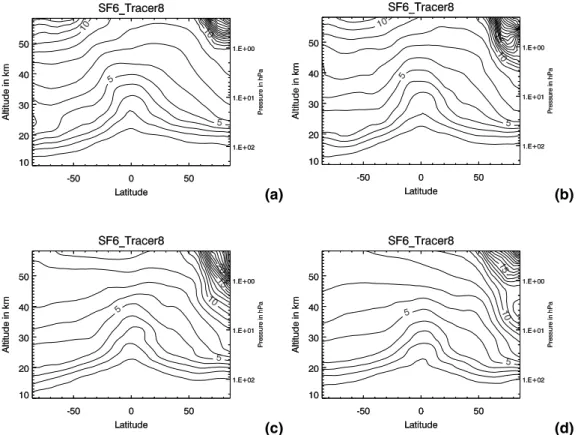
EGU in 2002. Descent of high apparent age values is observed already around November.
While an apparent age level of 10 years is observed only around 50 km altitude on day 300 (27 October), it has descended to around 42 km on day 320 (16 November) and to 35 km on day 340 (6 December). On day 360 (26 December) the model shows apparent age values of 10 years as low as 32 km. At this time, however, there is a
5
layer between about 40 and 50 km altitude, which shows lower, i.e. rather stratospheric values of apparent age, and which separate the regions influenced by mesospheric air above and below. This shows that air masses with more stratospheric character must have been transported polewards at this altitude level sometime during the second half of December.
10
The high resolution version of the model then conserves the layered structure which was produced in December 2002 during January, February and March 2003, while it is slowly being transported downwards by the descent inside of the vortex. By March 2003 (Fig. 5), the layer of mesospheric air in the model is transported down and is centered around 27 km altitude, with peak values of apparent age exceeding 10 years,
15
as was observed by the cryogenic whole air sampler. 4.4. Trajectory calculations with the FUB model
Long term trajectory calculations were made with the FUB trajectory model (Reimer and Scherer, 1992). In the version used in this study, the model uses the ECMWF op-erational analyses as meteorological input up to 1 hPa. The ECMWF data are
interpo-20
lated horizontally to a 1.25◦×1.25◦latitude/longitude grid and vertically to 25 isentropic levels which extend from the surface up to 1600 K. To consider diabatic processes, heating rates derived from the radiative transfer scheme of the SLIMCAT 3-D chemical transport model (Chipperfield, 1999) are applied.
An ensemble of trajectories was initialised on 6 March 2003 (12:00 UT) within a
25
grid around Kiruna (latitude: 66.25◦N–68.75◦N, longitude: 20.0◦E–22.5◦E) at different potential temperature (Θ) levels between 475 K and 840 K (∼20–30 km). One kilometre (∆Θ: 25–50 K) was chosen as altitude distance between two Θ-levels. In the altitude
ACPD
5, 7457–7496, 2005
Mesospheric air in the stratosphere
A. Engel and the balloon teams Title Page Abstract Introduction Conclusions References Tables Figures J I J I Back Close
Full Screen / Esc
Print Version
Interactive Discussion
EGU range between 24 and 27 km, where the TRIPLE measurement showed unusual trace
gas concentrations, the altitude distance was scaled down to 15 K (∼0.3 km). Starting on 6 March 2003, the trajectories were calculated backward up to 1 November 2002 and forward up to 30 March 2003.
Figure 7 shows time series of the mean and the standard deviations of the potential
5
temperature of the calculated trajectories (not all levels are shown, in order not to overload the plot). The trajectories, which were initialised on 6 March at levels below 640 K (∼25.2 km, yellow line in Fig. 7), stay in the stratosphere over the whole winter. The trajectories initialised at 665 K (∼25.8 km, red line in Fig. 7) enter the stratosphere on average around end of November. At the levels above the standard deviation is
10
very high. This indicates high variations in the origin and the transport path of the air masses. Figure 8 confirms the different origin of the air masses at the upper levels, arriving in the area around Kiruna on 6 March. Most trajectories of the levels initialised from 710 K to 840 K (∼26.9–29.9 km) descended from the mesosphere, but there is also a large amount of air masses coming from tropical regions. The mesospheric
15
part of these air masses descend into the stratosphere between end of December and mid of January. The trajectories initialised at 665 K (∼25.8 km) show nearly no tropical origin, but a high mesospheric percentage entering the stratosphere between November and beginning of December. Due to the absence of tropical air, the mean age of air at this layer is expected to be higher in these air masses than in the levels
20
above and below (see Sect. Discussion). This layer of mesospheric air persists over the time and descends downward within the polar vortex.
The trajectory calculations can only give a qualitative view of the observed features. Mixing processes cannot be depicted with this kind of investigation. Merely, the main transport phenomena and the main temporal development can be described. As no
25
mixing occurs in these calculations, it is expected that the absolute amount of the meso-spheric fraction is overestimated in the peak, whereas it may be underestimated in the other regions. The results of the trajectory calculation fit very well the mesospheric layers observed by SPIRALE on 27 January and by TRIPLE on 6 March (Fig. 7). At the
ACPD
5, 7457–7496, 2005
Mesospheric air in the stratosphere
A. Engel and the balloon teams Title Page Abstract Introduction Conclusions References Tables Figures J I J I Back Close
Full Screen / Esc
Print Version
Interactive Discussion
EGU end of March the mesospheric layer within the stratosphere derived from the trajectory
calculation is located around 24 km, a little bit higher than measured by the MIPAS instrument.
4.5. Meteorological situation in early winter 2002/2003
The model calculations show a downward transport of mesospheric air from November
5
to mid December 2002. In the second half of December 2002, it seems that the de-scending air masses were of more stratospheric character. During the second half of December the first minor warming occurred in the Arctic upper stratosphere (Naujokat and Grunow, 2003). The development of the polar vortex started in October 2002. Already in late October 2002 high PV values were found in the lower mesosphere
10
(0.1 hPa, 60–65 km). At this time the vortex in the middle and lower stratosphere (100– 10 hPa, 15–30 km) was still quite weak. The PV values in the lower stratosphere then increased continuously until mid December. During this period the vortex in the middle stratosphere stayed near the pole or slightly shifted toward the European Arctic for most of the time. A wave 1 like pattern evolved with a warm centre over the Siberian
Arc-15
tic, which increased in amplitude with time, until it reached about 30–50 K amplitude at levels between 10 and 100 hPa (15–30 km) in mid December. During November the upper stratosphere to lower mesosphere also showed a wave 1 like pattern with increasing amplitude. In mid December, the temperature fluctuations of up to 70 K were observed at the 1 and 0.1 hPa levels (about 44–47 and 60–65 km altitude ranges)
20
and the whole upper stratosphere had warmed considerably. At 1 hPa a continuous increase of the temperatures above the pole by about 40 K was observed from the be-ginning of November until mid December (see Fig. 9), leading to a positive temperature gradient between 60◦N and the pole by late November/early December. Such an in-crease in temperature is not observed at the 10 and 30 hPa levels. By 26 December
25
the wave 1 pattern in the upper stratosphere (1 hPa) lead to temperature fluctuations of up to 100 K, while the lower mesosphere (0.1 hPa) was much less perturbed. This lead to a sharp increase in the temperature above the pole at 1 hPa (Fig. 9). At the same
ACPD
5, 7457–7496, 2005
Mesospheric air in the stratosphere
A. Engel and the balloon teams Title Page Abstract Introduction Conclusions References Tables Figures J I J I Back Close
Full Screen / Esc
Print Version
Interactive Discussion
EGU time the zonal mean zonal wind at 60◦N (Fig. 10) changed from westerlies to near zero
winds at 1 hPa, even being in an easterly direction for a few days in late December 2002. This early warming propagated downwards to the 10 hPa level. The vortex was considerably weakened in late December down to about 10 hPa (30 km), while levels below were hardly affected (see temperature development at 30 hPa, Fig. 9). While
5
the temperature gradient between the pole and the zonal mean at 60◦N was reversed at 10 hPa in late December, the zonal mean zonal wind at 60◦N remained westerly. This warming can thus be classified as a minor warming, as the reversal of the wind gradient was only observed at the 1 hPa level but did not reach the 10 hPa level. The zonal mean zonal wind at 60◦N stayed very close to the 30 year mean at the 30 hPa
10
level during November and December (Fig. 10).
5. Discussion
5.1. Downward propagation of mesospheric air
The measurements presented above show that air masses with mesospheric char-acteristics were present in the stratospheric polar vortex during early 2003 (January
15
to March period). As mesospheric signatures were observed during several balloon flights (each only representing a snapshot of the stratospheric conditions) it is con-cluded that this must have been a rather wide spread feature. The first evidence of mesospheric air was observed on 21 January at an altitude of about 30 km by the SPI-RALE instrument, showing CO mixing ratios as high as 600 ppb. All later observations
20
were performed in March 2003. On 6 March apparent age values of up to 11 years were derived from the samples collected by the cryogenic whole air sampler BONBON in a layer centred around 25 km. In the same samples enhanced values of H2(840 ppb) and CO (200 ppb) corroborate signatures of mesospheric air. The lower amounts of CO compared to 21 January can be explained by a combination of dilution of the
meso-25
ACPD
5, 7457–7496, 2005
Mesospheric air in the stratosphere
A. Engel and the balloon teams Title Page Abstract Introduction Conclusions References Tables Figures J I J I Back Close
Full Screen / Esc
Print Version
Interactive Discussion
EGU OH radicals. However, as the different instruments most probably did not probe the
same air mass, such a comparison can only be of qualitative nature. During the night of 20 March to 21 March the MIPAS Balloon FTIR spectrometer observed a layer in which the sum of the measured reactive nitrogen species (i.e. HNO3, ClONO2, 2 N2O5, HO2NO2, NO2and NO) is higher than the available reactive Nitrogen calculated from
5
the N2O observations. This layer was centered at about 22 km altitude. Especially the MIPAS and the BONBON observations show the same layered structure as the model calculations. The observations give a consistent picture of a layer of mesospheric air which is transported downwards in the stratosphere, in the same time being diluted with air of stratospheric origin.
10
5.2. Comparison with model calculations and meteorological situation
Apparent age calculated from modelled SF6 is used as a mesospheric tracer in the KASIMA model. KASIMA is able to reproduce the layered structure observed on 6 March 2003. KASIMA also produces the right order of magnitude in apparent age and the correct altitude range of the mesospherically influenced layer. There is thus
15
good agreement between model and observations for this case. The KASIMA calcu-lations show that the mesospheric air descended mainly between November and mid December 2002. In the second half of December the air descending into the polar vortex showed apparent ages characteristic of stratospheric air. As described above, the second half of December was the period when the mid winter warming started to
20
develop. It therefore seems that the warming in late December was not responsible for the downward transport of mesospheric air, but could rather be associated with pole-ward transport of upper stratospheric air, in accordance with the high fraction of tropical air derived from the trajectory calculations. The general mechanisms for stratospheric warmings which was first suggested by Matsuno (1971) is that an enhanced wave
forc-25
ing leads to a deceleration of the polar night jet and a simultaneous poleward merid-ional circulation. As air from lower latitudes is transported polewards (see section on trajectory calculations under Sect. 4), there is descending motion below and ascending
ACPD
5, 7457–7496, 2005
Mesospheric air in the stratosphere
A. Engel and the balloon teams Title Page Abstract Introduction Conclusions References Tables Figures J I J I Back Close
Full Screen / Esc
Print Version
Interactive Discussion
EGU motion above at high latitudes, leading to warming of the stratosphere and a
simulta-neous cooling of the mesosphere (e.g. Labitzke 1972). The downward transport and warming at high latitudes in the stratosphere is also necessary for the conservation of geostrophic equilibrium (e.g. Petzold, 1992). As the upper stratospheric air from lower latitudes descended inside the vortex, it cut off the further descent of mesospheric air
5
into the stratosphere. This is reflected in the high fraction of air of tropical origin in the trajectories which were started above the mesospherically influenced layer. Haynes et al. (1991) showed that the pole to pole meridional circulation in the mesosphere is driven by gravity wave breaking. Plumb et al. (2002) argued that the westerly flow in the winter stratosphere of the northern hemisphere acts as a selective filter allowing
10
only waves with an easterly phase speed to propagate upward. The breaking of these waves leads to a westerly force which in turn leads to a poleward meridional circula-tion. The deceleration of the stratospheric westerly zonal wind during the stratospheric warming events in late December and January would thus let gravity waves with di ffer-ent phase speeds travel upward, leading to a less selective mesospheric forcing and a
15
weaker forcing of the poleward meridional circulation in the mesosphere. This is con-sistent with a similar observation of mesospheric air based on observations of SF6and CO2measurements on 5 March 2000 (Plumb et al., 2002; Ray et al., 2002), which did not show such a layered structure but rather increasing mesospheric influence up to an altitude of about 32 to 33 km. The 1999/2000 vortex was much more stable than
20
the 2002/2003 vortex, the selective clipping of gravity waves in the stratosphere would thus have persisted over the winter. A fast poleward meridional transport of air has also been observed in the middle stratosphere during the major warming in late Jan-uaray (Kleinb ¨ohl et al., 2005). Note, however, that these air masses were outside of the polar vortex, whereas our trajectory calculations show tropically influenced air-masses
25
inside of the polar vortex. These air masses were transported poleward above the po-lar vortex and descended into the vortex. As shown by Konopka et al. (2005a1, b2), NOx-catalysed ozone loss can occur in these air masses, which are transported into the polar vortex.
ACPD
5, 7457–7496, 2005
Mesospheric air in the stratosphere
A. Engel and the balloon teams Title Page Abstract Introduction Conclusions References Tables Figures J I J I Back Close
Full Screen / Esc
Print Version
Interactive Discussion
EGU Previous simultaneous observations of SF6and CO2(Engel et al., 2002), which were
also partly performed inside the polar vortex showed no such difference between CO2 and SF6 derived mean age values. The only previous occasion when such a large difference between CO2 and SF6 derived mean age was observed by our group was when sampling a remnant of the 1996/1997 polar vortex on 23 June in mid latitudes
5
(Strunk et al., 2000). A balloon observation on 5 March 2000 (Ray et al., 2002; Plumb et al., 2002) also showed the influence of mesospheric air, while another observation a few days prior on 1 March 2000 showed quite good agreement between CO2-derived mean age and SF6-derived mean age (Engel et al., 2002), although both observations were made well inside the vortex. Other simultaneous observations of SF6 and CO2
10
during January and February 1997 did not show such a pronounced effect inside the polar vortex, although differences were noted when the air masses showed very high mean age values above 5 years (Engel et al., 2002). The influence of mesospheric air thus seems to be an irregular phenomenon which influences the vortex to largely vary-ing extends in different years, depending on the dynamical evolution over the winter.
15
5.3. The fraction of mesospheric air in the stratosphere
As shown above, the presence of mesospheric air in the stratosphere has an important impact on the chemistry of the stratosphere and also plays an important role in many studies where tracers or tracer-tracer correlations are used to infer chemical ozone loss or mixing processes. We therefore try to quantify the fraction of mesospheric air
20
which must have been present in the observed air masses, based on the observa-tions on 6 March 2003. We assume that the mean age of air derived from the CO2 observations is not affected by chemical processes, as the photolysis of CO2 in the mesosphere is a reversible process (CO is oxidised back to CO2). This is supported by the observation of several hundreds of ppb of CO in January and only about 200 in
25
early March. Assuming that the 200 ppb of CO observed on 6 March 2003 stem entirely from the photolysis of CO2, this would result in an overestimation of the CO2-derived mean age of air based on CO2 observations of less than 2 months. We assume that
ACPD
5, 7457–7496, 2005
Mesospheric air in the stratosphere
A. Engel and the balloon teams Title Page Abstract Introduction Conclusions References Tables Figures J I J I Back Close
Full Screen / Esc
Print Version
Interactive Discussion
EGU the mean age derived from the stratospheric observations of SF6 (ΓSF6,obs) and CO2
(ΓCO
2,obs) is produced by a mixture of stratospheric air (with a fraction of fstrat) which
is unaffected by mesospheric processes and has mixing ratios of SF6and CO2which would give consistent mean age values (ΓStrat) and a fraction of mesospheric air (fmes), which is affected by loss of SF6. The apparent mean age values derived from the SF6
5
transported from the mesosphere would beΓapp,mes, the true mean age of air entering from the mesosphere would beΓmes. If we neglect the small loss of CO2in the meso-spheric air we can write the following equations for the mean age values determined from SF6and CO2in the stratosphere:
ΓSF6,obs= fstrat ∗ΓStrat+ fmes∗Γapp,mes (1)
10
ΓCO2,obs= fstrat∗ΓStrat+ fmes∗Γmes. (2)
Subtracting Eq. (2) from Eq. (1) and solving for fmesyields
fmes=ΓSF6,obs −ΓCO
2,obs
Γapp,mes−Γmes
. (3)
In order to derive the fraction of mesospheric air, it is thus necessary to know the difference in mesospheric values of apparent age and of mean age. We have chosen
15
to take this value from the model calculations of KASIMA. As can be seen from Fig. 5, apparent age in the vicinity of the stratopause (about 50 km altitude) shows a large range of values, between about 10 and 20 years. Typical mean age values in the upper stratosphere and lower mesosphere are estimated to be on the order of 5–6 years. We have therefore chosen to use a mean value of about 10 years as the difference between
20
mean age and apparent age for further calculations, knowing that all results based on this value can only represent rough estimates of the amount of mesospheric air in the stratosphere. As a sensitivity study we have also performed the calculation assuming 5 and 15 years as a difference between apparent age and true mean age for mesospheric air entering the stratosphere. The vertical profile of the mesospheric fraction of the air
ACPD
5, 7457–7496, 2005
Mesospheric air in the stratosphere
A. Engel and the balloon teams Title Page Abstract Introduction Conclusions References Tables Figures J I J I Back Close
Full Screen / Esc
Print Version
Interactive Discussion
EGU calculated in this way is shown in Fig. 11, where the thin lines represent the profiles
based on apparent age difference of 5 and 15 years for mesospheric air entering the stratosphere.
The largest fraction of mesospheric air is calculated around 25 km altitude. Depend-ing on the assumed apparent difference in age for mesospheric air entering the
strato-5
sphere, a fraction between 36% (assuming a difference of 15 years), 54% (assuming a difference of 10 years) and 108% (assuming a difference of 5 years) is calculated. The calculation of a fraction of 108% shows that the choice of 5 years of apparent age difference for mesospheric air entering the stratosphere is obviously to low, as the ob-served air mass showed a difference between apparent age and mean age from CO2
10
of about 5.5 years. A fraction above 1 should thus be interpreted as undiluted meso-spheric air within the limits of uncertainty. Based on the assumptions stated above, the air mass observed at 30 km altitude had a mesospheric fraction of 20 (14–41)%, whereas the air observed in the lowest part of the stratosphere around 11 km altitude would have a fraction of 3 to 10% of mesospheric air. As can be seen from Fig. 5,
15
the model predicts a large variability of apparent age values with altitude and latitude. It is therefore not possible to extrapolate these results to the entire vortex or attempt to calculate the amount of mesospheric air in the vortex. It is clear, however, that in order to explain significant amounts of mesospheric air in the stratosphere, because of the low pressure at the stratopause very large volumes of mesospheric air must have
20
been transported into the stratosphere. Plumb et al. (2002) noted that in their model, the mesosphere was flushed completely during a single winter. One can thus estimate that the entire mesosphere is flushed into the stratosphere twice per year (once during northern hemisphere winter, once during southern hemisphere winter). If this quantity of air was mixed over the entire stratosphere above 100 hPa, it would – assuming a
25
mean stratopause pressure of 0.15 hPa – correspond to a mesospheric input of about 0.3% of the air in this layer per year. Therefore, we expect the influence of mesospheric SF6loss to be low on mid latitude age of air investigations based on SF6observations. A significant influence of the mesospheric loss of SF6 on mean age determination
ACPD
5, 7457–7496, 2005
Mesospheric air in the stratosphere
A. Engel and the balloon teams Title Page Abstract Introduction Conclusions References Tables Figures J I J I Back Close
Full Screen / Esc
Print Version
Interactive Discussion
EGU should thus only be visible, if the mesospheric air is confined to an isolated region of
the stratosphere, like e.g. the polar vortex.
6. Conclusions
We have shown that air which has been transported from the mesosphere was ob-served in the Arctic stratospheric vortex in early 2003. This was obob-served during 3
bal-5
loon flights, based on different tracers or combinations of tracers. The mesospherically influenced air propagated downwards with time. It was observed above 30 km altitude in late January, as a layer centred around 25 km altitude in early March and around 22 km in late March. Model calculations show that the descent of mesospheric air oc-curred during November and December 2002. During the second half of December,
10
when the first minor midwinter warming occurred, air of mainly stratospheric origin was transported polewards in the upper stratosphere and beneath this a layer of meso-spheric air was cut off and descended further inside the vortex. The KASIMA model is able to catch the main features of the distribution of mesospherically influenced air on 6 March. The model also calculates the correct order of magnitude of SF6 derived
15
apparent age. Long term trajectory calculations using the heating rates calculated for the SLIMCAT model are also able to reproduce the layered structure. These calcula-tions also show, that a large fraction of the air above the mesospherically influenced layer was of tropical origin, corroborating the interpretation that air from lower latitudes was transported polewards during the minor warming at the end of December 2002,
20
thereby cutting of the descending mesospheric air. Based on assumptions about the difference between apparent age and true mean age for mesospheric air entering the stratosphere, we estimate that the fraction of mesospheric air in the layer observed on 6 March must have been more than 36%. Even at the lowest altitudes (samples taken at 11.2 km altitude) observed on 6 March, mesospherically influenced air must have
25
been present. We estimate the fraction of mesospheric air here to be between 3 and 10%.
ACPD
5, 7457–7496, 2005
Mesospheric air in the stratosphere
A. Engel and the balloon teams Title Page Abstract Introduction Conclusions References Tables Figures J I J I Back Close
Full Screen / Esc
Print Version
Interactive Discussion
EGU The clear evidence that mesospheric air was mixed with stratospheric air inside the
Arctic polar vortex during the winter 2002/2003 is an important finding, which must be considered when using correlation studies to derive denitrification or ozone loss. It is also clear from this kind of observations, that for models to correctly simulate stratospheric polar ozone chemistry, the mesosphere must be included. For example a
5
comparison between observed an modelled passive ozone by Konopka et al. (2005a1, b2) showed that there were large losses of ozone in the polar vortex in early 2003 which are attributed to chemical ozone depletion due to enhanced NOyvalues, which are in part of mesospheric origin.
Acknowledgements. The balloon launches discussed in this study were performed by the
10
CNES balloon launch team, under the lead of the late P. Faucon. We would like to thank P. Fau-con for his friendship and professional co-operation over many years and to acknowledge the excellent balloon launch operations during the ENVISAT validation campaign. Funding by ESA, CNES and DLR for the balloon operations is greatfully acknowledged.
References
15
Bauer, R., Engel, A., Franken, H., Kulessa, G., Schiller, C., Schmidt, U., Borchers, R., and Lee, J.: Monitoring the vertical structure of the arctic polar vortex over northern Scandinavia during EASOE: regular N2O profile observations, Geophys. Res. Lett. 21, 1211–1214, 1994. Chipperfield, M. P.: Multiannual simulations with a three-dimensional chemical transport model,
J. Geophys. Res., 104(D1), 1781–1806, 1999.
20
Conway, T. J., Tans, P. P., Waterman, L. W., Thoning, K. W., Kitzis, D. R., Masarie, K. A., and Zhang, N.: Evidence for interannual variability of the carbon cycle from the National Oceanic and Atmospheric Administration/Climate Monitoring and Diagnostics Laboratory Global Air Sampling Network, J. Geophys. Res., 99(D11), 22 831–22 855, 1994.
Elkins, J. W., Thompson, T. M., Swanson, T. H., Butler, J. H., Hall, B. D., Cummings, S. O.,
25
Fisher, D. A., and Raffo, A. G.: Decrease in the growth rates of atmospheric chlorofluorocar-bons 11 and 12, Nature, 364, 780–783, 1993.
ACPD
5, 7457–7496, 2005
Mesospheric air in the stratosphere
A. Engel and the balloon teams Title Page Abstract Introduction Conclusions References Tables Figures J I J I Back Close
Full Screen / Esc
Print Version
Interactive Discussion
EGU
deduced from observations in the Arctic winter stratosphere, J. Atmos. Chem., 27, 107–126, 1997.
Engel, A., Strunk, M., M ¨uller, M., Haase, H.-P., Poss, C., Levin, I., and Schmidt, U.: The temporal development of total chlorine in the high latitude stratosphere based on ref-erence distributions of mean age derived from CO2 and SF6, J. Geophys. Res. 107,
5
doi:10.1029/2001JD000584, 2002.
Fahey, D. W., Solomon, S., Kawa S. R., Loewenstein, M., Podolske, J. R., Strahan, S. E., and Chan, K. R.: A diagnostic for denitrification in the winter polar stratosphere, Nature, 345, 698–702, 1990.
Fisher, M., O’Neill, A., and Sutton, R.: Rapid descent of mesospheric air into the stratospheric
10
polar vortex, Geophys. Res. Lett. 20, 1267–1270, 1993.
Friedl-Vallon, F., Maucher, G., Kleinert A., Lengel, A., Keim, C., Oelhaf, H., Fischer, H., Seefeld-ner, M., and Trieschmann, O.: Design and characterization of the balloon-borne Michelson Interferometer for Passive Atmospheric Sounding, Appl. Opt., 43, 3335–3355, 2004.
Geller, L. S., Elkins, J. W., Lobert, J. M., Clarke, A. D., Hurst, D. F., Butler, J. H., and Myers,
15
R. C.: Tropospheric SF6: Observed latitudinal distribution and trends, derived emissions and interhemispheric exchange time, Geophys. Res. Lett. 24, 675–678, 1997.
Greenblatt, J. B., Joost, H. J., Loewenstein, M., et al.: Tracer-based determination of vortex descent in the 1999/2000 Arctic winter, J. Geophys. Res., 107, doi:10.1029/2001JD000937, 2002.
20
Hall, T. M. and Plumb, R. A.: Age as a diagnostic of stratospheric transport, J. Geophys. Res., 99(D1), 1059–1070, 1994.
Haynes, P. H., Myers, C. J., McIntyre, M. E., Shappard, T. G, and Shine, K. P.: On the downward control of extratropical diabatic circulations by eddy-induced mean zonal forces, J. Atmos. Sci., 48, 651–678, 1991.
25
H ¨opfner, M., Oelhaf, H., Wetzel, G., Friedl-Vallon, F., Kleinert, A., Lengel, A., Maucher, G., Nordmeyer, H., Glatthor, N., Stiller, G., von Clarmann, T., Fischer, H., Kr ¨oger, C., and Desh-ler, T.: Evidence of scattering of tropospheric radiation by PSCs in mid-IR limb emission spectra: MIPAS-B observations and KOPRA simulations, Geophys. Res. Lett., 29(8), 1278, doi:10.1029/2001GL014443, 2002.
30
Khalil, M. A. K. and Rasmussen, R. A.: Carbon monoxide in the earth’s atmosphere – Indica-tions of a global increase, Nature, 332, 242-245, 1988.
ACPD
5, 7457–7496, 2005
Mesospheric air in the stratosphere
A. Engel and the balloon teams Title Page Abstract Introduction Conclusions References Tables Figures J I J I Back Close
Full Screen / Esc
Print Version
Interactive Discussion
EGU
Nature, 347, 743–745, 1990.
Kleinb ¨ohl, A., Kuttippurath, J., Sinnhuber, M., Sinnhuber, B.-M., K ¨ullmann, H., K ¨unzi, K., and Notholt, J.: Rapid meridional transport of tropical airmasses to the Arctic during the major stratospheric warming in January 2003Atmospheric Chemistry and Physics, Vol. 5, 1291– 1299, 2005.
5
Kondo, Y., Koike, M., Engel, A., Schmidt, U., M ¨uller, M., Sugita, T., Kanzawa, H., Nakazawa, T., Aoki, S., Irie, H., Toriyama, N., Suzuki, T, and Sasano, Y.: NOy–N2O correlation observed inside the Arctic vortex in February 1997: Dynamical and chemical effects, J. Geophys. Res., 104, 8215–8224, 1999.
Kouker, W., Beck, A., Fischer, H., and Paetzold, K.: Downward transport in the upper
strato-10
sphere during the minor warming in February 1979, J. Geophys. Res., 100, 11 069–11 084, 1995.
Kouker, W., Offermann, D., K¨ull, V., Reddmann, T., Ruhnke, R., and Franzen, A.: Streamers observed by the CRISTA experiment and simulated in the KASIMA model, J. Geophys. Res., 104(D13), 16 405–16 418, 1999.
15
Labitzke, K.: Temperature changes in the mesosphere and stratosphere connected with circu-lation changes in winter, J. Atmos. Sci., 29, No. 4, 756–766, 1972.
LeTexier, H., Solomon, S., and Garcia, R. R.: The role of molecular hydrogen and methane oxidation in the water vapor budget of the stratosphere, Quart. J. Roy. Meteor. Soc. 11, 281– 295, 1988.
20
L ´opez-Valverde, M. A., L ´opez-Puertas, M., Remedios, J. J., Rodgers, C. D., Taylor, F. W., Zipf, E. C., and Erdman, P. W.: Validation of measurements of carbon monoxide from the Improved Stratospheric and Mesospheric Sounder, J. Geophys. Res., 101, 9929–9955, 1996.
Maiss, M., and Levin, I.: Global increase of SF6 observed in the atmosphere, Geophys. Res. Lett., 21, 569–572, 1994.
25
Matsuno, T.: A dynamical model of the stratospheric sudden warming, J. Atmos. Sci., 28, 1479–1494, 1971.
Moreau G., Robert, C., Catoire V., Camy-Perret, C., Huret, N., Pirre, M., Pomathiod, L., and Chartier, M.: SPIRALE: A multispecies in situ balloon-borne instrument with six tunable diode laser spectrometers, Appl. Optics, accepted, 2005.
30
M ¨uller, R., Crutzen, P. J., Grooß, J.-U., Br ¨uhl, C., Russell, J. M., Gernandt, H., McKenna D. S., and Tuck, A. F.: Severe chemical ozone loss in the Arctic during the winter 1995–96, Nature, 389, 709–712, 1997.
ACPD
5, 7457–7496, 2005
Mesospheric air in the stratosphere
A. Engel and the balloon teams Title Page Abstract Introduction Conclusions References Tables Figures J I J I Back Close
Full Screen / Esc
Print Version
Interactive Discussion
EGU
M ¨uller, R., Schmidt, U., Engel, A., McKenna, D. S., and Proffitt, M. H.: The O3/N2O relation from
balloon-borne observations as a measure of Arctic ozone loss in 1991/92, Q. J. R. Meteorol. Soc., 127, 1389–1412, 2001.
Naujokat, B. and Grunow, K.: The stratospheric Arctic winter 2002/03: balloon flight planning by trajectory calculations, Proceedings of the 16th ESA Symposium on European Rocket
5
and Balloon Programmes and Related Research, St. Gallen 2003 (ESA SP-530), 421–425, 2003.
Petzold, K.: Dynamik der Stratosph ¨arenerw ¨armungen , Promet, 22, 90–96, 1992.
Plumb, R. A., Waugh, D. W., and Chipperfield, M. P.: The effects of mixing on tracer relation-ships in the polar vortices, J. Geophys. Res., 105, 10 047–10 062, 2000.
10
Plumb, R. A., Heres, W., Neu, J. L., Mahowald, N., del Corral, J., Toon, G. C., Ray, E., Moore F., and Andrews, A. E.: Global tracer modeling during SOLVE: high latitude descent and mixing, J. Geophys. Res. , 107, 8309, doi:10.1029/2001JD001023, 2002 (printed 108(D5), 2003). Podolske, J. R., Loewenstein, M., Strahan, S. E., and Chan, K. R.: Stratospheric Nitrous Oxide
distribution in the Southern Hemisphere, J. Geophys. Res., 94, 16 767–16 772, 1989.
15
Proffitt, M. H., Margitan, J. J., Kelly, K. K., Loewenstein, M., Podolske, J. R., and Chan, K. R.: Ozone loss in the Arctic polar vortex inferred from high altitude aircraft measurements, Nature, 347, 31–36, 1990.
Ray, E. A., Moore, F. L., Elkins J. W., Hurst, D. F., Romashkin, P. A., Dutton, G. S., and Fahey, D. W.: Descent and mixing in the 1999-2000 northern polar vortex inferred from in situ tracer
20
measurements, J. Geophys. Res., 107, doi:10.1029/2001JD000961, 2002.
Reddmann, T., Ruhnke, R., and Kouker, W.: Three-dimensional model simulations of SF6with mesospheric chemistry, J. Geophys. Res., Vol. 106, 14 525–14 537, 2001.
Reimer, E. and Scherer, B.: An operational meteorological diagnostic system for regional air pollution analysis and long term modeling, Air pollution modeling and its application IX,
Pro-25
ceedings of the Ninetenth NATO/CCMS International Technical Meeting on Air pollution mod-eling and its application, Sept., 29–Oct., 4, 1991, Crete, Greece, 1992.
Rinsland, C. P., Salawitch, R. J., Gunson, M. R., Solomon, S., Zander, R., Mahieu, E., Goldman, A., Newchurch, M. J., Irion, F. W., and Chang, A. Y.: Polar stratospheric descent of NOy and CO and Arctic denitrification during winter 1992–1993, J. Geophys. Res., 104, 1847–1861,
30
1999.
Schmidt, U., Kulessa, G., Klein, E., R ¨oth, E.-P., Fabian, P., and Borchers, R.: Intercomparison of balloon-borne cryogenic whole air samplers during the MAP/GLOBUS 1983 campaign,