HAL Id: hal-00302061
https://hal.archives-ouvertes.fr/hal-00302061
Submitted on 1 Jan 2002
HAL is a multi-disciplinary open access
archive for the deposit and dissemination of
sci-entific research documents, whether they are
pub-lished or not. The documents may come from
teaching and research institutions in France or
abroad, or from public or private research centers.
L’archive ouverte pluridisciplinaire HAL, est
destinée au dépôt et à la diffusion de documents
scientifiques de niveau recherche, publiés ou non,
émanant des établissements d’enseignement et de
recherche français ou étrangers, des laboratoires
publics ou privés.
occurring in the ionospheric plasma
H. Usui, H. Matsumoto, R. Gendrin
To cite this version:
H. Usui, H. Matsumoto, R. Gendrin. Numerical simulations of a three-wave coupling occurring in the
ionospheric plasma. Nonlinear Processes in Geophysics, European Geosciences Union (EGU), 2002, 9
(1), pp.1-10. �hal-00302061�
Nonlinear Processes in Geophysics (2002) 9: 1–10
Nonlinear Processes
in Geophysics
c
European Geophysical Society 2002
Numerical simulations of a three-wave coupling occurring in the
ionospheric plasma
H. Usui1, H. Matsumoto1, and R. Gendrin1,2
1Radio Science Center for Space and Atmosphere, Kyoto Univerisity Uji, Kyoto 611-0011, Japan 2Present address Institut Pierre Simon Laplace, Paris University, 4 Place Jussieu, 75252 Paris, France
Received: 6 November 2000 – Accepted: 20 March 2001
Abstract. We studied a three-wave coupling process
occur-ring in an active experiment of microwave power transmis-sion (MPT) in the ionospheric plasma by performing one-dimensional electromagnetic PIC (Particle-In-Cell) simula-tions. In order to examine the spatial variation of the cou-pling process, we continuously emitted intense electromag-netic waves from an antenna located at a simulation bound-ary. In the three-wave coupling, a low-frequency electrostatic wave is excited as the result of a nonlinear interaction be-tween the forward propagating pump wave and backscattered wave. In the simulations, low-frequency electrostatic bursts are discontinuously observed in space. The discontinuity of the electrostatic bursts is accounted for by the local elec-tron heating due to the bursts and the associated modification of the wave dispersion relation. In a case where the pump wave propagates along the geomagnetic field Bext, several
bursts of Langmuir waves are observed. Since the first burst consumes a part of the pump wave energy, the pump wave is weakened and cannot trigger the three-wave coupling be-yond the region where the burst occurs. Since the dispersion relation of the Langmuir wave is variable, due to the local electron heating by the burst, the coupling condition even-tually becomes unsatisfied and the first interaction becomes weak. Another burst of Langmuir waves is observed at a dif-ferent region beyond the location of the first burst. In the case of perpendicular propagation, the upper hybrid wave, one of the mode branches of the electron cyclotron harmonic waves, is excited. Since the dispersion relation of the upper hybrid wave is less sensitive to the electron temperature, the coupling condition is not easily violated by the temperature increase. As a result, the three-wave coupling periodically takes place in time and eventually, the transmission ratio of the microwaves becomes approximately 20%, while almost no attenuation of the pump waves is observed after the first electrostatic burst in the parallel case. We also examined the dependency of the temporal growth rate for the electrostatic waves on the amplitude of the pump wave.
Correspondence to: H. Usui ([email protected])
1 Introduction
The idea of transmitting power over long distances by mi-crowaves is rather old. In the Solar Power Satellite (SPS) project, solar energy is collected by a large number of so-lar cells attached to the satellite and transmitted to a ground station or to another satellite (Glaser, 1968). At the Radio Science Center for Space and Atmosphere of Kyoto Univer-sity, a program was started in the 80’s to study the feasibil-ity and the implications of this concept. Two rocket experi-ments were conducted in order to study the microwave power transmission (MPT) in the ionosphere: the MINIX experi-ment (Kaya et al., 1986; Matsumoto and Kimura, 1987) and the METS experiment (Kaya et al., 1993). Both experiments showed that electrostatic waves were excited around the local plasma frequency in association with the microwave emis-sion. In the previous studies of ionospheric heating by HF radio waves, plasma wave excitation was also observed (e.g. Carlson and Duncan, 1977). The associated density modifi-cation of electrons and the self-focusing of radio waves were also studied (Duncan and Behnke, 1978; Perkins and Gold-man, 1980).
In parallel, theoretical and numerical studies were engaged to evaluate the impact of intense microwaves on space plas-mas (Matsumoto, 1982; Matsumoto et al., 1995; Nishikawa, 1999). These studies revealed that the electrostatic wave gen-eration was due to the stimulated Raman scattering type of the three-wave coupling process. It was also found that elec-trons are heated by the excited electrostatic field. In this pro-cess, three waves are basically involved (e.g. Fejer, 1979): an intense electromagnetic wave which plays the role of a pump wave, a backscattered electromagnetic wave with a fre-quency slightly lower than the frefre-quency of the pump wave, and an electrostatic wave with a frequency much lower than the other two waves.
Meanwhile, an active MPT experiment is proposed by us-ing the JEM (Japan Experimental Module) exposed facility
Fig. 1. (a) Schematic illustration of the three-wave coupling
pro-cess in a ω − k diagram. For a case in which the wave propagation is perpendicular to Bext. The electromagnetic wave can be either
or-dinary or extraoror-dinary, depending on the relative orientation of the electric field with respect to the external magnetic field Bext. The
excited electrostatic wave can be one of the mode branches of an electron cyclotron harmonic wave, after Matsumoto et al. (1995).
(b) Time evolution of a three-wave coupling process: Continuous
thin line is the electromagnetic pump wave. Dashed line is the elec-tromagnetic backscattered wave. Bold line is the electrostatic ex-cited wave.
in the International Space Station. The objectives are to test the MPT in space plasma both technically and scientifically with a long-term exposed facility. In particular, by chang-ing the microwave intensity and the angle with respect to the geomagnetic field Bext, we will study the possibility of the
three-wave coupling process which affects the efficiency of the energy transmission through the space plasma. In the ex-periments, intense microwaves around several hundred V/m are emitted from an 18 × 18 array antenna as pump waves.
The emitted waves are received by another antenna located approximately 2.5 m away from the array antenna. The pump waves are spatially focused by the phase control of the array antenna. Although the experiment has not been approved yet, we performed electromagnetic PIC (Particle-In-Cell) simula-tions prior to the experiment. In the simulasimula-tions, we place a microwave antenna at one edge of the simulation system and emit pump waves in one direction. This model enables us to analyze the interaction process not only temporally, but also spatially. In this study, we present a brief review of the three-wave coupling in Sect. 2. In Sects. 3 and 4, we will describe the model and the results of the simulations. In Sect. 5, we will summarize our findings and discuss some of the impor-tant physical processes observed in the simulations.
2 Three-wave coupling
Figure 1a shows a schematic illustration of the three-wave coupling process in the ω − k domain for a case in which the wave propagation is perpendicular to the external magnetic field Bext, where ω and k denote frequency and wavenumber,
respectively. A pump wave whose frequency and wavenum-ber are ω0 and k0, respectively, causes the backscattered
wave with ω1and k1and the electrostatic wave with ω2and
k2.
In the coupling process, the total energy and momentum of the associated waves should be conserved: ω0=ω1+ω2and
k0 = k1+k2should be satisfied, respectively. In the MPT
in the ionospheric plasma, the pump wave corresponds to in-tense microwaves emitted from the antenna at a frequency of GHz. The backscattered wave also has a frequency of GHz. These waves can either be ordinary or extraordinary, depend-ing on the relative orientation of its electric field with respect to Bext. The excited electrostatic wave can be one of the
mode branches of an electron cyclotron harmonic wave. In the case of parallel propagation, the electrostatic wave can be the Langmuir wave.
So far the temporal evolution of the three wave-coupling has been well studied and it can be described with the fol-lowing mode-coupling equations:
dE0 dt =iβ0E1E2 dE1 dt =iβ1E0E ∗ 2 dE2 dt =iβ2E0E ∗ 1 (1)
where E0, E1 and E2 denote the amplitudes of the pump,
backscattered, and excited waves, respectively. Quantities with ∗ denote the corresponding complex conjugates. β0, β1
and β2are the coupling coefficients between the three waves,
respectively. β0=β1+β2should be satisfied. A schematic
illustration of the temporal evolution of each wave amplitude is shown in Fig. 1b. Provided that the amplitude of the pump wave is intense enough, the three-wave coupling process is stimulated and the initial amplitude of the pump wave starts
H. Usui et al.: Numerical simulations of a three-wave coupling occurring in the ionospheric plasma 3
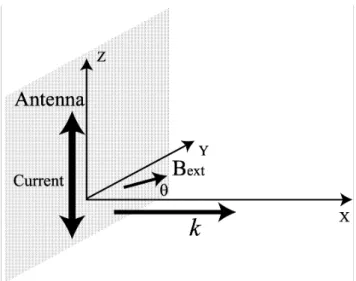
Fig. 2. Geometry of the simulation experiment in the 1-D case. The
pump wave is emitted at the origin of the system by a current Jz
injected by an antenna. The angle between Bextand the propagation
vector can be changed.
to decrease as time elapses. Two waves, the backscattered and excited ones, simultaneously start to grow by satisfying the set of Eq. (1). When the amplitude of the pump wave becomes low enough, the process is reversed. Consequently, the pump wave is no longer absorbed and it can grow in time, until the whole process repeats itself in accordance with the equations.
In the set of Eq. (1), however, no plasma kinetic effects, such as electron heating, is considered. In a real situation, the excited electrostatic waves can heat electrons and may affect the local plasma condition. Therefore, in the present study, we will particularly examine the relation between the excited electrostatic waves and associated electron heating in the coupling process by performing PIC simulations.
3 PIC simulations
3.1 Model
The one-dimensional simulation model adopted in the present study is shown in Fig. 2.
Instead of setting a pump wave uniformly in the system as an initial condition, we emit electromagnetic waves into a magnetized plasma toward the x direction by the continuous oscillation of a current source located at one side of the sim-ulation boundary. In order to see the dependence of the cou-pling process on the angle with respect to Bext, the Bext
ori-entation is variable in the simulations. In a real experiment, we utilize a frequency of the order of 2 GHz for the pump wave, while the plasma frequency of the ionospheric plasma and the electron cyclotron frequency are both in the MHz frequency range. In the present computer experiments, how-ever, we reduce the frequency ratio between the pump wave
Table 1. Parameters used in the simulations
Plasma parameters
Sped of light Cv 100
Electron plasma frequency ωp 4.0
Electron cyclotron frequency e −1.0
External magnetic field Bext 1.0
System parameters
Time step width 1t 0.01 Unit grid length 1x 1.0 Number of grids N x 1024 Electrons
Ratio between charge and mass q/m −1.0 Number of super particles Np 32768 Thermal velocity vth 1.0
Pump electromagnetic wave
Excitation frequency ω0 13.2
Wavenumber (number of modes) k0 0.132 (21.5)
Intensity of radiated electric field E0/|BextCv| 2.5
and the plasma characteristic waves to shorten the compu-tational time. We set the ratios of the plasma frequency and the frequency of the pump wave to the electron cyclotron fre-quency as 4.0 and 13.2, respectively. Other parameters of the simulation are given in Table 1.
3.2 ω − kdiagram
Figure 3 shows a ω−k diagram obtained by the Fourier trans-formation of electromagnetic (EM) and electrostatic (ES) field data in space and time for the parallel propagation case. We analyzed the data for 0 < Xe/Cv < 10.24 in space
and 0 < et < 20.48 in time. Note that wave spectra for
the pump, backscattered, and electrostatic waves are super-imposed in the same ω − k diagram: the pump wave and the backscattered wave are plotted in the frequency domain above ω/ e=8 and the electrostatic wave is plotted in the
lower frequency region. The spectra for the pump, backscat-tered, and electrostatic waves are respectively normalized to their maximum value: Emax/BextCv =112, 14, and 3. The
normalized spectra are plotted for each wavenumber to fit the interval of the horizontal scale. For reference, we imposed dashed lines which correspond to the speed of light, Cv.
It is found that a fraction of the pump wave with (ω0, k0)
is backscattered with (ω1, k1)and then a low-frequency ES
wave with (ω2, k2)is excited around the local plasma
fre-quency ωp. Since Bext is along the simulation system, the
excited ES waves correspond to the Langmuir mode. As each wave component can be connected with each line of a paral-lelogram, it is basically confirmed that all three waves satisfy
Fig. 3. ω − k diagram obtained by the Fourier transformation of Ez electromagnetic and Exelectrostatic data in space and time for the
parallel case. The obtained wave spectra are plotted at each wavenumber, normalized to their maximum value. The dashed lines correspond to the speed of light. The wavenumber of the most intense electrostatic wave corresponds approximately to kCv/ e∼20.
the relations of the three-wave coupling, as stated in the pre-vious section. One notices an electrostatic component which is excited at smaller wavenumbers with a frequency ωp. This
component is found on the dashed line, which implies that the propagation velocity is Cv. We will discuss the
gener-ation of this fast-propagating electrostatic component in the later section.
3.3 Spatial and temporal variation of fields
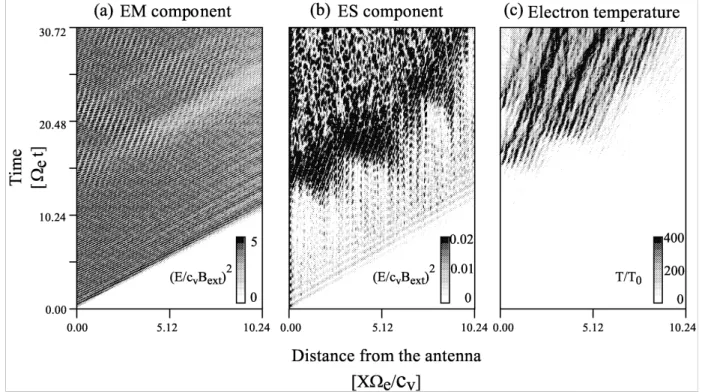
Figure 4 shows spatial and temporal profiles for EM waves, including the pump or backscattered components, excited ES waves, and the electron temperature in the parallel propaga-tion case. The vertical and horizontal axes show the normal-ized time and the distance from the antenna location, respec-tively. In panel (a), we see the pump waves propagating away from the antenna, which is shown as oblique lines originated from the antenna position. The gradient of the lines corre-sponds to the inverse of Cv. One notices that the field
inten-sity is not constant approximately after et ∼10. Although
not clearly shown, there seems to be two regions which have distinct stripes with a large gradient within Xe/Cv = 5:
one is found within Xe/Cv ∼2 around et ∼15, and the
other is originated around Xe/Cv∼5 and et ∼16,
prop-agating in the backward direction. The stripes are due to the interference between the forward and backward propagating EM waves. Another region with the same stripes is faintly
seen after et ∼20 at the further location. In the spatial
re-gion approximately between Xe/Cv=5.12 and 10.24, the
amplitude is weak, particularly around et =20.48 to 25.6.
This decrease of pump wave amplitude is caused by the en-ergy transfer of the pump wave to the other wave modes in the three-wave coupling process.
In panel (b), as clearly shown around et =10.24−20.48,
there are three main bursts of electrostatic waves: one is found near the antenna position approximately after et =
10, and the other is at a further region around et = 15.
The third interaction can be found around Xe/c ∼8 after et ∼20. These bursts correspond to the regions where the
pump wave energy is modified with profiles of large gradient stripes, as stated in the previous paragraph. The profile shows oblique lines which have a much larger gradient than the one corresponding to the EM propagation. This implies that the phase velocity of the intense ES bursts is much smaller than Cv, approximately 0.2 Cv. A detailed analysis of panel (b)
shows that the ES frequency is of the order of the plasma frequency and that the normalized wavenumber is of the or-der of 20; both values are confirmed by the Fourier spectrum shown in Fig. 3. Following the intense bursts with a coher-ent pattern of propagation, a complicated incohercoher-ent ES field structure appears in panel (b), particularly after et ∼ 20.
As shown in panel (a), due to the presence of the backscat-tered pump waves, it may be possible that the backscatbackscat-tered
H. Usui et al.: Numerical simulations of a three-wave coupling occurring in the ionospheric plasma 5
Fig. 4. Evolution of the wave field and of the electron temperature as a function of time and distance. From left to right: EM pump wave
energy (Ez), excited ES wave energy (Ex), electron temperature (Te). In this simulation run, the pump wave intensity E0/|BextCv|is equal
to 2.5.
EM wave becomes a pump wave for another three-wave cou-pling and excites ES waves in the backward direction. Then the forward and backward propagating ES waves cause a standing-like wave, which can cause the complicated inco-herent profiles of an ES field. One notices small-amplitude components propagating from the beginning of the simula-tion run and corresponding to the propagasimula-tion of EM waves with Cv, as shown in panel (a). This component is also shown
in the previous ω − k diagram at a low wavenumber around ωp. We will discuss the generation process of this ES
com-ponent later.
In panel (c), we plot the electron heating in terms of tem-perature. In accordance with the excitation of the ES waves, the electron temperature increases. Oblique lines in the panel implies that the heated region propagates with the same ve-locity as the ES field bursts. Considering Bext is in parallel
to the simulation system, electrons are resonantly heated and trapped by the excited ES waves and move along Bext with
the wave propagation.
In conclusion, in the coupling process, we could observe the excitation of intense ES waves and the associated elec-tron heating. The interesting point we should stress is that the interaction takes places intermittently in space as well as in time. Although we continuously emit the pump wave with constant intensity, the three-wave coupling does not oc-cur continuously in space. This spatial discontinuity of the three-wave coupling process is not described with the Eq. (1) which only express the temporal variations. In a later section,
we will discuss in detail the spatial evolution of the coupling process in terms of the ES wave excitation and the associated electron heating.
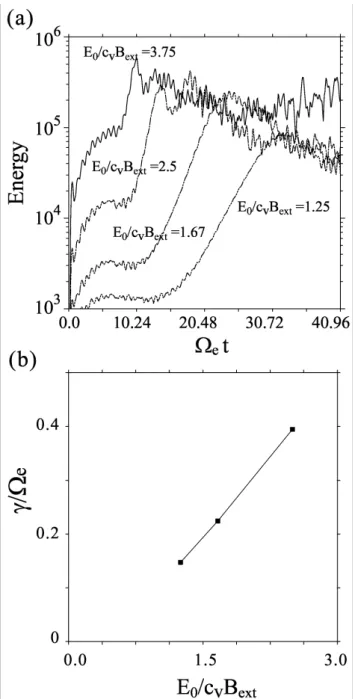
3.4 Dependence of ES waves on the pump wave intensity We examined the dependence of the growth of ES waves on the intensity of the pump waves. From the mode-coupling Eq. (1), we can obtain the temporal growth rate of the ES waves γ = √|β1β2|E0 on the assumption that dE0/dt is
negligible at the initial stage in comparison with the temporal variation of the other two waves. One notices that γ is pro-portional to the intensity of the pump waves E0. To confirm
this relation, we performed the computer experiments with different amplitudes of the pump waves: E0/|BextCv| =
1.25, 1.67, 2.5, and 3.75. Time evolutions of the field en-ergy of Ex for each case are superimposed in panel (a) of
Fig. 5. As described in the previous section, ES waves are excited in all the cases due to the three-wave coupling. It is found that the excitation occurs more quickly for the case with the larger amplitude of the pump waves. This relation qualitatively agrees with the temporal growth rate stated ear-lier. To analyze the ES wave excitation quantitatively, we de-fine the temporal growth rate γ for each case from the slope of data in the figure in the time interval where the wave en-ergy grows exponentially. We plot the obtained growth rates normalized to the electron cyclotron frequency in panel (b) of Fig. 5 for E0/|BextCv| =1.25, 1.67, and 2.5. The growth
Fig. 5. Relationship between the starting time of the three-wave
coupling process and the amplitude of the pump wave. Panel (a) shows the time evolutions of the energy of ES waves excited in the three-wave coupling process with different amplitudes of the pump wave. Panel (b) shows the temporal growth rates for
E0/|BextCv| =1.25, 1.67, and 2.5 obtained from the slope of data
in panel (a) in a time interval where the wave energy grows expo-nentially.
rate for the case of E0/|BextCv| =3.75 is not shown in the
panel because it is rather difficult to evaluate the value due to the short time interval for the exponential growing phase. We see that the results are almost aligned on one line, which im-plies that the growth rate γ is proportional to the amplitude of the pump wave E0.
4 Discussion
4.1 Detail analysis of ES field and electron heating
Figure 6 indicates a detailed analysis of the ES wave excita-tion and the associated electron heating. The panels focus on the first and second electrostatic bursts. The first burst occurs around et ∼ 10. The interesting feature we notice
is that the region of the ES wave excitation is found up to Xe/Cv ∼ 3 from the antenna location and no waves are
excited beyond this region until et ∼ 15. This situation
can be interpreted as follows: once the three-wave coupling occurs, a part of the pump waves are backscattered and the forward propagating waves are weakened at the interaction region. Beyond Xe/Cv ∼ 3, as shown in Fig. 6, the ES
waves are less excited because the pump waves are weak-ened and cannot trigger the coupling. Corresponding to the ES wave excitation around Xe/Cv ∼3, electrons are
lo-cally heated, as shown in panel (b). In the parallel case, the ES wave is the Langmuir mode whose dispersion relation de-pends on the electron temperature. As the local temperature increases due to the electron heating, the dispersion relation is modified and does not satisfy the condition of the three-wave coupling. In such a situation, the interaction becomes weak. Correspondingly, the electrons which are resonantly heated by the excited waves propagate away and then the in-crease of the electron temperature stops around et ∼ 17.
The second three-wave coupling is now ready to occur be-cause the pump waves are less backscattered and can propa-gate through the system because the first interaction is weak-ened. Although some of the heated electrons propagate away with the excited ES waves from the region where the first in-teraction took place, the plasma condition is somewhat mod-ified. Therefore, the second coupling process occurs at a re-gion around Xe/Cv =3 ∼ 6, which is beyond the region
for the first interaction. As mentioned earlier, the excited ES waves propagate with the phase velocity of the Langmuir waves.
To see the detail of the electron dynamics, we show phase diagrams of electrons in Fig. 7 at different times: et =
14.08, 16.64 and 19.20. In all panels, we see electrons res-onantly heated by the excited ES waves. In panel (a), elec-trons located at the region 0 < Xe/Cv<2 where the first
interaction takes place are trapped by the excited ES waves. It is obviously shown that the electron trapping causes the scattering of electrons in the velocity space and the electron temperature increases. In panel (b) which shows the tran-sient phase between the first and second interactions, the electron velocity starts to be modified at the further region 2 < Xe/Cv by the second interaction. In panel (c), the
interaction region is shifted to the further location approxi-mately 2.5 < Xe/Cv <7.5 where the second interaction
occurs. One notices that most of the electrons near the an-tenna region are already heated so that the dispersion relation for the Langmuir mode has been modified.
H. Usui et al.: Numerical simulations of a three-wave coupling occurring in the ionospheric plasma 7
Fig. 6. Successive emissions of ES waves in the case of θ = 0. The left and right panels show the excited ES waves and electron temperature,
respectively. The first emission takes place around et ∼11 and Xe/Cv ∼ 2. Consequently, electrons are heated and the three-wave
matching condition is no longer satisfied. Then the plasma cools and a new interaction can occur around et ∼15.5. and Xe/Cv∼6.
The pump wave intensity E0/|BextCv|is equal to 2.5.
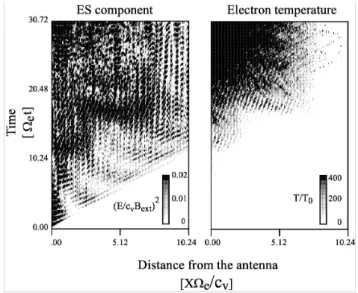
4.2 Perpendicular case
We examined a case where Bext is along the y direction
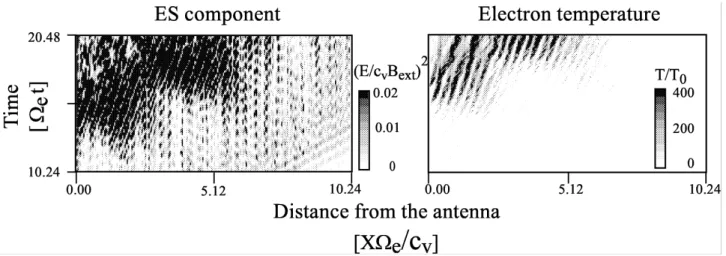
which is perpendicular to both the directions of the pump wave propagation and the current oscillation of the antenna. Figure 8 shows the profiles of the ES component and the as-sociated electron temperature in the same manner as in Fig. 4. Panel (a) shows that the three-wave coupling occurs intermit-tently, not continuously in space, as described in the paral-lel case. We find two main bursts of field excitation around et ∼ 12 and 16. Unlike the parallel case, the third
inter-action is hardly seen in the profile. At the antenna region, we also observe an intense ES perturbation which is not di-rectly associated with the three-wave coupling process. We will discuss this generation in a later section. At the later time after the second interaction, the ES field is intensified and the profiles becomes incoherent.
In the perpendicular case, the wave modes which are re-sponsible for the coupling process are either ordinary or ex-traordinary mode for the EM component and one of the wave branches in the electron cyclotron harmonic (ECH) waves for the ES one. Although not displayed, the Fourier analy-sis shows that the ES waves are excited near the upper hy-brid resonance (UHR) frequency which is very close to the plasma frequency in the present plasma parameters. Namely, the UHR branch in the ECH waves is responsible for the present three-wave coupling.
A big difference from the parallel case is found in panel (b) for the electron temperature. Corresponding to the first and second interactions, electrons are heated by the excited ES waves, which is similar to the parallel case. However, the heating rate is much larger than that in the parallel case: the electrons are heated with almost no delay in the ES wave ex-citation around et ∼ 12 and 16 for the first and second
interactions, respectively. After the first and second
interac-tions, unlike the parallel case, heated electrons do not prop-agate away from the antenna region. The electron heating continues at a fixed region 0 < Xe/Cv<6. Moreover,
ac-cording to the linear dispersion analysis, it is shown that the UHR branch of the ECH waves, unlike the Langmuir wave, is less affected by the variation of the electron temperature (see Matsumoto et al., 1995, Fig. 7). As a result, the condi-tion required for the three-wave coupling is not easily vio-lated by the electron heating and the interaction periodically takes place in the manner as previously shown in the time variation of the three-wave coupling in Fig. 1. As a result, electrons near the antenna region are continuously heated. 4.3 Time variation of the pump wave energy
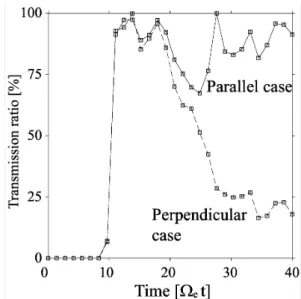
Figure 9 shows the transmission ratio of the pump wave energy detected at the end of the simulation system (Xe/Cv =10.24) as a function of time. Solid and dashed
lines indicate the energy variations for the cases where Bextis
parallel and perpendicular to the simulation system, respec-tively. In both cases, the wave front reaches the observation point around et ∼10 since it propagates at almost Cv(see
Fig. 3). Since a fraction of the pump energy is consumed for the generation of the ES components which accompany the EM propagation prior to the three-wave coupling taking place, the transmission ratio of the EM waves is not 100%. As time elapses, approximately from et ∼ 20 to 27, the
transmission ratio decreases and reaches about 70% of the initial pump energy for the parallel case. The decrease in the pump wave energy is caused by the consumption in the cou-pling process: the EM wave profile displayed in panel (a) of Fig. 4 shows the decrease of the EM waves which is obviously found in the upper region of the panel (approxi-mately after et ∼ 20) and spread obliquely along the
Fig. 7. Phase diagrams of electrons in a plane of Vxversus x at
dif-ferent times: (a) et =14.08 (b) 16.64, and (c) 19.20. The velocity
values are normalized to the initial thermal velocity of electrons.
waves which propagate in the forward direction are weak-ened at the region where the first ES burst is found around 0.5 < Xe/Cv <2.5 and 12 < et <16. Then the
weak-ened pump waves propagate with Cvand reach the end of the
simulation system around 22 < et < 26. Moreover, the
second interaction which occurs around 3 < Xe/Cv < 5
and 16 < et <20 also weakened the pump waves because
the first and second interactions occur approximately on the same propagation line, as shown in panel (b) of Fig. 4. This situation causes the large drop of the pump wave energy ob-served at et ∼25 in panel (a) of Fig. 9.
In the parallel case, the transmission ratio of the pump waves recovers because further three-wave coupling be-comes difficult due to the change in the plasma condition by the temperature increase. In the perpendicular case, however, the transmission ratio keeps decreasing and drops down to approximately 20%. This occurs because the coupling con-tinuously occurs, even if the local electrons are heated by the excited ES waves. Eventually a large amount of pump en-ergy is consumed for both the excitation of ES waves and the electron heating in the coupling process in the present model. 4.4 ES enhancement with the speed of light
In Fig. 4, we see an ES component propagating with Cvprior
to the three-wave coupling process. The electric field
com-Fig. 8. Excited ES component and associated electron temperature
for a case where Bextis along the y direction which is
perpendic-ular to both directions of the pump wave propagation and current oscillation of antenna. The intensity of the pump wave is constant and equal to E0/|BextCv| =2.5.
ponent Ezof the pump wave induces a displacement of
elec-trons in the z direction. The associated Vz, when combined
with the wave By, induces a displacement in the x direction,
which generates an Exfield. Namely, Vz×Bycauses the Ex
component along the simulation system. This second order effect is important only when Ez and By are strong. In the
parallel mode, this electric field perturbation is supported by the Langmuir waves at the plasma frequency. In the ω − k diagram shown in Fig. 3, this component is observed at the region where the line of Cv crosses the plasma frequency.
When we reduce the intensity of the pump waves, the non-linear terms becomes weak and the resulting electric field component will disappear.
In the perpendicular case, where Bext is along the y
di-rection, this nonlinear effect is emphasized because Bext is
added to the above By. In panel (a) of Fig. 8, intense ES
com-ponents are observed in the vicinity of the antenna. 4.5 Comparison with a real experiment
In a true three-wave coupling experiment in the ionospheric plasma, the pump wave frequency is several GHz, while the local plasma frequency is of the order of MHz. This fre-quency ratio is more than two orders larger than the one we adopted in the current numerical experiments. For instance, the ratio of the pump wave frequency to the plasma frequency is approximately 3 in the present study, while it is about 400 in an ionospheric plasma. Although not shown here, the growth rate of ES waves excited in the three-wave cou-pling is inversely proportional to the pump wave frequency. This implies that the growth rate of the ES waves is much re-duced in the real experiment. In the present study, ES waves
H. Usui et al.: Numerical simulations of a three-wave coupling occurring in the ionospheric plasma 9 are strongly excited in a couple of time intervals of the
elec-tron gyroperiod which is roughly equal to one µs. Since the growth rate is reduced in the real experiment, the time inter-val needed for the ES wave excitation can be several hun-dred µs.
In a situation of a large frequency ratio, we can have a large parallelogram for the three-wave coupling in a ω − k diagram. In this case, excited low-frequency ES waves have a wavenumber approximately twice as large as the wavenum-ber of the pump wave. Since the wavelength of the pump wave is approximately 10 cm, the wavelength of the cor-responding ES wave can be around 5 cm. Meanwhile, the Debye length in the Low-Earth Orbit (LEO) is several mm, which is much smaller than the wavelength of the above ES waves. This implies that the excited ES waves are less af-fected by Landau damping.
In a real experiment, ram/wake regions are created by the relative motion of the spacecraft to the ionosphere. In the LEO, ions are responsible for the plasma density variation at the ram/wake regions due to the small thermal velocity. Ac-cording to the present study, the coupling process itself is not influenced by the ion dynamics. However, it may be possi-ble that the three-wave interaction is affected by the change of the background density which is due to the ion dynamics. Since this analysis is beyond the scope of the present study, we will leave it as future work.
5 Summary
In order to study the nonlinear wave/wave-particle inter-action associated with the microwave power transmission (MPT) in space plasmas, we performed one-dimensional simulations with the electromagnetic PIC model. In the present study, we particularly focused on the spatial variation of the coupling process which is difficult to examine theoret-ically.
In the simulation space filled with magnetized plasma, we continuously emit intense electromagnetic waves from an an-tenna located at one edge of the simulation system. When the electromagnetic pump waves are intense enough, a three-wave coupling occurs, which is the result of a nonlinear inter-action between the forward and backward propagating high-frequency electromagnetic waves and a low-high-frequency elec-trostatic wave propagating in the forward direction. The re-sults show that a fraction of the electromagnetic waves emit-ted from the antenna are backscattered by the background plasma, which induces electrostatic waves at the plasma fre-quency. In the parallel case, the induced ES waves corre-spond to the Langmuir mode. The ES waves cause elec-tron heating and the local plasma condition changes. Conse-quently, the three-wave coupling is weakened and the pump EM wave can propagate through the background plasma with little attenuation. Then the second interaction takes place in a different region. Due to the electron heating again by the ex-cited ES waves, the electron temperature has increased over-all so that the plasma condition required for the next
three-Fig. 9. Pump wave energy detected at the end of the simulation box
(Xe/Cv=10.24) as a function of time. Up to et =20, the two
profiles are approximately the same. But in the perpendicular case, the coupling process can continue since the ECH waves propagation characteristics are not very sensitive to the plasma temperature. The transmission of the pump wave is therefore much reduced.
wave coupling is not satisfied. As a result, the transmission ratio of the pump wave is maintained at around 90 − 100% in this case. In the perpendicular case, however, the responsible ES wave is a UHR mode of the ECH waves. Since the UHR mode is less sensitive to the electron temperature, the three-wave coupling process continues periodically in time, even if the temperature increases. As a result, electrons are contin-uously heated and the temperature becomes much more than that of the parallel case. Eventually, approximately 20% of pump energy can propagate through the simulation system because most of the pump energy is consumed in the three-wave coupling process.
As a next step, we need to perform two-dimensional sim-ulations with a model in which microwaves are emitted with an array antenna. By controlling each phase of the array an-tenna, we can make a focal point of the microwave power at a certain region in the two-dimensional simulation space. By using this model, we will be able to examine the three-wave coupling process in a more realistic situation in terms of the diffusion of the heated electrons and the dependence of the interaction on the angle between the microwave propagation and Bext. Preliminary results of such a study will be reported
in another paper.
Acknowledgements. We are grateful to Naoki Shinohara for the
dis-cussion on the active MPT experiment planned with the exposed facility of the International Space Station.
References
Carlson, Jr., H. C. and Duncan, L. M.: HF excited instabilities in space plasma, Radio Sci., 12, 1001, 1977.
Duncan, L. M. and Behnke, R. A.: Observations of self-focusing electromagnetic waves in the ionosphere, Phys. Rev. Lett., 41, 998, 1978.
Fejer, J. A.: Ionospheric modification and parametric instabilities, Rev. Geophys. Space Phys., 17, 135, 1979.
Glaser, P. E.: Power from the sun: its future, Science, 162, 857, 1968.
Kaya, N., Matsumoto, H., and Akiba, R.: Rocket Experiment METS Microwave Energy Transmission in Space, Space Power, 11, 267, 1993.
Kaya, N., Matsumoto, H., Miyatake, S., Kimura, I., Nagatomo, M., and Obayashi, T.: Nonlinear interaction of strong microwave beam with the ionosphere: MINIX rocket experiment, Space Solar Power Rev., 6, 181, 1986.
Matsumoto, H.: Numerical estimation of SPS microwave impact on ionospheric environment, Acta Astronaut, 9, 493, 1982. Matsumoto, H., Hashino, Y., Yashiro, H., Shinohara, N., and
Omura, Y.: Computer Simulation on Nonlinear Interaction of Intense Microwave with Space Plasmas, Electronics and Com-munications in Japan, Part3, 78, 89, 1995.
Matsumoto, H. and Kimura, T.: Nonlinear excitation of electron cy-clotron waves by monochromatic strong microwave: computer simulation analysis of the MINIX results, Space Solar Power Rev., 6, 187, 1987.
Nishikawa, T.: Computer Experiments on Nonlinear Interactions of Intense Electromagnetic Waves with the Ionospheric Plasma, Master’s thesis, Dept. Electrical Eng., Kyoto University, 1999. Perkins, F. W. and Goldman, M. V.: Self-focusing of radio waves in
an underdense ionosphere, J. Geophys. Res., 86, 600, 1980. Perkins, F. W. and Roble, R. G.: Ionospheric heating by radio
waves; predictions for Arecibo and the satellite power station, J. Geophys. Res., 83, 1611, 1978.