Development and Application of a Lubricant
Composition Model to Study Effects of Oil
Transport, Vaporization, Fuel Dilution, and Soot
Contamination on Lubricant Rheology and Engine
Friction
by
Grace Xiang Gu
B.S.,
Mechanical Engineering
University of Michigan, 2012
M AAHUSETTS INSTITUTE OF TECHNOLOGYAUG1
52014
LI
-ARIES
Submitted to the Department of Mechanical Engineering
in partial fulfillment of the requirements for the degree of
Master of Science in Mechanical Engineering
at the
MASSACHUSETTS INSTITUTE OF TECHNOLOGY
June 2014
@
Massachusetts Institute of Technology 2014. All rights reserved.
Signature redacted
A u th o r ...
Department of Mechanical Engineering
Certified by...
Signature redacted
Signature
May 09, 2014
Victor W. Wong
Prin 4al Research Scientist
redacted
Thesis Supervisor
A ccepted by ...
...
DWvid Hardt, Professor of Mechanical Engineering
Chairman, Department Committee on Graduate Theses
Development and Application of a Lubricant Composition
Model to Study Effects of Oil Transport, Vaporization, Fuel
Dilution, and Soot Contamination on Lubricant Rheology
and Engine Friction
by
Grace Xiang Gu
Submitted to the Department of Mechanical Engineering on May 09, 2014, in partial fulfillment of the
requirements for the degree of
Master of Science in Mechanical Engineering
Abstract
Engine oil lubricants play a critical role in controlling mechanical friction in internal combustion engines by reducing metal-on-metal contact. This implies the importance of understanding lubricant optimization at the piston ring-cylinder liner interface. Lubricating oil composition varies along the liner and throughout the engine. Com-position changes occur due to degradation, vaporization, mixing during ring passage, fuel dilution, particulate matter contamination, and combustion gases getting onto the liner causing wear and erosion. These chemical and physical properties change oil composition and in-situ oil properties. The objective of this thesis is to discuss the development of an oil composition model to determine rheological properties at critical rubbing surfaces due to oil transport, vaporization, fuel dilution, and soot contamination. This study will specifically focus on the oil on the cylinder liner be-cause the interaction between piston assembly and cylinder wall is where most of the mechanical friction originates.
The first physical process discussed is oil mixing due to piston movement. Axial mixing analysis shows that mixing only occurs when the piston ring is above the oil particle location. Flow rates are calculated at each liner position from using piston speed, film thickness, and pressure gradient parameters. From this basic model of oil transport, chemical processes are applied to each species in each different liner location.
For the process of vaporization, due to high temperatures near the top dead center of the piston, light volatile hydrocarbons vaporize and leave the system. Light carbon number species disappear at a faster rate due to their high volatility and vaporization rates. This results in retention of heavier hydrocarbon species near the top zone of the cylinder liner model. Vaporization rates for different species in each liner location are obtained by looking at individual vapor pressures, mass transfer coefficients, and
other oil properties.
The link between composition and viscosity is a blending equation. The Arrhe-nius blending equation is used to calculate mixture viscosity from the summation of different species composition and component viscosity values. A combination of composition results shows that near the top dead center or top zone, the viscosity is higher than just considering temperature effects on oil viscosity. The impact of this vaporization component shows that the addition of a non-volatile oil species near the top dead center of the cylinder liner has the ability to flatten the species viscosity versus liner location curve.
Other rheology applications were studied for effects of fuel dilution, additive con-centrations, and also soot contamination. This new oil composition model solves for in-situ compositional changes for different oil species due to different physical and chemical processes along the cylinder liner. This change in composition causes a change in viscosity of the overall mixture which is solved for with blending equations. Then from mixture viscosity values, friction and wear can be calculated to optimize the lubricant for fuel efficiency.
Thesis Supervisor: Victor W. Wong Title: Principal Research Scientist
Acknowledgments
My time here at MIT and the Sloan Automotive Lab has been incredible. There has
not been a single day that I did not learn something new either from a classroom, professor, or friend. A number of people have helped make my experience here at MIT more enjoyable and fruitful. I would like to take a moment to acknowledge those who influenced my time here.
I would like to first thank Dr. Victor Wong who gave me the opportunity to
work on this project. I learned a lot from him and his expertise in lubrication is unsurpassed. Dr. Wong taught me how to break down problems and think through them in a logical way. He also led me to great resources and always had time to discuss presentations, papers, and research analysis. I am extremely grateful to have had the opportunity to work with Dr. Wong.
Our project partners, Infineum and Kohler. Jai Bansal and Marianne Devine, were essential to the success of my project, giving advice when I needed it most. Bob Linndorfer from Kohler also gave me great insight on my project. I would like to also thank the other project partners who attended our meetings to discuss ideas and data. I would also like to thank the US Department of Energy for their financial support of this program by Cooperative Agreement DEEE0005445, especially Dr. Steve Prezesmitzki and Nicholas Damico who attended our quarterly report meetings. Several other people from the Sloan Automotive lab have also helped me personally and professionally: Tianshi Fang, Yang Liu, Mathieu Bernier, Camille Baelden, Kevin Cedrone, Tomas Vianna Martins, Mark Moleywk, Mike Plumley, Tim Murray, Justin Kamp, Alex Sappok, Pasquale Totaro, Eric Zanghi, Qing Zhao, Eric Senzer, Michael Bahr, and Kai Liao. I would also like to thank Janet Maslow for doing a excellent
job keeping the lab in line and for being a great friend to me over the past two years. I would also like to thank all my good friends at MIT who have impacted my life
and given me a great experience! My friends always made me smile after a rough day and have been a great support system. Leslie Regan, Joan Kravit, and Una Sheehan from the Mechanical Engineering department were extremely helpful during my time at MIT.
I would also like to thank friends from outside MIT, my best friend Claire Wilke
for lending a listening ear whenever I needed it and overall wishing me the best. Thank you for always being there for me all these years since elementary school!
Finally, I would like to thank my family for their support. My father who is an impassioned engineer himself for giving me inspiration, my mother who has become my best friend in the world and whose kindness and love is indispensable, my brother who is studying mechanical engineering at Northwestern University and is the most supportive brother I can ask for, and my grandmother who has given me all the love in the world. I am extremely thankful to have such a wonderful family.
Contents
Abstract
Acknowledgements
1 Introduction
1.1 Importance of Friction on Engine Efficiency 1.2 Optimizing Lubricant Formulation . . . .
1.3 M otivation . . . .
1.4 Composition Modeling Background . . . .
1.5 Extended Applications . . . . 2 Model Description
2.1 Engine Specifications . . . . 2.2 Engine Oil Modeling . . . . 2.2.1 Initial Oil Composition . . . . 2.2.2 Model Specific Initial Oil Composition
2.3 Engine Zonal Modeling . . . .
2.3.1 Zone Definition . . . .
2.3.2 Focus on Ring Pack Zone . . . .
2.4 General Equation for Oil Composition Model.
3 Oil 3.1 3.2
Transport
Oil Transport Due to Piston Movement . . . . Top Ring Oil Film Thickness . . . .
3.2.1 Top Ring Parameters . . . .
4 5 15 . . . . 16 . . . . 17 . . . . 18 . . . . 19 . . . . 23 25 . . . . 25 . . . . 26 . . . . 26 . . . . 27 . . . . 28 . . . . 28 . . . . 29 . . . . 3 1 33 34 35 36
3.2.2 Force Balance . . . .
3.2.3 Fully Flooded Top Ring Results . . . . .
3.3 Starvation Model . . . .
3.3.1 Oil Control Ring . . . .
3.3.2 Oil Film Thickness Results . . . .
3.4 Leading and Trailing Heights . . . . 3.5 Hydrodynamic Lubrication . . . .
3.6 Flow Rates . . . . 3.7 Oil Displacement . . . .
3.8 Amount of Mass Moved/Transported . . . .
3.8.1 Oil Composition Change Due to Mixing
4 Vaporization Modeling
4.1 Properties of Oil Species . . . .
4.1.1 Distillation Curve . . . . 4.1.2 Molecular Weight Calculation . . .
4.1.3 Liner Temperatures . . . . 4.1.4 Vapor Pressure of Oil Components
4.1.5 Binary Diffusion Coefficient . . . .
4.1.6 Mass Transfer Coefficient . . . . 4.1.7 Vaporization Rate Calculation . . .
4.2 Composition Changes Due to Vaporization
5 Rheology Application
5.1 Oil Rheology . . . .
5.1.1 Stribeck Curve . . . .
5.1.2 Significance of Viscosity Parameter
5.2 Temperature Effects on Viscosity . . . . .
5.3 Introduction to Blending Equations . . . .
5.3.1 Composition Values . . . .
5.3.2 Types of Blending Equations . . . .
36 38 39 39 40 41 42 46 47 47 49 51 . . . . 5 1 . . . . 5 2 . . . . 5 2 . . . . 5 3 . . . . 5 4 . . . . 5 5 . . . . 56 . . . . 57 . . . . 57 59 . . . . 60 . . . . 60 . . . . 6 2 . . . . 6 2 . . . . 6 3 . . . . 64 . . . . 65
5.4 Determination of Viscosity Temperature Curves 5.4.1 Kinetic Gas Theory . . . . 5.4.2 Heavier Alkanes are Solids . . . . 5.4.3 Extrapolation of Data . . . .
5.5 M odel Inputs . . . .
5.5.1 Oil Specifications . . . .
5.6 Results on Viscosity Variations . . . .
5.6.1 Temperature Effects . . . .
5.6.2 Vaporization Effects . . . .
5.6.3 Combination of Temperature and Vapori zatio
. . . . 66 . . . . 66 . . . . 67 . . . . 67 . . . . 67 . . . . 67 . . . . 68 . . . . 68 . . . . 68 n Effects . . . . 69 6 Other Applications 6.1 Additive Concentration Modeling . . . . 71 71 6.1.1 Experimental Data of Additive Co 6.1.2 Modeling Approach . . . . 6.1.3 6.2 Fuel 6.2.1 6.2.2 6.2.3 6.2.4 6.2.5 6.2.6 6.2.7 6.2.8 6.3 Soot 6.3.1 6.3.2 6.3.3 ncentratior Simulation Results . . . . Impingement on Oil Composition . . . . Introduction . . . . Late Injection Effects on Fuel Dilution . . . Dilution Levels . . . . Fuel Dilution Impact on Engine Oil Viscosity Modeling Fuel Impingement Method . . . . Model Assumptions . . . . Fuel Dilution Results on Viscosity . . . . Validation of Fuel Dilution Results . . . . . Contamination . . . . Introduction . . . . Soot Formation . . . . Soot Oxidation . . . . s . . . . 72 . . . . 73 . . . . 74 . . . . 75 . . . . 75 . . . . 76 . . . . 76 . . . . 76 . . . . 78 . . . . 78 . . . .. . . 80 . . . . 81 . . . . 83 . . . . 83 . . . . 83 . . . . 84
6.3.5 6.3.6 6.3.7 6.3.8 6.3.9 6.3.10 6.3.11 6.3.12 6.3.13 Dispersants . . . . Effects of Exhaust Gas Recirculation . . . .
Soot and Viscosity Changes . . . . Soot Modeling and Assumptions . . . . Soot Balance . . . . Empirical Data . . . . Oil Oxidation . . . . Einstein Equation Approximation . . . . Combined Effects of Soot and Oil Oxidation
7 Conclusions 7.1 Summary . . . . 7.2 Future Work. . . . . . . . . 86 . . . . 87 . . . . 88 . . . . 88 . . . . 89 . . . . 90 . . . . 91 . . . . 92 . . . . 94 95 95 97
List of Figures
1-1 Passenger car energy consumption breakdown shows 38% of fuel energy
used for mechanical power to overcome friction and air drag [11] . . . 16
1-2 Roughly half of energy loss from piston ring-pack zone from engine friction losses . . . . 17 1-3 Increase in temperature causes decrease in kinematic viscosity of oil . 19
1-4 Distribution of evaporation rate along liner highest for region close to after TD C [14] . . . . 20
1-5 Composition of synthetic oil for various species [14] . . . . 20
1-6 Effect of engine load on different consumption sources and on total oil shows different contributions of oil transport, evaporation, and blowby
[26] . . . . 2 1
1-7 Mass fraction of liquid oil calculated at the start of every cycle shows
highest for heavier species [5] . . . . 22
1-8 Mass fraction after steady state for heavier species is greater than initial
com position [5] . . . . 22
1-9 Processes that change oil composition in time and space add complexity
to m odel . . . . 23
2-1 Lubrication circuit for Kohler KDW702 engine (from Kohler engine m anual) . . . . 27
2-2 Different zones in the engine communicate with each other . . . . 29 2-3 Volatile Loss mostly originating from ring pack zone and not from
2-4 cylinder liner oil divided into individual different zones to determine composition at each position . . . . 30 2-5 Composition equation to solve for change in mass m, depicting
vari-ables i for the current zone,
j
for the zone in front of the current zone, k for the specific species . . . . 303-1 Mechanism for oil transport zoomed in on top ring and includes differ-ent driving mechanisms [3] . . . . 34
3-2 Oil Transport Methods . . . . 35 3-3 Force balance between contact force, hydrodynamic oil force, gas
pres-sure force, and tension force . . . . 37
3-4 Combustion gas pressure P1 and pressure in region between the rings
P 2 . . . . 38 3-5 Fully flooded top ring film thickness model shows increasing
hydrody-namic regime with decreasing surface roughness . . . . 39 3-6 Oil control ring has a flat profile as opposed to top ring's curved profile
[4 ] . . . . 4 0
3-7 Starvation model shows lower film thickness for top ring than fully
flooded m odel . . . . 41
3-8 Control volumes used to solve for film thickness profiles . . . . 42
3-9 Film thickness underneath the ring at each position . . . . 43
3-10 Pressure and pressure gradient for crank angle 375 degrees shows
vary-ing pressures across the piston rvary-ing and different profiles for each crank angle . . . . 45
3-11 Flow rate equations underneath the ring shows the impact of pressure
gradient, heights at each position, and ring profile on the amount of mass flux at each boundary . . . . 46
3-12 Axial velocity curve shows four changes in mass flow rates, otherwise
3-13 Oil displacement of a particle moves when ring drags it along oil film
and stops moving when ring is no longer near it . . . ..48 3-14 Percentage of mass moved compared to total mass in each zone for
each cycle . . . . 48
3-15 Oil supply rate calculated from flow rate underneath oil control ring . 49
4-1 Distillation Curve shows a spread of 580K to 820K for boiling points for 15W 40 . . . . 52
4-2 Liner temperature variation on cylinder liner with highest temperature at TDC (200'C) and lowest temperature at BDC (800C) . . . . 53
4-3 Curve of vapor pressures of oil components as a function of oil
temper-atures shows higher vapor pressure for higher carbon number [5] . . . 54
5-1 Schematic of oil transport and vaporization effects on cylinder liner oil 60
5-2 Stribeck Curve shows three lubrication regimes: boundary, mixed, and hydrodynamic modes [15] . . . . 61 5-3 Experimental viscosity data of n-paraffins shows decreasing viscosity
with increasing temperature [13] . . . . 63
5-4 Viscosity curve for two different grades of oil using the Walther's formula 64
5-5 Oil species boiling point and molecular weight . . . . 68 5-6 Vaporization effects on oil rheology shows higher viscosity near the top
dead center than with only considering temperature effects . . . . 69
6-1 Simon Watson's experimental results for additive concentrations shows enrichment factors greater than unity for all elements [25] . . . . 72 6-2 Watson's sampling regions which include ring pack zone, valvetrain,
and sum p [25] . . . . 73 6-3 Zoom in figure on ring pack zone showing all three rings in detail [25] 73
6-4 Zone modeling approach compared to Watson's sampling regions . . . 74
6-5 Pie Chart with species breakdown for additives+hydrocarbons . . . . 74
6-7 Fuel dilution percentage comparisons for biodiesel and ULSD [27] . 77
6-8 Fuel impingement effects on viscosity for biodiesel and ULSD [27] . 78
6-9 Schematic with fuel impingement along entire cylinder liner . . . . 79
6-10 Diesel fuel components overlap with that of biodiesel at boiling points
3200C-3700C, with a boiling point of 3450 on average . . . . 80
6-11 Viscosity results from fuel dilution shows a 57% decrease in viscosity
near T D C . . . . 81 6-12 The addition of lighter fuel fractions causes a bigger drop in viscosity
due to fuel dilution . . . . 82
6-13 Simulation results show a good match with industry knowledge . . . 82
6-14 Contaminated soot oil on very right compared with clean oil on left . 84
6-15 SEM images of soot particles in oil [1] . . . . 85
6-16 Dispersants have a polar head with an oil-soluble hydrocarbon tail [22] 87
6-17 Kinematic Viscosity of oil samples at 40 and 90 degrees C at the
dif-ferent soot levels . . . . 89
6-18 Assumptions for soot modeling . . . . 90
6-19 Engine data shows an increase from 14 cST viscosity to 42 cST viscosity
for 9% soot content [1] . . . . 91
6-20 10% mass fraction of soot corresponds to a volume fraction of 0.05 . . 92
6-21 0.05 volume fraction of soot corresponds to a 12% increase in viscosity
according to Einstein's Equation. . . . . 93 6-22 Combined effects of oxidation and soot contamination shows an
addi-tional 180% increase in viscosity. . . . . 94
7-1 Future applications of oil composition can expand to other zones in the
List of Tables
2.1 Engine specifications for Kohler KDW702 engine . . . . 26
3.1 Top ring parameters used to solve for different forces in ring balance . 36
Chapter 1
Introduction
There are many different strategies to improve fuel economy in the automotive in-dustry. One strategy is to use engine oil to generate more efficient running engines. Engine oil viscosity can improve fuel economy when lowered in the formulation. Un-fortunately, engine oil viscosity tends to increase during the oil drain interval, which in turn is expected to decrease fuel economy. Lubricant formulation can be designed to resist such changes in viscosity through high quality base oils, antioxidants, and viscosity modifiers. Oil composition is one of the drivers that affect viscosity and therefore can be used as a lever to improve fuel economy of the engine.
High temperatures in the combustion chamber cause light/volatile hydrocarbons to vaporize and leave heavy hydrocarbons behind near the top dead center of the cylinder liner, resulting in oil composition variations in the power cylinder. Accu-mulation of heavy hydrocarbon oil near top of cylinder liner causes the viscosity to increase, showing that oil composition has effects on oil properties and friction. This paper will discuss the development of an oil composition model to determine lubri-cant composition due to interactions of contamination, vaporization, oil transport, and mixing on the surfaces of the piston and cylinder liner. The method of obtain-ing composition of a lubricant involves usobtain-ing different engine zones, different species, mass mixing rates, and physical and chemical processes as inputs. The model re-ports composition at different spatial locations and how it evolves with time. From composition, rheological properties such as viscosity can ultimately be determined at
EXHAUST
energ Totel
FUEL CoouG losses
ENERGY
100%# ...
MIECKA- FRWMcnt i
NICAL C LOSSES ~---E
POWER 33% UNERGY
uwmes THECARI
AM MAC5 1 2Jim
Figure 1-1: Passenger car energy consumption breakdown shows 38% of fuel energy used for mechanical power to overcome friction and air drag [11]
critical rubbing surfaces. Viscosity can then be utilized when attempting to lower the friction in the engine.
1.1
Importance of Friction on Engine Efficiency
Due to strict fuel economy requirements for the development of modern internal combustion engines, engine efficiency needs to be constantly improved. Improvement in engine efficiency in automobiles requires reduction of energy losses from exhaust, cylinder cooling, and mechanical losses. Mechanical power accounts for 38% of fuel energy use in an engine (Figure 1-1), where some of it used to overcome engine friction losses of 11.5%. Of the friction losses from the engine, 45% of it originates from piston ring-pack and cylinder liner assembly (Figure 1-2). Piston ring assembly is the area where almost half of the friction occurs and is definitely an area studied in terms of lowering friction. The rest of the energy losses lies in the valvetrain and auxiliary losses from operation of pumps and other engine operation components. As a result, decreasing mechanical friction provides opportunities in improving fuel economy [11].
Figure 1-2: Roughly half of energy loss from piston ring-pack zone from engine friction losses
1.2
Optimizing Lubricant Formulation
Engine oil lubricants play a critical role in overcoming mechanical friction in internal combustion engines by reducing metal on metal contact. This draws attention to the importance of understanding how to optimize lubrication at the piston ring-cylinder liner interface.
Lubricants consists of a base oil and various additives, which protect the engine and reduce the rate at which the engine oil degrades. Additives improve the perfor-mance of oil, increases its useful life, and add wear protection. Base oils make up most of the lubricant and additive packages typically account for 20-30% of the formulation and contain detergents, dispersants, pour-point depressants, viscosity modifiers, fric-tion modifiers, and anti-wear compounds (ZDDP). Dispersants help keep degraded oil from coagulating, so that the coagulated oil will not be able to block narrow lubricant passageways. A pour-point depressant allows the oil to flow at low tem-peratures. Viscosity modifiers help reduce a lubricants change in viscosity subject to changes in temperature. Modifiers consist of polymers and copolymers which uncoil at high temperatures to increase viscosity. ZDDP inhibits oil oxidation and protects
against wear [18].
Optimizing a lubricant to decrease friction and wear can be beneficial due to in-creasingly strict engine emission standards. This study focuses on how an oil compo-sition model can help determine what factors change the compocompo-sition of the lubricant
and the implications of it on oil rheology and friction to optimize the lubricant.
1.3
Motivation
Due to all the complex processes that can occur in the combustion chamber, com-positional effects from these chemical and physical processes on oil viscosity are not studied much and are unknown. Temperature effects on oil viscosity, however, is well understood. It is a well-known fact that temperature changes the viscosity of the oil. As the temperature increases, the viscosity decreases either using the famous Walther or Vogel Equation [19]. Figure 1-3 shows the temperature effects on kine-matic viscosity using Vogels equation for two different oils, SAE 10W30 and SAE 15W40. There is an order of magnitude difference along the liner due to temperature variations from 80'C to 200 C. However, it is important to note that oil composition will also change oil viscosity, which is why it is important to study both compositional
and temperature effects on oil rheology.
Lubricating oil composition varies along the liner and throughout the engine and can be used to solve for rheological properties of oil at critical rubbing surfaces. Com-position changes occur due to degradation, vaporization, mixing during ring passage, fuel dilution, particulate matter contamination, and combustion gases getting onto the liner causing wear and erosion. In addition, an oil composition model can predict the TBN or total base number of the oil. TBN measures the lubricants basicity, which aids in the control of acids formed during the combustion process. Oil is continuously exposed to acidic combustion gases, so controlling the base number is necessary to prevent the corrossion of the upper piston, piston rings, top end bearing and even valvetrain. Low TBN is related to reduced oil detergency and high basicity is re-lated to lowered oil performance. A balance is therefore necessary to guarantee a
80 70 *10W30 60 -4- 60 V v = ke(e n .w 15W40e2 50 40 - -1 - k(c) 01('C) j 2 (C) 0.14 $30s8 100. 30 "' &-I" "" tote ___0.115 921.2 10.2 20 W 10 n021 0.115 "" '0" E 10 ---- --- ---- ---10 -. O ~ ~ - ~ ~ --~- -~i -~ ~ ~ -~--- ----0 1T- ---0 100 200 300 Temperature (C)
Figure 1-3: Increase in temperature causes decrease in kinematic viscosity of oil
well-maintained engine
[3].
These chemical and physical properties change oil com-position and in-situ oil properties. To sum up, the process is complicated and needs to be organized in an oil composition model. An oil composition model is created to account for some issues to better understand how to optimize the lubricant to take into account compositional effects on oil properties to reduce friction and wear.1.4
Composition Modeling Background
The effects of compositional changes due to vaporization have been studied by a few authors, including Audette, Liang, Cho, and Yilmez [3][5][26][14]. These authors focused on oil transport and vaporization as a base for their model. None of these authors connected their research to oil rheology from composition, which is the basis of this research.
Audette presented a detailed derivation of the equations governing the instanta-neous evaporative heat flux of a species as well as a model for estimating vaporization and composition changes along the liner. He showed that the amount of vaporization from the liner is about 1.3 g/hr/cylinder, or about 10% of the total oil consumption
-- - -- DC Big - tempe ature -C varaton 47 cSt a Orders of Magnitude difference in viscosity 10 cSt along liner due to -1.5 cSt temperature variation
Sx 1 . I 166 9.4 U. e oi MEINEII A Cii*3 0 20 4 o so SO. .0. 120 1 pU I V is I' 1 IV IV
DOmemie to UMh Top "f) SPWAluwed
Figure 1-4: Distribution of evaporation Figure 1-5: Composition of synthetic rate along liner highest for region close oil for various species
[14]
to after TDC [14]
expected for the engine. He also discovered that vaporization is strongly dependent on liner temperature, steady state oil composition, and the parameters used internally to model the mass convection coefficient [3].
Liang created a model to estimate the effects of oil evaporation on the liner on oil consumption for a light diesel engine. He used the composition of synthetic oil with various carbon numbers and mass fractions depicted in Figure 1-5. His results showed that the total evaporated oil over a complete cycle was 0.175 mg, with the four lightest species adding up to 70% of the evaporated oil. The distribution of evaporation rate along the cylinder liner, the region around the lower range of the dry region, has the highest evaporation rate and contributes most to total oil evaporation (Figure 1-4). Inside the dry region shown in the figure, although the liner temperature increases as the axial location gets closer to the liner top, the evaporation rate decreases because it becomes more difficult for fresh oil to be transported into the upper region. The fresh oil is easier to reach and lubricate near the lower bound of the dry or starved region [14].
Yilmez also discussed composition changes due to volatility of oil [26]. He mentions that higher piston temperatures reduce the oil viscosity, and therefore may change the oil transport along the piston. Moreover, higher liner temperatures will increase oil evaporation. His experiments showed that the lightest oil species was found to
T300
0 250 Total oil consumption 200 150 100 Oil transport
8
50 EvaporatIon Blowby55 0
0 25 50 75 100 Load [%]Figure 1-6: Effect of engine load on different consumption sources and on total oil shows different contributions of oil transport, evaporation, and blowby [26]
contribute around 35% to the total oil evaporated. The four lightest constituents make up almost 80% of the evaporated oil, which is a significant amount. Therefore, because of the limited oil supply and the evaporation of lighter species at severe high load and liner temperatures, fresh oil from the sump may not be able to refresh the oil over a larger region of the liner in each cycle. At high liner temperatures, volatile species of the oil on the liner deplete due to high evaporation rates. Then the oil composition on the liner may change and differ from the oil composition in the sump. This change in composition of the oil on the liner is governed by the ring liner lubrication oil transport rates along the liner, and by the evaporation rate from the liner. Yilmez also remarks that oil consumption is made of three main things: oil transport, evaporation, and blowby (Figure 1-6).
Cho created a liquid oil transport model that integrated oil vaporization to in-vestigate the change of oil composition on the crown land with each engine cycle for different hydrocarbon species shown in Figure 1-7 and Figure 1-8 [5]. He also de-termined in his modeling that during the engine cycle, there is a significant increase of heavy oil components while the light fractions tend to decrease and the medium heavy oil components stay relatively constant.
evap-La o6A nd - -" 20 So do e n COs.Nubr
Figure 1-7: Mass fraction of liquid oil calculated at the start of every cycle shows highest for heavier species [5]
oration of oil in reciprocating engines [24]
0.5*-OIA i 0.3-0.1 0.1-1 2 3 4 56 7 1 9 101112131411617181 221 light - d - heavy
Figure 1-8: Mass fraction after steady state for heavier species is greater than initial composition [5]
The model is based on conservation of mass and energy on the surface of the oil film left on the cylinder by a piston ring pack. He discusses transport and oil consumption methods:
1. Transport
(a) Accumulation of differential oil scraped up and down by rings
(b) Oil scraping: Oil film left by ring pack on cylinder
(c) Entrainment of oil into and dispersed oil flow with inter-ring gases
2. Throw-off
(a) Throw-off of oil accumulated above top ring due to inertia effects
(b) Evaporation from oil film on cylinder surface
(c) Return into cylinder of oil mixed with inter-ring gases
These specific authors employ methods that describe oil transport and evaporation which are involved with studying changes of composition. Since other chemical and physical processes are not coupled in this composition literature, there is more to study and understand in a more complete version of what is happening to cylinder liner oil during engine operation.
1700 rpm. s f/hr oil upply, oyihctic (heavy) oil. 325 dqpew C. cnwn I
#21 (heaviest c mPonOW)
##19 #0
1700rp, S brou py,aynuekic Comy)oil,325depe.C.
carIn
Saisiimm SUctilufalIngU
laii m helwlh-42eae
Vaporization Oil throw-off GasWP Absorption Fuel dilution 0 T-5 E Degradation loxidation Particulate -T Entrainment Oil supply
Figure 1-9: Processes that change oil composition in time and space add complexity to model
1.5
Extended Applications
Most of the composition background included applications such as oil transport and vaporization. However, what sets this research apart is the extended applications in addition to oil transport and vaporization. The modeling of fuel impingement and soot contamination is unique and has not been done in literature as of yet. Empirical studies of soot contamination and fuel dilution on oil viscosity exists, but the coupled modeling of these processes does not. This study presents many extended applications of the oil composition model and couples many different processes (Figure 1-9). It is important to have a more complete model of what is going on in the combustion chamber because some processes can have a big effect on the rheology of oil and cannot be left out.
Chapter One discussed the motivation and some background research concerning
existing composition models. Chapter Two describes the modeling procedure to
cal-culate composition of species in different areas within the engine. It will discuss oil transport due to piston movement. Chapter Three addresses the modeling approach of vaporization process. Chapter Four covers the base calculation of viscosity through blending equations. Chapter Five introduces the connection between composition and
viscosity through the blending equation. Chapter Six discusses the applications of additive concentration, fuel impingement, and soot contamination. Results for each applications are discussed in detail as well. Chapter Seven presents a summary of the results and also potential future work for this model.
Chapter 2
Model Description
As a first step in modeling the composition of the oil, the engine oil was modeled as being composed of several distinct paraffin hydrocarbons. The cylinder liner oil is focused on and divided into several regions. Details of the base modeling approach is discussed in this chapter. Engine Specifications for the Department of Energy (DOE) project engine is introduced first.
2.1
Engine Specifications
The main goal of the program is to optimize lubricant formulations to enhance engine efficiency in modern internal combustion engines. The program is split into three phases and involves optimizing different subsystems of the engine. The author works on optimizing the power cylinder subsystem.
The engine used in this study is a light-duty Lombardini engine supplied from Kohler (KDW702 model). It is approximately 700 cm3 with peak cylinder pressure of 50 bar and engine parameters shown in Table 2.1. The lubrication circuit for the Kohler engine is shown in Figure 4.1. In terms of the lubricant used in this engine, Lombardini recommends that lubricating oil viscosity be selected based upon the highest temperature expected. In normal applications, the lubricating oil viscosity selection is based upon the seasonal temperature ranges expected for the engine ge-ographical territory. The use of straight weight lubricating oil such as SAE 40, SAE
Parameters Value Units
Bore 75 mm
Stroke 77.6 mm
Displacements 686 cm3 Compression ratio 22.8:1 n/a
Speed 3600 RPM
Cylinders 2 No.
Maximum Torque 37 Nm Oil comsumption 9 g/hr
Table 2.1: Engine specifications for Kohler KDW702 engine
30 is not recommended for Lombardini diesel engines.
2.2
Engine Oil Modeling
Engine oil is composed of base stocks and additives. Base stocks are the main con-stituent of the engine oil and are generally hydrocarbons, which are either paraffinic, naphthenic, or aromatics. Additives constitute up to 20% of engine oil and contain hydrocarbons and metallic components [10]. This section discusses the inputs of initial oil composition and zones of this composition modeling.
2.2.1
Initial Oil Composition
Lubricants are a complex mixture of components that are used to maximize the level of protection to engine components. They consists of a hydrocarbon base oil, viscosity modifier, and an additive package. The base oil alone cannot provide all the functions required and additives make up what base oils cannot do.
Species in the model could include anything that makes up the oil. Species could include hydrocarbon base oil which is composed up carbon and hydrogen. The Amer-ican Petroleum Institute designates several types of lubrAmer-icants in Groups I, II, III, IV, and V. Base oil can also be classified as paraffinic, naphthenic, and aromatic. Specific types of paraffins include alkanes and alkenes.
122
13 - 5
-6
14-2 Rocker shaft 10 Casuaf
3rCeM2-L ict d pin 110ru preohler DairWe
4 0OMwfileratrde 12 Oipump
6 Journal 13 Crurk&*mdt * 04 drain plug 1U Od suclios Mwt
7 04 dipstick
8 Bleed
Figure 2-1: Lubrication circuit for IKohler KDW702 engine (from Kohler engine man-ual)
subjected to changes in temperature. One type of viscosity modifier is olefin co-polymer (OCP) which usually consists of molecular weights in the 70,000 g/mol range, which is vastly greater than the ranges of 100-200 g/mol for hydrocarbons [15].
Additives serve to protect the base oil and examples include dispersants, anti-wear additives, friction modifiers, and detergents. These additives contain different elements that can also be modeled as a species such as calcium, magnesium, zinc, phosphorus, barium, sodium, lead, and potassium [25]. An oil composition model with the right input parameters for different species in the oil can track the compo-sitional changes in space and time of all oil species.
2.2.2
Model Specific Initial Oil Composition
For this model, the base initial oil composition is modeled as a compound of several different paraffin hydrocarbon components with different liquid-phase mass fractions and boiling points. Properties such as molecular weight, vapor pressure, and gas-phase mass fraction of each oil component were then obtained in order to calculate
the vaporization rate of each oil component from the liquid oil film.
Mass fractions in the liquid oil and boiling points of synthetic and mineral oil corresponding to the points on the distillation curve. This is the initial composition in each zone on the cylinder liner. The initial composition contains equal fractions of each alkane in each zone and the zones in detail are discussed in the next subsec-tion. The base oil composition will be made up of serveral paraffins. With different applications, this oil package is tweaked to fit a certain criteria which will be shown in Chapters Five and Six in which specific applications will be discussed. If additives are added, they will be added of a lesser amount than the pure hydrocarbons.
2.3
Engine Zonal Modeling
In addition to inputting species information into the model, other inputs include which zones inside the engine are considered. This section discusses the possible zones that could be modeled and which ones specifically will be discussed in the following chapters.
2.3.1
Zone Definition
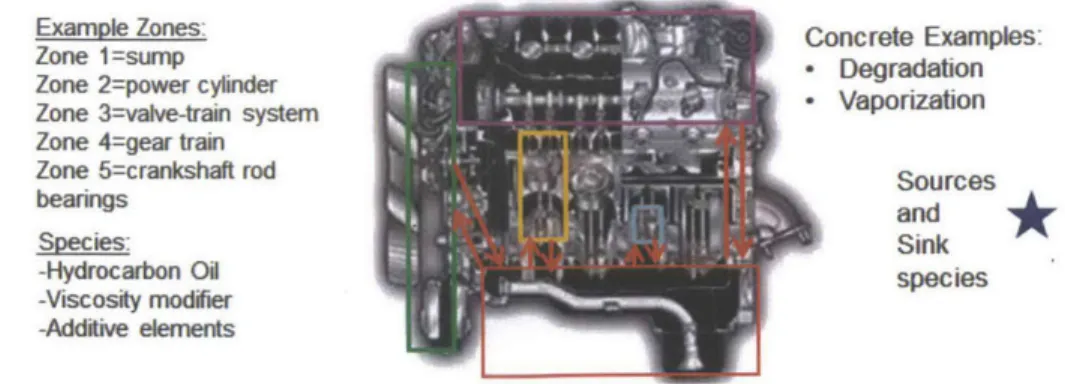
Zones used in a composition model could be any subsystem within the engine. Such areas could include valve-train, piston ring pack, bearings, crankshaft (Figure 2-2). Due to different operating conditions, oil composition in all these different zones is different. For instance, the valve-train does not experience the same harsh operating conditions as the piston ring pack and therefore does not experience vaporization or fuel dilution. The temperature range for valvetrain is around 100 C while that of the power cylinder is approximately 200'C. The valve-train also contributes about 15% of total friction while that of the piston ring pack contributes to about 45% of the total friction.
For this model all these different zones communicate with each other. The sump brings fresh oil to the piston ring pack and also sends oil to the valve-train system. The valve-train and power cylinder drip oil back into the sump. This
communica-Example Zones: Concrete Examples:
Zone 1=sump Cn- E a ples.
Zone 2=power cylinder Varization
Zone 3=valve-train system porion
Zone 4=gear train
Zone 5=crankshaft rod Sources
bearings and
Species Sink
-Hydrocarbon 0i0 species
-Viscosity modifier -Addftve elements
Figure 2-2: Different zones in the engine communicate with each other
tion causes contaminated oil from the piston ring pack to be sent to the valve-train. Different zones are used to track how the composition of the species change through time and space.
2.3.2
Focus on Ring Pack Zone
The focus of this thesis in terms of zones will be within the power cylinder ring pack zone. Of all mechanical friction within the internal combustion, 40-60% occurs because of the interaction between the piston assembly and the cylinder wall, with a large proportion occuring at the top compression ring/cylinder liner interface. This interface is purposely almost starved of lubricant in order to control exhaust emissions. As a result, facilitating friction reduction at this location is incredibly difficult.
This zone is also focused on because this is where most volatile losses occur (Figure
2-3). This area is also where the most oil is needed. Shown below is a schematic of the
volatile losses that originate mostly from the ring pack block instead of the crankcase block [25]. For this model, the cylinder liner oil is focused on and split into ten zones (Figure 2-4). The first zone being the area on the liner that is closest to the top dead center (TDC), and the last zone being the area on the liner closest to the bottom dead center (BDC). Each zone has a certain fraction of different species and the addition of all fraction of each species in each zone will add up to one.
Intake Air Fuel Flow (64) Flow (rh)
-Combuston Chamber
AWNl"I~ Concentrat~on A E;hut lw M ,
Volatile LOS (6h) Bulk Loss (Mb)
focus
-Ni Return (rh) (Oil Supply (ON)
I Crankcase Crankcase Additive Concentration AcI
Vnt (rn,)
Figure 2-3: Volatile Loss mostly orig-inating from ring pack zone and not from crankcase or combustion chamber
[25]
dm(k)
dt
x x) a fnt ickness profie x Pcylinder T( TDC c) Liner temperature Segments on linerFigure 2-4: cylinder liner oil divided into individual different zones to deter-mine composition at each position
L L
=~~~~
-y* ..+ Y*$
+ souce
-
k
j=1
j=1
outgoing
mass
incoming mass
Species
Disappeared
flow
flow
generated
species
Figure 2-5: Composition equation to solve for change in mass m, depicting variables
i for the current zone,
j
for the zone in front of the current zone, k for the specific species2.4
General Equation for Oil Composition Model
The general equation for the oil composition model uses mass balance in which there is outgoing and incoming mass flow due to piston movement (Figure 2-5). When mass is transferred, the composition of the previous zone gets moved to the new zone. There is also a component of the species generated or the 'source' term such as degraded species due to the process of degradation and disappeared species or the 'sink' term such as the process of vaporization. During the process of vaporization, light hydrocarbon species disappear and act as a sink term due to the high tempera-tures near top dead center. This equation can be extended to many other applications such as fuel dilution, combustion gas absorption, and also soot contamination. Fuel impingement on the cylinder liner is a source to the zone because it is adding fuel to the system. Soot getting into the oil is also a source for the zone. In the rheology and applications Chapter Five and Six, this equation will be utilized to calculate the new oil composition over time for a specific species in a specific zone on the cylinder liner.Chapter 3
Oil Transport
During an engine cycle, the composition of the oil film on the liner changes due to evaporation and ring passage. The calculation of the change of oil composition due to ring passage is associated with the lubrication of the piston ring-pack. The ring pack consists of three rings: top ring, scraper ring, and oil control ring. All three rings serve different purposes. The top two rings help control blow-by and regulate the gas flows in the ring pack. The oil control ring controls the oil film thickness left on the liner, which lubricates the top two rings and plays a role in controlling engine oil consumption.
The piston rings move up and down the cylinder liner are one method of oil trans-port. There are actually many mechanisms that cause liquid oil to be moved around in the Piston-Ringpack-Liner system (Figure 3-1). Driving mechanisms include in-ertia, ringpack gas flows, pumping motions by rings, scraping of oil from the liner
by the rings, and carrying of oil along the liner by the rings. Paths for oil transport
include transport along piston lands, through ring gaps, into and out of ring grooves, and along the cylinder liner [3] [26]. Given that several mechanisms can drive oil along each of the several paths, quantifying oil transport in this system is very complicated. This chapter will discuss the oil transport component of the model which includes an understanding of oil film thickness, oil displacement, and flow rates.
30 LOW
Oil
Transport Driving Mechanisms:
CW Coni
1
Inertia
2.
Reverse gas
flows
3.
Ring pumping
4.
Ring scraping
5.
Ring dragging
Figure 3-1: Mechanism for oil transport zoomed in on top ring and includes different driving mechanisms [3]
3.1
Oil Transport Due to Piston Movement
Scraping and dragging of oil on the cylinder liner are two mechanisms of oil transport. Dragging occurs because oil attaches itself to the ring face as the ring moves up and down the liner (Figure 3-2a). The oil attachment occurs because it is assumed that there is a no-slip condition between the oil layer and the ring face. As a result, oil is dragged up and down the liner as the ring itself moves up and down the liner. At any given moment in time, a certain volume of oil is trapped under the ring face and is being carried with the ring. To calculate the amount of oil attached to the ring face (and, therefore, oil transported by carrying), calculate the volume of oil under the ring face and then, to account for the amount of oil not moving with the ring face, subtract off the volume of oil left on the liner after the ring passes. The remaining volume is defined as the carried oil.
(a) Dragging due to piston move- (b) Scraping of oil is the
accumula-ment carries oil from one region of tion of oil in front of the ring and the cylinder liner to another scraps it to another region
Figure 3-2: Oil Transport Methods
Scraping occurs when the oil on the liner floods the leading edge of the ring face
(Figure 3-2b). Scraping rate is the rate of oil being removed from the cylinder liner
when the leading edge is flooded minus the change in volume being dragged [3]. Due to the complexity of scraping, dragging will be the main mechanism discussed in this model. An addition of scraping mechanism can be included in the future model. Preserving oil mass conservation ensures a precise oil transport simulation and lays a solid base for oil transport and oil consumption analysis. Conservation of mass will
be discussed along with lubrication theory, oil displacement, oil film thickness, and
oil renewing.
3.2
Top Ring Oil Film Thickness
To calculate oil displacement and flow rates, oil film thickness at each crank angle is an essential input. To calculate oil film thicknesses, a fully flooded model for the top
profile ring is modeled and analyzed first. A fully flooded model assumes that the
wetting area is the entire ring width. This specific model will tend to overestimate oil
film thickness underneath the ring and therefore oil consumption. This section will discuss the development of a fully flooded ring model and then the next section will
Profile Ring Parameters Value Units
Ring Width 2 mm
Surface Roughness 0.1 micrometers
Ring Tension 10 N
Modulus of Elasticity 200 GPa Poisson's Ratio 0.285 n/a
Table 3.1: Top ring parameters used to solve for different forces in ring balance
3.2.1
Top Ring Parameters
All three rings have different parameters. .The top ring parameters are shown in Table 3.1. These parameters will come into use when determining the contact force, tension
force, and hydrodynamic force.
3.2.2
Force Balance
To solve for the top ring film thickness profile, the force balance for the top ring needs to be studied (Figure 3-3). The different forces that act on the top ring include contact force, hydrodynamic oil force, gas pressure force, and tension force. These forces will be discussed below in more detail. After the forces are solved for each crank angle, the model checks if these forces all add up to zero, and if it doesn't, the program iterates through by trial and error with different film thickness values.
Contact Force
The contact pressure is solved by using Greenwood Tripp's contact model for the given ring parameters such as surface roughness [9]. The final equation for contact pressure uses the integrated contact pressure across the ring profile, in which is shown in the equation below:
h = 8.284(x - 0.001)2 + ho (3.1)
where h is the height at a certain x coordinate and ho is the height underneath the ring or the minimum film thickness. At each crank angle, a minimum film thickness will be guessed and plugged into this equation to iterate through the program.
Combustion Chamber
P1
Piston P2
Region between the Rings
Figure 3-3: Force balance between contact force, and tension force
K
Radial Force Balance:Fgas + Ftension + Fcontact + FOi = 0
Fgas = from groove gas pressure
Frensian = from ring tension
Fcanract = from contact pressure
F11 = from hydrodynamic pressure
force, hydrodynamic oil force, gas pressure
Hydrodynamic Oil Force
The hydrodynamic pressure is solved for using the Reynold's equation in the method similar to what Tian employed [21]. The pressure is integrated across the ring profile following a similar method used in the contact force calculations. The greater the hydrodynamic oil pressure, the greater the film thickness. The curved profile of the top ring gives it higher hydrodynamic oil pressure as opposed to having a flat profile.
Gas Pressure
The gas pressures are shown as P1 and P2 in the force balance. P1 is the pressure in the combustion chamber and P2 is the pressure in the region between the rings. The pressure curves for both pressures are shown in Figure 3-4. It is assumed that P1 dominates and that the ring resides on the bottom of the groove at most crank angles. The gas pressure force is represented as Fgas = P1 x B x r x Bore, where B is the ring width and Bore is the bore of the piston.
9.E+06 8.E406 P1 6.E406 6.E406 Pressure 51E406 [Pa] 4-E406 3.E+06 2.E+06 1.E+06 0.E400 0 100 200 300 400 500 600 700 800 Crank Angle
Figure 3-4: Combustion gas pressure P1 and pressure in region between the rings P2
Tension Force
The tension force is represented as Ftensi,, in the force balance diagram. The greater the tension force in the top ring, the smaller the film thickness. The ring tension for the top ring is 10 N. Therefore the total tension force is a constant and is a total of
10 x 2 x 7r.
3.2.3
Fully Flooded Top Ring Results
Top ring results are shown in Figure 3-5. Using a variation of surface roughness, it can be noted that the hydrodynamic regime of lower surface roughness is higher than that of the higher surface roughness. The hydrodynamic regime is usually the regime greater than 4 times the surface roughness. For instance, with a surface roughness of 0.1 micrometers, the hydrodynamic regime is the film thickness greater than 0.4 micrometers of film thickness. During the power stroke, there are lower film thicknesses due to the high gas pressures during combustion. The other three strokes have relatively similar minimum film thickness under the ring. The next section will discuss a starvation model in which the wetting area of oil underneath the piston ring is not the entire ring width, but is only a portion of it.
3.0 - 0.1 microns -0.5 microns 2.5 -0.7 microns 2.0 Film Thickness 1.5 [microns] 1.0 0.5 0.0k 0 100 200 300 400 500 600 700 800 Crank Angle
Figure 3-5: Fully flooded top ring film thickness model shows increasing hydrody-namic regime with decreasing surface roughness
3.3
Starvation Model
For the fully flooded model shown earlier, it is assumed that the entire area under-neath the top ring is exposed to oil. In reality this does not happen, hence a starvation model is also analyzed. To develop such a model, the oil control ring also needs to be studied in addition to the top ring. Chen developed correlations for the top ring and also the oil control ring hydrodynamic oil pressure
[4].
This section will discuss parameters used for the oil control ring, correlations used for hydrodynamic oil force, and results for the starvation model.3.3.1
Oil Control Ring
Oil control ring profile is different from that of the top ring. It no longer has the curved profile of the top ring that gives it higher hydrodynamic pressure. Additionally, it does not have gas pressure because it is assumed that the top ring does a good job in sealing the combustion gases. As a result, the only forces on the oil control ring are tension force, hydrodynamic force, and contact force. The tension force used for the oil control ring is 20 N. The contact model is the same as the top ring without the
TLOCR Land
Land Width
=0.2mm
Figure 3-6: Oil control ring has a flat profile as opposed to top ring's curved profile
[4]
curved integrated profile. The hydrodynamic pressure closely follows the correlation and parameter's used in Chen's model [4]. In addition, the top ring's hydrodynamic oil profile also uses the correlation in Chen's modeling, in which case one of the input parameters is the oil control ring film thickness as the oil supply to the top ring.
3.3.2
Oil Film Thickness Results
The oil control ring minimum thickness and top ring's minimum thickness profile are calculated from the methods discussed above (Figure 3-7). Looking at the oil control ring results, all the profiles look relatively similar as opposed to the top rings oil film thicknesses. The reason for this is the lack of gas pressure acting on the ring for the oil control ring. It is assumed that the top two rings do a good job sealing the combustion gases. At most crank angles, the oil control ring film thickness is greater than that of the top ring because it acts as an oil supply to the top ring. Again, the top ring has smaller power stroke film thickness values because of the high gas
0 .3 5 w -r -- - --- T 1 111 Il -0.30 1 0.25 Film Thickness 0.20 [microns] 0.15 0.10 -0.05 0 150 3C -OCR -- Profile )0 450 Crank Angle
Figure 3-7: Starvation model model
shows lower film thickness for top ring than fully flooded
3.4
Leading and Trailing Heights
To determine the leading and trailing heights, control volume analysis was used (Fig-ure 3-8). The box highlighted on the left of the fig(Fig-ure is the control volume 1 and the box highlighted on the right of the figure is the control volume 2. The trailing height, htraiiing, is the height of the oil behind the ring when the ring passes a certain
position and htraiing is the height of oil in front of the ring. The equations to solve for the heights are shown below:
1 p - htrailing - Vaverage -hring =h ring - width
at 2
hh ring - width
r42 ~Vp -htrailing + Vaverage -hring =a- 2
(3.2)
Vp 1 OP h2
Vaverage 2 ring
where rh1 and rn2 are the control volume change in mass quantities, V is the piston
velocity, Vaverage is the average velocity at the location right below the ring tip, hring
is the height underneath the tip of the ring, a is the change in height over time,
ringwidth is the width of the ring, which in this case is 2 mm.
750
piston ring
Li L.
Figure 3-8: Control volumes used to solve for film thickness profiles
There is an initial oil film thickness during the intake stroke and the ring first follows this profile along the cylinder liner. After the first stroke is over, the ring reverses direction and sees the profile the ring left behind and traces a new profile as it moves along the previous profile. This process repeats for the power and exhaust stroke. This follows closely the simulation created by Tian et al [21].
3.5
Hydrodynamic Lubrication
Lubrication theory describes the flow of fluids in the situation that one dimension is significantly smaller than the others. In the case of lubricating oil on the cylinder liner, the oil film thickness h is much smaller than the length L that the oil extends to on the liner ((h/L) < 1). Different types of lubrication exists in different engine regimes. In this section, hydrodynamic lubrication and the assumptions and equations related to it are discussed.
Hydrodynamic lubrication is the support of the a surface of oil pressure along without any direct surface contact. Ring liner system under hydrodynamic lubrication involves piston velocity U and also film thickness under ring h (Figure 3-9). The liner is expected to move in the opposite direction of the piston ring movement.
By applying the conservation of mass and conservation of momentum equations,
the velocity profile can be determined and then finally the volumetric flow rate can be determined. Due to the numerous variables in the conservation equations, some
![Figure 1-1: Passenger car energy consumption breakdown shows 38% of fuel energy used for mechanical power to overcome friction and air drag [11]](https://thumb-eu.123doks.com/thumbv2/123doknet/14731550.573097/16.918.125.745.111.397/figure-passenger-energy-consumption-breakdown-mechanical-overcome-friction.webp)
![Figure 1-3: Increase in temperature causes decrease in kinematic viscosity of oil well-maintained engine [3]](https://thumb-eu.123doks.com/thumbv2/123doknet/14731550.573097/19.918.139.769.120.437/figure-increase-temperature-causes-decrease-kinematic-viscosity-maintained.webp)

![Figure 3-1: Mechanism for oil transport zoomed in on top ring and includes different driving mechanisms [3]](https://thumb-eu.123doks.com/thumbv2/123doknet/14731550.573097/34.918.176.657.133.598/figure-mechanism-transport-zoomed-includes-different-driving-mechanisms.webp)


