HAL Id: ineris-00973670
https://hal-ineris.archives-ouvertes.fr/ineris-00973670
Submitted on 4 Apr 2014
HAL is a multi-disciplinary open access
archive for the deposit and dissemination of
sci-entific research documents, whether they are
pub-lished or not. The documents may come from
teaching and research institutions in France or
abroad, or from public or private research centers.
L’archive ouverte pluridisciplinaire HAL, est
destinée au dépôt et à la diffusion de documents
scientifiques de niveau recherche, publiés ou non,
émanant des établissements d’enseignement et de
recherche français ou étrangers, des laboratoires
publics ou privés.
Assessing the role of structure, location and emissions in
the impact of megacities on air quality in Europe
Guillaume Siour, Isabelle Coll, Augustin Colette, Bertrand Bessagnet
To cite this version:
Guillaume Siour, Isabelle Coll, Augustin Colette, Bertrand Bessagnet. Assessing the role of structure,
location and emissions in the impact of megacities on air quality in Europe. 8. International Conference
on Air Quality, Science and Application, Mar 2012, Athènes, Greece. pp.NC. �ineris-00973670�
ASSESSING THE ROLE OF STRUCTURE, LOCATION AND EMISSIONS IN THE IMPACT OF MEGACITIES ON AIR QUALITY IN EUROPE
G. Siour (1,2), I. Coll (1), A. Colette (2), B. Bessagnet (2)
(1) Laboratoire Interuniversitaire des Systèmes Atmosphériques (LISA), UMR CNRS 7583, Universities Paris-Est and Paris Diderot, Créteil, France;
(2) Institut National de l'Environnement Industriel et des Risques, INERIS, 60550 Verneuil en Halatte, France.
Presenting author email: guillaume.siour@lisa.u-pec.fr
ABSTRACT
Our works focused on the impact of megacities on oxidating pollution in Europe, depending on the size, location and possible structural evolution of the cities. By means of anthropogenic emissions sensitivity studies, we showed that the existence of high emitting countries/regions in Europe (BeNeLux in particular) prevails over the existence of large and dense cities for the determination of pollution gradients in Europe. Our results also indicate that the concentration of the urban built (by opposition to city spreading) may reinforce secondary pollution locally (through fast ozone production). However it has limited impact on the total quantity of oxidants produced over Europe. Finally, simulations with passive tracer emissions allowed us to conclude that city spreading over new territories could alter the geographical export pathways of pollutants from cities towards the rest of the continent.
INTRODUCTION
Since the last decade, megacities have been the focus of a growing attention of decision-makers and researchers in environmental sciences, as they concentrate most of the air quality issues throughout the world. Furthermore, they have been identified as significant contributors to the continental and global atmospheric pollutant background. The issue with megacities is not only related to their individual existence as hot spots for pollution, but also their increasing number and size: their propensity to continuously attract the surrounding populations indeed constitutes a strong obstacle to the sustainable development of urban areas over the continents. In this context, the most urgent questions to answer are those of their individual impact as a dense emission hotspot, and of their future impact on a continental scale within different scenarios of urban expansion.
The objective of our works was thus to answer to the following questions:
Can we expect a strong role of megacity size and structure on exported oxidant plumes, and on background ozone levels at the continental and global scale?
What is the impact of megacity sprawl versus megacity densification on oxidant pollution in Europe?
2. METHODOLOGY
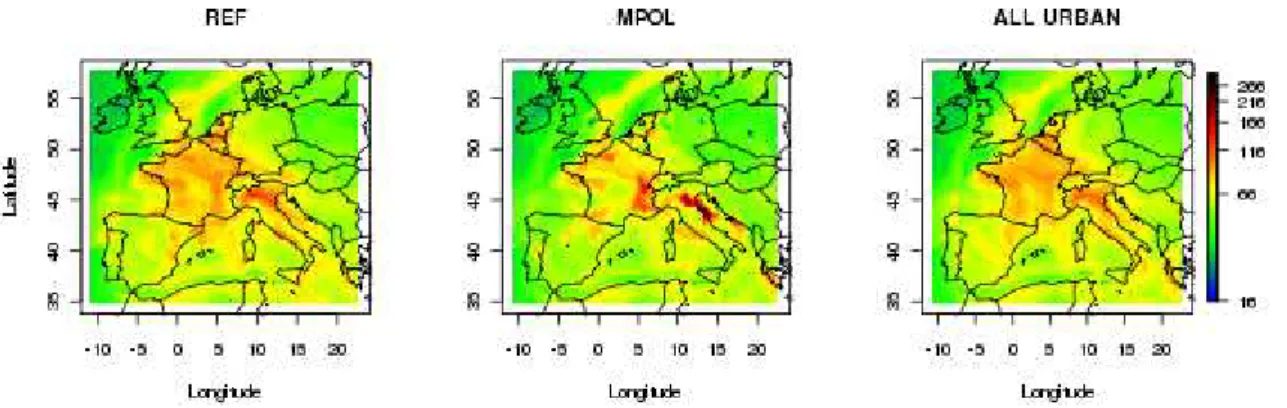
To perform this study, we ran the Chemistry-Transport Model CHIMERE (Bessagnet et al., 2005 ) over a summer period with different emission configurations. We first tested the effect of megacity existence on air pollution by concentrating the urban emissions of each country into a single megacity or by smearing them out over their national territory for all sectors. The emission structure thus appears under several forms, from very concentrated to very diffuse patterns. However, in each of these 2 scenarios, the same total mass of anthropogenic emissions as in the real situation is assigned to each country (see Figure 1). Simulations were performed for the whole summer 2005 (June, July and August), which was one of the MEGAPOLI focus periods. The reference case (real situation) is obtained using the original EMEP emissions (left graph).The “MPOL” scenario (at the centre) is associated with the most condensed emission configuration, and it opposes to the “All urban” scenario (right graph) associated with a larger spread of anthropogenic emissions: in the MPOL scenario, the emission intensity reaches up to 10+12 molecules.cm-2.s-1 while the maximum intensity is of about 10+10 molecules.cm-2.s-1 only in the All Urban scenario. These scenarios are designed to determine whether megacities tend to produce different pollution patterns at the regional and continental scale in Europe.
As a second step in our study, we aimed at reproducing a more realistic evolution of megacities, in order to quantify the difference between two possible future urban scenarios for European cities. We used the emission inventory provided by the TNO (Denier van der Gon et al., 2009) within the framework of the MEGAPOLI project. Through an analysis of the land use file (at a horizontal resolution of 300m) we distinguished the
city-centre (megacity itself) from the suburbs. Thus, we simulated either an increase of the density of city-city-centre anthropogenic activities (scenario “MPOL2”), or a city-spreading process associated with an increase of anthropogenic emissions in the suburbs (scenario “SUBURB”). The multiplication factor is calculated for each scenario so that the total increase in emissions is the same for both cases (factor of 2 for the MPOL2 scenario). Four megacities have been selected: Paris, London, the Po-Valley and the BeNeLux areas. At the continental scale, an increase by a factor of 2 in those megacity emissions represents 6% of increase in the total continental emissions. Figure 2 illustrates the difference in NO2 emission fluxes (molecules.cm-2.s-1) between each scenario and the reference case for a given time step of the simulation. As one can see, the resulting emissions are much more dense inside the megacities in the first scenario (left graph) and present a quite more diffuse pattern in the second scenario (right graph).
Figure 1 : NO2 emissions fluxes (molecules.cm-2.s-1) in the 3 scenarios: Reference case is shown at the left, MPOL scenario in the centre, and All Urban scenario at the right.
Figure 2: differences between the NO2 Emissions fluxes (molecules.cm -2
.s-1) of each scenario and the reference case. Left: MPOL2 scenario, right: SUBURB scenario.
3. RESULTS AND DISCUSSION
The first results (illustrated in Figure 3) show that the structure of European ozone concentration fields presents little variation between the different scenarios, and that – when pollution occurs – its large-scale features are quite independent on synoptic weather conditions. One of the main elements structuring ozone pollution over Europe actually appears to be the national anthropogenic emission distribution at the continental scale rather than local urban features. It is reinforced by well-known factors such as the biogenic emission distribution, deposition (through the landuse variability) and South-North meteorological gradients (temperature, photolysis rate values…). However, in polluted conditions, the formation of megacities always leads to a degradation of regional air-quality: intensification of the regional primary plume ozone concentrations, and increase in the ozone production rate by a factor of 1.5-2 in the most condensed scenario. From a geographical point of view, the megacity impact appears quite local as plumes from the MPOL scenario dilute quickly in the continental non-emitting atmosphere. The total simulated ozone over the whole domain is always lower than in the reference case. In the All urban scenario, the opposite trend is observed.
Figure 3 : O3 maxima (ppbv) in the 3 scenarios for 23/06/2005: Reference case at left, MPOL scenario in the centre and All Urban scenario at the right.
In order to investigate further these results, we averaged the H2O2 to Ox (O3+NO2) concentration ratio (Tonnesen and Dennis, 2000) calculated at 15:00 UT, over the whole summer period (June, July and August 2005) and for each scenario. The efficiency of this indicator to discriminate between NOx–limited and COV-limited regimes for ozone production has been demonstrated (Tonnesen and Dennis, 2000): if this ratio is lower than 0.02, the regime is considered as VOC-limited (or VOC sensitive), and reversely for NOx-sensitive regimes. The values of our calculated ratio are plotted on the map of Figure 4. In the reference case, we can define three regions:
The North-Western Europe area associated with a VOC-limited regime The Mediterranean region submitted to a NOx-sensitive chemical regime Mid-latitude Europe which corresponds to a transition between both regimes
Figure 4: Mean simulated H2O2 to Ox (O3+NO2) ratio at 15:00 UT, averaged over June to August 2005 In the MPOL scenario, the VOC-limited regimes are much more pronounced over urban areas (lower ratio) because all the NOx emissions are condensed in the megacities. Nevertheless we still observe the same continental scale spatial distribution of NOx excess in Northern Europe, most likely due to shipping emissions and to the high density of national emissions condensed in the small Benelux region whatever the scenario. For the All Urban scenario, the chemical regime gradients are smoother but the spatial gradient from South to North is still apparent. At this scale, the distribution of chemical regimes - and therefore the pollution patterns – are thus more influenced by the distribution of national emission totals than by the urban structure inside each country.
To quantify the impact of urban management within more realistic proportions, we analyzed the impact of scenarios MPOL2 and SUBURB on total continental ozone. We integrated O3 mass over the whole domain (including on the vertical) as a function of time. In the reference case, the total quantity of ozone within the domain is about 3.28 Tg with variations from 3.01Tg (25/08) to 3.62Tg, and with a typical diurnal ozone cycle (low amplitude compared to the total). The mean ratios of the MPOL and of the SUBURB scenarios to the reference case are close to 1 at each timestep but remain greater than 1 (about 1.0014 and 1.0016 respectively).
Thus, the increase in ozone titration in urban areas, due to the increase in NOx emissions, does not dominate when integrated at the continental scale. Moreover, the ratios of MPOL and SUBURB to the reference case always increase during pollution episodes. It indicates a non-linear increment of ozone production with emission change depending to the meteorological situation, but the total is always lower in the case of urban densification.
To assess the differences induced by our scenarios on pollution structure and on the primary pollution exported by the megacities, we tagged the CO emissions from 4 selected megacities (BeNeLux, London, Po-Valley and Paris). As previously mentioned, the same mass is emitted by each city in both scenarios. Figure 5 illustrates the mean distribution of tagged CO exported from the Po-Valley, for the whole summer period (left frame). The ratio between the MPOL and SUBURB scenario is shown on the right frame. The concentration is at its maximum (1000pbbv) in the emission area and decreases when transported afar. We can see that the main export pathway for Po-Valley is located to the East and South of this area, with mean concentrations of 10 ppbv. There are no differences between the 2 scenarios to the East and South of the Po-Valley. However, the MPOL scenario exports up to 10% more tagged CO by the North and 10% less at the West, and the ratio exceeds 1.5 towards the North, due to a different geographical emission distribution (Figure 2). City sprawl may thus affect the export of primary pollutants towards other parts of Europe. The consequences of this phenomenon are currently under study.
Figure 5: Mean concentration of tagged CO (ppbv) emitted from Po-Valley (left frame) and tagged CO ratio between the MPOL and SURBURB scenarios (at the right).
4. CONCLUSIONS
The simulations performed in this study have shown that ozone formation areas in Europe are quite insensitive to the geographical structure of anthropogenic emissions within countries. The predominance of ozone chemical regimes at a location is indeed mainly driven by prevailing atmospheric dynamics, deposition and local biogenic emissions, but also by the distribution of countries with a high rate of urbanization. On the reverse, at the regional level, the effect observed during the densification of emissions in urban areas is a significant increase in local ozone gradients, which characteristics strongly depend on the local meteorology and its tendency to favour (or not) ozone production. Finally, city evolution planning may also affect the export of primary pollutants towards other parts of Europe, although not always over the major export pathways of a city.
5. REFERENCES
B. Bessagnet, A. Hodzic, O. Blanchard, M. Lattuati, O. Le Bihan, H. Marfaing, et L. Rouil.: Origin of particulate matter pollution episodes in wintertime over the paris basin. Atmospheric, Environment, 39(33): 6159_6174, 2005.
Coll I., Siour G. and Beekmann M.: How do Megacity structures affect their regional and continental atmospheric impacts?, European Geosciences Union General Assembly, Vienna, Austria, 14 April 2008.
H. Denier van der Gon, A. Visschedijk, H. van der Brugh, R. Droge, et J. Kuenen. A base year (2005) megapoli european gridded emission inventory (1st version). 2009.
M. Soviev, M. Prank, J. Kukkonen, J. Vira, A. Segers, P. Builtjes, H. Denier van der Gon, U. Korsholm, I. Gonzales-Aparicio, R. Nuterman, A. Mahura, A. Baklanov, S. Pandis, C. Fountoukis, A. Tsimpidi, V. Karydis, et M. regional modelling teams: Evaluation and improvement of regional model simulations for megacity plumes, megapoli scientific report 11-04. 2011.
Tonnesen, G. S.; Dennis, R. L.: Analysis of radical propagation efficiency to assess ozone sensitivity to hydrocarbons and NOx 1. Local indicators of instantaneous odd oxygen production sensitivity. Journal of Geophysical Research-Atmospheres 2000, 105, (D7), 9213-9225.