Does Energy Follow Urban Form?
An Examination of Neighborhoods and Transport Energy Use in Jinan, China
By
Yang Jiang
Master of Engineering in Urban Planning and Design, Tsinghua University, 2007 Bachelor of Architecture, Tsinghua University, 2005
Submitted to the Department of Urban Studies and Planning and the Department of Civil and Environmental Engineering in partial fulfillment of the requirements for the degrees of
Master in City Planning and
Master of Science in Transportation at the
MASSACHUSETTS INSTITUTE OF TECHNOLOGY June 2010
© 2010 Massachusetts Institute of Technology. All Rights Reserved
MASSACHUSTS INS E OF TECHNOLOGY
JUN 2
3
2010
LIBRARIES
ARCHIVES
Author IDepartment#{Jrban Studies an P ' ng and Department of Civil and Environment(17ngineering
May 19, 2010 Certified by
Certified by
Assistan(Prdfessor P. Christopher Zegras Department of Urban Studies and Planning Thesis Supervisor
Research Scientist, Jinhua Zhao Dep4 ment of Civil and Environmental Engineering
T Reader
Accepted by
Frotessor Daniele~Veneziano Chairman, Depart ntal Committee for Graduate Students Accepted by
Professor Joseph Ferreira Chair, MCP Committee Department of Urban Studies and Planning
Does Energy Follow Urban Form?
An Examination of Neighborhoods and Transport Energy Use in Jinan, China
By
Yang Jiang
Submitted to the Department of Urban Studies and Planning and the Department of Civil and Environmental Engineering on May 19, 2010 in partial fulfillment of the requirements for the
degrees of
Master in City Planning
and
Master of Science in Transportation
at the
MASSACHUSETTS INSTITUTE OF TECHNOLOGY
Abstract
This thesis explores the impacts of neighborhood form and location on household transportation energy use in the context of Jinan, China.
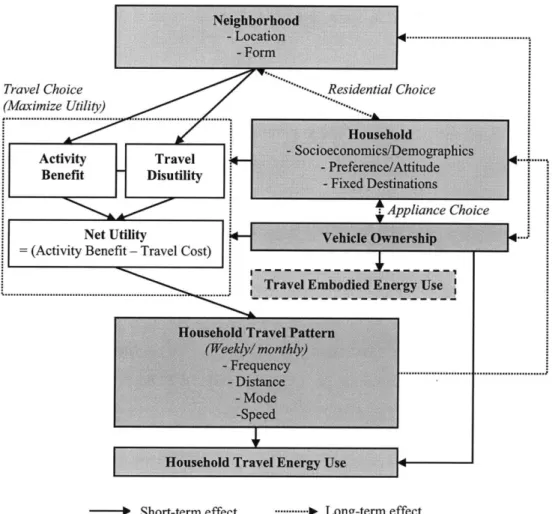
From a theoretical perspective, energy use is a derived outcome of activities, and households choose their travel patterns to maximize net utilities subject to constraints of time, budget and means. Neighborhood features presumably could 1) in the short-term directly influence households' choices of their travel patterns by changing incurred trip costs (disutilities) and realization benefits (positive utilities) among alternatives; 2) in the long-term indirectly influence patterns by affecting households' attitudes and their choices of vehicle ownership, both taken into account in the short-term utility maximization process. However, due to other complicating interactions among different aspects of travel patterns and other factors (e.g., housing choice), we cannot a priori determine what the impact of neighborhood on household travel energy use will be.
This research takes an empirical approach to examining the relationship between the neighborhood and household travel energy use in Jinan, China, using 9 neighborhoods representing four different urban form typologies commonly found in Chinese cities: "traditional", "grid", "enclave", and "superblock." Data on neighborhood forms and households are obtained from visual survey, GIS digitalization and a household survey. Household transport energy uses (and greenhouse gas emissions) are derived from self-reported household weekly travel diaries. Descriptive analysis, multivariate regression analysis (i.e., OLS, TOBIT), and advanced two-step instrumental models (i.e., LOGIT+OLS/TOBIT) are employed.
Results show that, all else equal, households living in the "superblock" neighborhoods consume more transportation energy than those living in the other neighborhood types, as they tend to own
more cars and travel longer distance. The proximity to transit corridors and greater distance from the city center also apparently increase household transport energy use, although both impacts are somewhat minor, partially due to offsetting effects on car ownership. A number of effects of household socioeconomics, demographics and attitudes on transport energy use and car ownership are also identified.
Overall, the analysis suggests that to help chart a more energy-efficient Chinese urban future, policymakers and urban designers should examine past neighborhood designs in China to find alternatives to the "superblock", focus on strategic infill development, possibly encourage e-bike use as substitute to larger motorized vehicles, improve the efficiency of public transport, and examine preference-shaping possibilities to influence more energy efficient lifestyles.
Thesis Supervisor: P. Christopher Zegras
Title: Assistant Professor, Department of Urban Studies and Planning Thesis Reader: Jinhua Zhao
Acknowledgements
I would like to gratefully acknowledge the China Sustainable Energy Program of the Energy
Foundation-Beijing Office, for sponsoring the "Making the Clean Energy City in China Project", under which the research presented in this thesis was carried out. Besides this, my thesis would not have been possible without the support, instruction and encouragement of many people both at MIT and my home China.
At MIT, I feel fortunate to have Chris Zegras as my thesis advisor. He has been a great mentor in transforming me from an urban designer towards a transportation expert and disciplined researcher. Every piece of this thesis was influenced by him. I also thank Jinhua Zhao, my thesis reader, for playing a critical role beyond a "reader" in my thesis. Frequent meetings with both of them have solved many puzzles I faced during my research design, statistical analysis and thesis writing.
I am grateful to have Professor Dennis Frenchman, as my academic advisor. He introduced me to
MIT and offered tremendous help over the past three years. He truly cared about my needs and interests, and open-mindedly supported me to explore fields of transportation and energy in addition to urban planning and design.
I thank Yang Chen for her long-standing support from the beginning of the project. As a close
research partner, she made tremendous efforts on cleaning data, performing part of the GIS analysis, and discussing methodological issues with me. I also thank Mi Diao and Weifeng Li for their conversations with me on modeling techniques and assistance with some ad-hoc GIS problems. I thank Cristian Angelo Guevara for offering advice on my instrument models.
On the China side, I thank Dongquan He, who kindly accepted me as an intern at the Energy Foundation-Beijing Office in summer 2008. My first-hand experience on exciting local projects and communication with international experts (e.g., Paulo Custodio) during that time triggered my deep interest in land use-transportation connection from an energy perspective. I hope my coming career with him after graduation will lead to more achievements in practice and benefit Chinese cities.
I would like to acknowledge faculty and students from Shandong University, Beijing Normal
University and Tsinghua University as local partners in this project. Particularly, I thank Prof. Zhang Ruhua and Ms. Zuo Weiwei in Jinan for guiding a high quality household survey and data entering; and Prof Zhang Lixin and Mr. Zhang Tao in Beijing for their leading efforts on the GIS database building for my studied neighborhoods.
Most importantly, I thank my parents for their love, endless support and encouragement. Till now, I have received so much from them in my life while giving little back. This thesis is dedicated to them.
Finally, I thank Yulin, my dear new wife, for her love, understanding and wordless long-distance support in every moment I had at MIT over the past three years. This thesis is also dedicated to her. Yulin, you are my angel!
TABLE OF CONTENTS
TABLE OF CONTENTS...--... ---... 7
1 INTRODUCTION ... .... - ... 17
1.1 M otivation...- -... --... 17
1.1.1 Rocketing Transport Energy Use in China: A Challenge...17
1.1.2 Supply-Side Mitigation Strategies in China: An Inadequacy ... 18
1.1.3 Urban Form and Design to Reduce Travel Demand in China: A Potential ... 21
1.2 Thesis Context: "Making the Clean Energy City in China"...22
1.3 Research Objectives...23
1.4 Research Questions ... .... 23
1.5 Research Approach ... 23
1.6 Thesis Structure... ... 24
2 LITERATURE REVIEW ... 26
2.1 Neighborhood Features for Transport Energy Reduction: Advocates from Designers...26
2.2 Empirical Precedents in the Developed Countries...29
2.2.1 Empirical-analytical M ethods... 30
2.2.2 R esults...-.. . ---... 32
2.2.3 Comments ... 40
2.3 Relevant Empirical Precedents in China...42
2.3.1 H ypothetical C oncepts ... ... 42
2.3.2 Em pirical Studies ... ... 42
2.3.3 Com m ents ... ... ... 44
2.4 Sum m ary ... . ---... 45
3 THEORETICAL PERSPECTIVES ON HOUSEHOLD TRAVEL ENERGY D EM A N D ...- - .. ---...- - ... ---... 47
3.1 A Conceptual Fram ew ork ... 48
3.1.2 Cost-based Fram ework ... 49
3.1.3 A ctivity-based Fram ework... 50
3.1.4 An Updated Fram ew ork... 50
3.2 The Generic Impacts of Neighborhood Features on Travel Energy Use ... 53
3.2.1 Neighborhood Design: Higher Density, Diversity & Traffic Calming ... 54
3.2.2Neighborhood Location: Proximity to a Transit Corridor ... 57
3.3 Additional Com m ents ... 60
3.4 Sum m ary ... 61
4 RESEARCH CONTEXT ... 62
4.1 Jinan City ... 62
4.2 BRT Corridor Developm ent in Jinan ... 67
4.3 N eighborhood Typologies in Jinan ... 68
4.3.1 The "Traditional" ... 69 4.3.2 The "Grid" ... 70 4.3.3 The "Enclave"... 70 4.3.4 The "Superblock"... 71 4.4 Sum m ary ... 72 5 RESEARCH DESIGN ... 73
5.1 N eighborhood Sample Selection... 73
5.2 M easures of N eighborhood Form ... 75
5.3 Household Survey Data ... 78
5.3.1 M easures of Travel Activity ... 78
5.3.2 Measures of Socio-Demographics and Vehicle Ownership...79
5.3.3 M easures of Household Attitudes ... 79
5.4 Household Transport Energy Use and Em ission Data... 80
5.4.1 Measure of Household Transport Energy Use Measure ... 80
5.4.2 Measure of Household Transport GHG Emissions... 82
5.5 Database Structure ... 83
5.6 Analytical Procedures and M odels ... 83
5.6.1 Descriptive Analysis ... 83
5.6.3 Multivariate Analysis: Advanced Two-Step Instrumental Models ... 89
5.6.4Multivariate Analysis: Sub Instrumental Models on Household Travel Distance by M ode ... . .... ---... 90
5.7 Sum m ary ...--- .. - ---... 90
6 DESCRIPTIVE ANALYSIS RESULTS...92
6.1 Neighborhood Forms ... 92
6.1.1 Cluster Analysis ... 92
6.1.2 Density Elements ... ... 93
6.1.3 Diversity Elements...95
6.1.4 Design Elements ... 96
6.2 Pattern of Socioeconomics and Demographics...97
6.3 Pattern of Vehicle Ownership ... 99
6.4 Pattern of H ousehold A ttitudes ... .. ... 101
6.5 Pattern of Household Travel Activity...102
6.6 Pattern of Household Transport Energy Use and GHG Emissions...105
6.7 Some Interactions...110
6.7.1 Energy Use vs. Household Incom e ... 110
6.7.2 Energy Use vs. Household Size and Car Ownership...112
6.7.3 Energy Use vs. Neighborhood Location...114
6.7.4 Energy Use vs. Household Attitudes ... 115
6.8 Sum m ary ...- - ... ---... 116
7 MULTIVARIATE ANALYSIS RESULTS ... 118
7.1 Base Regression Models on Household Transport Energy Use...120
7.1.1 OLS Models ... 121
7.1.2 TOBIT Models...124
7.2 Advanced Two-Step Instrumental Models on Household Transport Energy Use ... 127
7.2.1 Step One: Incorporating Household Vehicle Choice ... 127
7.2.2 Step Two: Household Weekly Transport Energy Use...135
7.2.3 Combined Effects: Overall Relative Influence of Neighborhood Characteristics 137 7.3 Sub Instrumental Models on Household Weekly Travel Distance by Mode ... 141
8 CONCLUSIONS AND IM PLICATIONS...148
8.1 Empirical Findings on Household Transport Energy Use in Jinan...148
8.2 Implications for Policy M akers...149
8.2.1 Rethink the "Superblock" Neighborhood Typology: Learn from the Past ... 149
8.2.2 Neighborhood Location M atters ... 150
8.2.3 Vehicle Ownership: Prom ote or Control?... ... ... ... ...151
8.2.4 Improve Transit Efficiency ... 151
8.2.5 Preference Shaping ... 152
8.3 Implications for Urban Developers and Designers ... 152
8.4 Implications for Transportation Dem and M odelers ... 154
8.5 Research Limitations...155
8.6 Future Research Areas ... 156
REFERENCES ... 159
LIST OF FIGURES
Figure 1-1 Transportation Energy Sources and Consumption in China (1990-2004) (in 10K tons
of standard coal equivalent)...18
Figure 1-2 Change in Major Urban Transport Drivers in 14 Chinese Cities...20
Figure 1-3 Thesis Structure... ... .- ... 25
Figure 2-1 A Comparison of "Conventional" Suburban Development and "Traditional" Neighborhood Development... 28
Figure 2-2 An Example of a Structure Equations Model ... 32
Figure 3-1 Conceptual Framework of the Set of Factors Influencing Household Transportation Energy Consumption at the Neighborhood Scale...53
Figure 3-2 Stylized Effects of Density, Diversity and Design Changes on Travel Frequency and Distance (e.g., by Car)... ... 54
Figure 3-3 Stylized Effects of Density, Diversity and Design Changes on Mode Choice ... 56
Figure 3-4 Stylized Effect of the Proximity to a Transit Corridor on Travel Distance ... 58
Figure 3-5 Stylized Effects of the Proximity to a Transit Corridor on Mode Choice ... 59
Figure 4-1 Jinan City in Shandong, China... 63
Figure 4-2 Jinan M aster Plan 2005-2020... 63
Figure 4-3 Population and Economic Trends in Chinese Cities...64
Figure 4-4 Car Ownership (Cars per 100 Households) across 36 Cities in China in 2006 ... 65
Figure 4-5 Peak-Hour Congestion in Jinan... 65
Figure 4-6 Private Car Population and Urban Road Length Trends in Jinan (2003-2008)...66
Figure 4-7 Jinan Measured and Forecasted Mode Shares 1995-2020 ... 66
Figure 4-8 Jinan BRT Corridor Map (as of August, 2009)...67
Figure 4-9 Jinan BRT Corridor Photos... 68
Figure 4-10 BRT Network Plan 2015... 68
Figure 4-11 The "Traditional" Neighborhood Typology... 69
Figure 4-12 The "Grid" Neighborhood Typology...70
Figure 4-13 The "Enclave" Neighborhood Typology ... 71
Figure 4-14 The "Superblock" Neighborhood Typology ... 72
Figure 5-2 GIS Maps of the Selected Nine Neighborhoods in Jinan...76
Figure 5-3 Layout of Dong-Cang Neighborhood (the "Enclave" Type)...76
Figure 5-4 Framework for Database Construction ... 83
Figure 5-5 A Hierarchical Tree Diagram ... 84
Figure 6-1 Hierarchical Cluster Analysis Result ... 93
Figure 6-2 Population Density vs. Household Density...94
Figure 6-3 Building Function Mix vs. Building Form Mix...95
Figure 6-4 Parking versus Percentage of Cul-de-sac... 97
Figure 6-5 Household Structures across the Four Neighborhood Typologies...98
Figure 6-6 Household Monthly Income (US$) across the Four Neighborhood Typologies ... 99
Figure 6-7 Private Car Ownership (cars per 100 households) by Household Monthly Income (U S $)...10 0 Figure 6-8 Attitudes (Percentage of Households Agreeing with Statements) versus Household M onthly Incom e (U S$)...102
Figure 6-9 Average Household Weekly Travel Distance (Km) across the Four Neighborhood T ypologies...103
Figure 6-10 Average Household Weekly Travel Mode Share across the Four Neighborhood T ypologies...104
Figure 6-11 Average Household Daily Travel Time (Min) across the Four Neighborhood T ypologies...105
Figure 6-12 Average Household Annual Transport Energy Use...106
Figure 6-13 Average Household Annual Transport GHG Emissions ... 107
Figure 6-14 International Comparison on Personal Annual Transport Energy Use...108
Figure 6-15 Distribution of Weekly Household Transport Energy Use Before/After Adjusted L og-Transform ation ... 109
Figure 6-16 Shares of No-Energy-Consumed Households across the Four Neighborhood Types 110 Figure 6-17 Comparison of Household Weekly Transport Energy Use vs. Income (a)...111
Figure 6-18 Comparison of Household Weekly Transport GHG Emissions vs. Income...111
Figure 6-19 Comparison of Household Weekly Transport Energy Use vs. Income (b)...112
Figure 6-20 Household Weekly Transport Energy Use vs. Household Size...113
Figure 6-22 Household Weekly Transport Energy Use vs. Distance to the City Center...114
Figure 6-23 Household Weekly Transport Energy Use vs. Proximity to BRT Corridors...114
Figure 6-24 Household Weekly Travel Energy Use versus Attitudes...115
Figure 7-1 Expected Household Travel Energy Use Reductions of Hypothetical Measures ... 141
LIST OF TABLES
Table 2-1 Post-World War II Neighborhood Design Principles Claimed to Reduce Transport
Energy Consumption or Automobile Use...29
Table 2-2 Neighborhood Typologies and Characteristics in US Travel Behavior Studies ... 31
Table 2-3 Empirical Evidence from Transport Energy Use/ Emissions Specific Studies...34
Table 2-4 Empirical Evidence from Travel Behavior Specific Studies...38
Table 2-5 Neighborhood Types and Characteristics in Shanghai (a)...43
Table 2-6 Neighborhood Types and Characteristics in Shanghai (b)...43
Table 3-1 Qualitative Effects of Different Neighborhood Features on Travel and Energy Use ...60
Table 4-1 Summary of Form Features across 4 Main Neighborhood Typologies ... 69
Table 5-1 Neighborhoods' Variation by Typology and Location with Population Estimates ... 74
Table 5-2 Neighborhood M easures in the Study ... 77
Table 5-3 Fuel Economy, Fuel Energy Content and Energy Intensity Assumptions ... 81
Table 5-4 Fuel Economy, Fuel Carbon Content and GHG Emission Factor Assumptions...82
Table 6-1 Density Measures in the Four Neighborhood Typologies...94
Table 6-2 Diversity Measures in the Four Neighborhood Typologies ... 95
Table 6-3 Design Measures across the Four Neighborhood Typologies...97
Table 6-4 Socioeconomic and Demographic Measures across the Four Neighborhood Typologies98 Table 6-5 Vehicle Ownership (vehicles per 100 households) by Monthly Income ... 100
Table 6-6 Comparison of Percentage of Households Agreeing with Attitude-Related Statements 102 Table 6-7 Average Household Weekly Trip Frequency (trips) across the Four Neighborhood T ypologies...103
Table 6-8 Single-Factor ANOVA Test Result...109
Table 7-1 N eighborhood V ariables...118
Table 7-2 Socioeconomic and Demographic Variables...119
Table 7-3 V ehicle Ownership Variables...119
Table 7-4 Household Attitude V ariables ... 120
Table 7-5 Comparison of OLS Models Predicting Log Transformed Household Weekly Total Travel Energy U se (In total mj)...123
Table 7-6 Final OLS vs TOBIT on Predicting Log Transformed Household Weekly Total Transport Energy Use (In total mj)...125 Table 7-7 Comparison of Single-Stage TOBIT Models on Predicting Log Transformed
Household Weekly Total Transport Energy Use (In total mj) vs. GHG Emissions
(In_totalco2)... .- - - - ... 126
Table 7-8 Instrumental Variables...128 Table 7-9 Binary Logistical Regression Models Predicting Car Ownership...130 Table 7-10 Binary Logistic Regression Models Predicting Other Types of Vehicle Ownership 134 Table 7-11 Comparisons of Models Predicting Log Transformed Household Weekly Total
Travel Energy Use (ln total mj)... ... 136 Table 7-12 Comparison of Two-Stage Models on Predicting Log Transformed Household Weekly Total Travel Energy Use (In_total mj) vs. GHG Emissions (ln total co2)137 Table 7-13 Conservative Estimation of Marginal Effects of Selected Variables on Household
Transportation Energy Use and Car Ownership based on the 2-Stage OLS Model R esults...---- . . . ---... 139 Table 7-14 2nd Stage OLS Models on Log Transformed Household Weekly Travel Distance by
Mode (Using Predicted Car Ownership: PCarOwned)...144 Table 7-15 2nd Stage TOBIT Models on Log Transformed Household Weekly Travel Distance
by Mode (Using Predicted Car Ownership: PCarOwned)...145
Table 7-16 Qualitative Effects of Different Neighborhood Features on Car Ownership, Travel Distance and Energy Use... ... 147
1 INTRODUCTION
This thesis examines whether neighborhood form typology, size and location could affect households' transportation energy use; and if so, to what extent. The research is based on analysis of 9 neighborhoods in Jinan, the capital city of Shandong Province in China.
Section 1.1 presents three emerging trends in China that motivate this research; section 1.2 introduces broader research context of the thesis, as embedded in a broader "Making the Clean Energy City in China" collaborative research project; section 1.3 and 1.4 presents the main research objectives and research questions, respectively; section 1.5 describes the research approach including the choice of Jinan as the case study; section 1.6 concludes with the thesis structure.
1.1 Motivation
1.1.1 Rocketing Transport Energy Use in China: A Challenge
The transportation sector accounts for 22% of primary energy use and 27% of CO2
emissions in the world as of 2004, and is expected to be the most rapidly growing source over the next 30 years (de Ia Rue du Can & Price, 2008). In the developing countries, transportation energy use will grow at 2.7% per year from 2006 to 2030, a rate 8 times higher than the projected rate for OECD countries, and the use of fuels in the non-OECD transportation sector as a whole will nearly double over the period (International Energy Agency, 2009)
In China, the trend is more pronounced. Thanks to ongoing economic growth, urbanization and changing consumer lifestyles, oil consumption by Chinese road transport has increased by
9% per year between 1995 and 2005 (see Figure 1-1), currently consuming about 30% of the
total national oil consumption (He, et al., 2005). In the next decades, demand is projected to continue to increase at an annual rate of 6% under current trend, triggering a quadrupling increase in oil consumption in 2030 and accounting for more than two-thirds of the overall increase in national oil demand (He, et al., 2005; International Energy Agency, 2007)
This rocketing transport energy use adds uncertainty to China's future growth, because the country has relatively limited petroleum resources compared to other energy sources like coal. Measured on a per-capita basis, the petroleum reserves in China presented 4.3% of the world average in 2000 (Chen & Wang, 2007). As China becomes more mobile, the transportation sector's petroleum consumption poses important energy security problems. In addition, the rapid increase in greenhouse gas (GHG) emissions from the transport energy use creates big challenges for China, the largest carbon emitter in the world as of 2007, in working to mitigate climate change risk.
Figure 1-1 Transportation Energy Sources and Consumption in coal equivalent)
China (1990-2004) (in 10K tons of standard
Source: Chen & wang(2007), p. 11
1.1.2 Supply-Side Mitigation Strategies in China: An Inadequacy
The Chinese government has recognized the challenge in the transport sector and committed to make changes mainly through introducing alternative fuels and regulating vehicle fuel economy. For example, since 2002, China has been promoting ElO (10% bio ethanol and 90% gasoline blend by volume) as an alternative transport fuel; China is now the third largest fuel-ethanol producer in the world (Yan & Crookes, 2009). In addition, China has adopted the Euro-4 tailpipe emissions standard in major cities to restrict exhaust emissions of new vehicles
sold in the market. Very recently, the Chinese government and the private sector have emphasized electric car technology development (Bradsher, 2009).
Unfortunately, recent empirical studies in Chinese cities suggest that gains in vehicle technology or fuel improvements in the past have been overwhelmed by underlying changes in travel behavior and life-style, leading to rapid overall increases in energy use and GHG emissions (Darido, et al., 2010), as shown in Figure 1-2. China is currently the world's largest automobile market, and the vehicle fleet population is projected to grow by some 230 million between 2006 and 2030, to reach almost 270 million (International Energy Agency, 2007). While the alternative fuel and vehicle economy efforts are necessary and important given that so much of the vehicle fleet is "yet to come", the relatively slow turn-over of the vehicle fleet and ever-changing technology may significantly delay the incorporation of a large amount of "greener" cars operating on China's roads.
In the face of similar situations faced by other countries, an increasing consensus among international scholars seems to be emerging that a single technological fix will not resolve the complex transportation energy use and greenhouse gas (GHG) problem; efforts from different fields are warranted (Guan, et al., 2008; Mui, et al., 2007; Pacala & Socolow, 2004; Wright & Fulton, 2005; Zeng, et al., 2008). As Ewing, et al. (2008) note, the objective of reducing transportation energy or GHG emissions "can be viewed as a three-legged stool, with one leg related to vehicle fuel efficiency, a second to the carbon content of the fuel itself, and a third to the amount of driving or vehicle miles traveled (VMT) (p.1)." Those authors further note, in the
U.S. context, that relevant policy initiatives "have pinned their hopes almost exclusively on
shoring up the first two legs of the stool, through the development of more efficient vehicles (such as hybrid cars) and lower-carbon fuels (such as biodiesel fuel)" and that "a stool cannot stand on only two legs" (Ewing, et al., 2008; p.1). A somewhat similar situation seems to exist in China, where the energy and climate initiatives in the transport sector have primarily been supply-oriented. Thus, to make sure the stool does not "fall over" and to solve the deteriorating energy problem in China, an increasing focus must explicitly target the demand side, or the third leg of the stool, to manage transportation energy use.
Figure 1-2 Change in Major Urban Transport Drivers in 14 Chinese Cities Cumulative Change -75% -50% -25% 0% 25% 50% 75% 100% Beijing93-02 Beijing 02-06 Changzhi 02-06 Chongqing 02-06 Dongguan 02-06 Guangzhou 93-02 Guangzhou 02-06 Jiaozuo 02-06 Jinan 02-06 Linfen 02-06 Luoyang02-06 Nanchang 02-06 Shanghai93-02 Shanghai 02-06 Urumqi 02-06 Weihai02-06 Wuhan 02-07 Xian 93-02 Xi'na 02-06 Xianyang 02-06 Zhengzhou 02-06 .. ...........
E I
....
E...
Emuir
.Iu
u
i...
...
Change in trip rate Change in VKT/trip Change in (1/occupancy) Change in CO2/VKT I -- .
Source: Darido, et al. (2009), p.6
Notes: Changes in trip rate, VKT/ trip and 1/occupancy are demand-side travel behavior changes; change in C0 2/VKT indicates
supply-sidechange resulting fromfuel/automobile technology improvement and standards; VKT = vehicle kilometers traveled
125% 150% 1759
...
....
.
.
...
-
---
-
...
...
...
...
... ... ... ... ... ... . ... ... ... ... ...1.1.3 Urban Form and Design to Reduce Travel Demand in China: A Potential
In the US and Europe, many have argued that urban growth management can be an effective way to shape people's travel behavior towards less energy-consuming patterns. On the other hand, skeptics argue that urban development's impact on travel demand and energy use can be limited not only because it is difficult to achieve in practice, due to relatively weak policy leverage from local governments, but also because cities in developed countries are already largely built up with an auto-oriented structure, with an auto culture already dominating society (Pickrell, 1999). By this argument, from a cost-effectiveness point of view, taxing fuel would be a much simpler, faster, cheaper, and more effective policy instrument than rearranging metropolitan areas and/or major investments in transit (Gordon & Richardson, 1989).
China, however, is different. China is still experiencing rapid urbanization, a trend likely to continue for decades. A projected 350 million or more Chinese will move to the city in the next
15 years and the urbanization rate will increase to 60% by 2025, from 46% in 2010; at that time,
there will be 221 Chinese cities with more than one million people (McKinsey & Company,
2009). If travel demand can indeed be reduced through intervention in the urban built
environment, there is much larger scale-up potential for China than in developed countries to intervene in the form of urban development in order to purposefully influence travel behaviors and outcomes in the latter half of her urbanization process.
In addition, compared with many developed countries, Chinese city governments have relatively strong control over local urban development patterns through their institutional settings and public ownership to urban land. The recent heavy investment in urban infrastructures (e.g., subway lines, bus rapid transit systems, etc.) as a component of the national stimulus package has made urban growth patterns (e.g., transit oriented development) advocated by many in the west look feasible and promising in future China.
Unfortunately this opportunity for China has not been quite recognized. Instead, on the one hand, auto-oriented neighborhood development (e.g., the so-called "superblock" development) dominates current urban expansion and construction (Cervero & Day, 2008; Monson, 2008); on the other hand, there have been very few empirical studies supporting alternative urban growth patterns in China from the energy perspective. Although the neighborhood serves at the spatial unit of intervention, planning, and institutional organization, transferring western policies and design standards directly to China without careful adaption is viewed as risky and problematic by
local leadership given the much different social, cultural and institutional context. For example, the existing neighborhood density in China already greatly exceeds any density level considered in US development today. Even if the transit-oriented development (TOD) concept, for example, is favorable, what kind of TOD we should pursue is still an urgent question. This cannot be answered without empirical investigation in the local context.
1.2 Thesis Context: "Making the Clean Energy City in China"
This research is a component of the "Making the Clean Energy City in China" project, sponsored by the China Sustainable Energy Program of the Energy Foundation-Beijing Office. The overall project aims to create new physical models of urban development as well as new analytical models to understand potential paths towards, and impacts of, alternative urban growth patterns from an energy efficiency perspective. The collaborative project involves a number of institutions in China and the USA, including:
" The Transportation Planning & Design Research Center, Shandong University
" The School of Geography and Remote Sensing, Beijing Normal University " The School of Architecture, Tsinghua University
" The School of Environmental Science, Tsinghua University " The Lawrence Berkeley Laboratory
" The School of Architecture and Planning, MIT
One of the tasks of the project focuses on deepening our knowledge of the "state of the context"- the relationships between urban design and energy consumption in the Chinese city. This work includes: (1) general data collection on the city, including energy consumption, building types, etc.; (2) the development of typologies of urban development in the city, utilizing GIS and other available data; (3) selection of a limited number of comparison sites that represent some of the typologies identified in (2); (4) implementation of a survey of households in the selected comparison sites, to collect data on energy use, travel behavior, etc.; (5) utilization of statistical methods and models to quantify the apparent relationship between urban design and energy consumption in the city. This thesis contributes directly to the sub-task (5), focusing specifically on household transport energy use and GHG emissions, while a brief description of previous tasks is also provided in Chapter 4 and Chapter 5.
1.3 Research Objectives
The main objective of this research is to improve our understanding of the link between urban development at the neighborhood scale and household passenger transport energy use in China. Specifically, we aim to quantify the energy reduction potentials from alternative neighborhood locations and patterns based on empirical evidence.
1.4 Research Questions
The research objectives above can be grouped into two corresponding categories of research questions.
Question 1: Neighborhood location features
Do neighborhoods near the city center or adjacent to transit corridors result in less household transportation energy consumption? Should we encourage infill development and concentrate urban development along transit corridors to reduce energy use?
Question 2: Neighborhood design features
What are the representative neighborhood forms in today China? Controlling for socioeconomics, demographics and household attitudes, to what extent does transport energy use vary across those different neighborhood forms? Should we build cities in future as the way we build now in China (i.e., the "superblock"-like development), or should we look for alternatives from an energy efficiency perspective?
1.5 Research Approach
In an attempt to answer the above questions, in this thesis I employ a research approach that can be characterized as: an empirical study with a micro-level urban form focus, using statistical techniques guided by activity-based econometrics.
First, empirical data were collected on both micro-level neighborhood features (location, form, size) and households' characteristics in Jinan, China. The city of Jinan was chosen because
1) it represents middle-size Chinese cities (as opposed to Beijing and Shanghai) cities which are
drivers of China's increasing energy demand yet which have been rarely studied in the literature; 2) the city has recently implemented bus-rapid-transit (BRT) corridors, allowing examination of the transit-corridor effect on household transportation energy use; and 3) survey data in Jinan were available from local partners of the collaborative research project funded by the Energy
Foundation China. The survey data were collected from 2629 households in 9 different neighborhoods which were, ex-ante via visual surveys and geographic information system (GIS) analysis, determined to represent four distinct typologies (i.e., "traditional", "grid", "enclave" and "superblock").
Second, an activity-based econometric behavior framework was developed to guide the analysis of household travel energy use. Techniques used include: descriptive statistics, single-stage multivariate regression models (i.e., OLS, TOBIT), and two-stage instrument models (i.e., LOGIT + OLS/TOBIT) incorporating household vehicle ownership choice models with instruments. Due to the nature of the data and the complexity of the research questions, the statistical techniques deployed attempt to control for various influencing factors and statistical challenges (e.g., endogeneity) and make it possible to strengthen the inferences. For more details, see section 5.6.
1.6 Thesis Structure
The thesis is organized as follows (see Figure 1-3).
In Chapter 2, I summarize key neighborhood design principals advocated by urban designers and others to change travel behavior towards lower travel energy use. I then review empirical findings and methodologies employed in selected studies of district and neighborhood form-energy use relationships. Finally, I discuss specific issues regarding research operationalization and data constraints in the Chinese context.
In Chapter 3, I introduce the theoretical behavioral framework for understanding the relationship between neighborhood urban form and household travel behavior and energy use. The framework draws from existing travel demand theory, especially utility theory, specifically combining the cost-based approach and activity-based approach to understand how neighborhood characteristics and other factors may influence household transportation energy consumption. Finally, I conduct a series of comprehensive and detailed analyses to illustrate the complicated implications of some advocated neighborhood interventions on household travel behavior and energy use.
Chapter 4 describes the Jinan city context, the ongoing bus-rapid-transit (BRT) corridor development, and the representative neighborhood forms in the city.
Chapter 5 introduces the detailed research design in this thesis in terms of the neighborhood sampling approach, household data collection, and the general econometric techniques employed and related issues.
In Chapter 6, I perform descriptive analysis based on the neighborhood form and household data. Specifically, I conduct cluster analysis on the 9 neighborhoods using derived form measures. I also compare household attribute, travel patterns and associated energy use and
emission across the four neighborhood types.
Chapter 7 presents the quantitative analysis of the relationship between urban form and household energy consumption. Specifically, I present a number of econometric models examining the relationship between neighborhood typology, size, location features and household transportation energy use. Two-stage instrumental models are employed to identify that relationship meanwhile controlling for confounding effects from household attributes and others. Marginal effects of neighborhood features on household transport energy use are estimated.
In Chapter 8, I summarize the policy and planning implication of the findings, discuss research limitations, and suggest directions for future research.
Figure 1-3 Thesis Structure
Chl Introduction: motivation, objectives and approach
Ch2 Literature Review
r--- --- I
Ch3 Theory and Framework
Ch4~~h JianCntx
Ch6 Jinan Data Descriptive Analysis
Ch7 Jinan Data Multivariate Analysis Ch5 Research Design
m--m a--- ---- s
2 LITERATURE REVIEW
Chapter 1 discussed the urgent need for, and potentials to, incorporate better spatial planning and design, particularly at the micro/neighborhood development scale, into mitigation strategies on urban transportation energy use and GHG emissions in the context of China's urbanization and motorization. While such a concept is new to China, similar claims have been made by urban planners (e.g., the "New Urbanists") in developed countries for a long time.
In the field of empirical research (as opposed to simulation studies) at the neighborhood scale, there have been two main groups of efforts: 1) direct assessments on the relationship between neighborhood design and explicitly measured household transportation energy use or emissions; and 2) indirect assessments via examining whether and how neighborhood features can influence people's travel behaviors, especially car driving and transit use. Does such relationship indeed exist? Unfortunately, research results accumulated to date support both sides of the argument; a debate over the effectiveness of neighborhood design strategies continues among urban designers and transportation planners.
This chapter reviews the literature to examine why this has been the case and how the situation is changing, and the implications for future empirical research in China. The chapter is organized in four sections. In section 2.1, we begin with a background section summarizing key neighborhood design principles advocated by urban designers to achieve travel energy and emissions reductions. In section 2.2, I discuss analytical approaches that have been employed in empirical studies in developed countries, the results from those studies, and lessons we can draw. In section 2.3, I scan relevant empirical precedents in China, accompanied by comments on their research findings and methodological limitations in the China context from an energy perspective. Finally, section 2.4 provides a summary.
2.1 Neighborhood Features for Transport Energy Reduction: Advocates from Designers
The evolution of concepts for creating walking/transit-friendly neighborhoods, which imply reducing car use and, presumably, energy consumption, can be traced back to the inception of
urban planning profession. In the late 1800s, the British urban planner Ebenezer Howard proposed the "Garden City" model for British cities. The idea was to establish self-sufficient communities linked by rail transit, with each community of approximately 6,000 acres housing no more than 30,000 people and providing most services within walk distance (Howard, 1902). In 1929, the American planner Clarence Perry advocated the "Neighborhood Unit" model with the concept of housing 6,000-10,000 inhabitants and centering elementary schools in the community with major roads bounded, so that children could safely walk to school without crossing them (Perry, 1929). Both models were partly implemented in practice evidenced by, for example, the Radburn (New Jersey, USA) development in the late 1920s (Lee & Ahn, 2003). From the transport energy use perspective, Howard's and Perry's neighborhood design models seem inherently associated with lower travel energy consumption, since they were devised with the intention of promoting a community-based lifestyle by providing good walking accessibility within the neighborhood. .
During the post-World War II era, however, suburban development, characterized by single-use, low-density residential buildings and auto-oriented street configurations, dominated the urban growth pattern and automobile use boomed in the United States (Zegras, 2005). Aiming at breaking this urban growth pattern and mitigating its negative impacts on the society and environment, a number of architects, urban designers, and advocates have brought a series of alternative concepts, as will be discussed below.
Within this general school of thought, New Urbanism has become perhaps the most popular planning idea since the 1980s and 1990s. Espoused by architects Peter Calthorpe and Andres Duany, the "New Urbanist" model is characterized by features including medium-density, mixed-use, human-scale and pedestrian-focused design, to discourage car use and encourage walking and transit (Katz, et al., 1994).
In a similar vein, Traditional Neighborhood Development (TND) is another comprehensive planning model with similar characteristics (Figure 2-1): a grid-like street network; higher-density residential uses surrounding retail, recreational, and governmental uses; better accessibility to retail and transit; and pedestrian-friendly neighborhoods (Aurbach, 2005; Duany
& Plater-Zyberk, 1992; Katz, et al., 1994). Planners have claimed that the TND neighborhoods
(Horsley Witten Group, 2007), and therefore presumably perform well in terms of transportation energy efficiency and pollution reduction.
Figure 2-1 A Comparison of "Conventional" Suburban Development and "Traditional" Neighborhood Development
A. Conventional Suburban Development Development
ftj'
_B. Traditional Neighborhood
Source: Boamet & Crane (2001), p.42
In some sense building on the New Urbanism and TND, transit oriented development (TOD) generally refers to higher-density development which sets pedestrian priority and locates within easy walking distance of a major public transit station. It has been argued that TOD can contribute to energy efficiency and emission reduction in that it can increase transit use and reduce automobile trips and vehicle miles traveled (VMT) (Evans Iv & Pratt, 2003). For example, the California Air Resource Board used a hypothetical simulation approach (as opposed to empirical analysis) and estimated that TOD would produce a 20 to 30 percent reduction in household VMT as compared with non-TOD households, resulting in a corresponding reduction in greenhouse gas emissions of 2.5 to 3.7 tons per household per year (Arrington, et al., 2002).
Table 2-1 Post-World War 11 Neighborhood Design Principles Claimed to Reduce Transport Energy Consumption or Automobile Use
Density Diversity Design Location
New Urbanisma - Medium-density - Mixed-use - Pedestrian focus - Transit-friendly
Traditional - Compact v Variety of * Provide a * Present and future
neighborhood development housing types network of modes of transit
development and land uses paths, streets and
(TND) b lanes suitable for
pedestrians and vehicles
Transit Oriented * Higher-density * Mix land uses Pedestrian Within easy
Development development priority walking distance
(TOD) ofof a major public
transit station or stop(s)
a. Katz, et al. (1994)
b. Aurbach (2005)
c. Evans Iv & Pratt (2003)
Note: Design principles for non-transport energy reduction are not listed.
Table 2-1 summarizes the neighborhood concepts and standards underlying the new urbanism, TND, and TOD. While the names are different, all three concepts converge to similar basic design principles, namely to have relatively high density, mixed land uses, a pedestrian/bicycle friendly environment, and a "smart" location close to transit services. Designers expect that neighborhood developments with such features will promote alternatives to driving and thus reduce demand for car-mobility and its associated energy use and emissions.
Various design-oriented tools have emerged which attempt to rate neighborhood-level developments, following the school of thought summarized in Table 2-1. For example, the
LEED-ND certification program (Leadership in Energy & Environmental Design for
Neighborhood Development) was launched in 2006. The program creators (the US Green Building Council, the Natural Resources Defense Council, the US Environmental Protection Agency, and the Congress for the New Urbanism) stated that the LEED-ND program will facilitate neighborhood development practices that can achieve less automobile dependence (US Green Building Council, 2007).
2.2 Empirical Precedents in the Developed Countries
Although urban designers seem to share similar neighborhood design strategies for reducing car use and energy consumption, there might be "a mismatch between what we know about
travel behavior and what we need to know to evaluate the transportation goals of urban designers" (Boarnet & Crane, 2001; p.11). In the past decades, numerous studies have been
conducted in the developed countries using empirical data to test whether those claims from urban designers are true or not, and to what degree. Unfortunately, and maybe surprisingly, studies accumulated to date appear to show that identifying a direct connection between the built environment and people's travel behavior (and the associated energy use and emissions) remains elusive (Boarnet & Crane, 2001; Guo, et al., 2007; Pan, et al., 2009).
2.2.1 Empirical-analytical Methods
Comparative analysis, multivariate-regression analysis and advanced methods are among the most widely used approaches applied in the field of empirical research. The more advanced the method, the more data-hungry and sophisticated the modeling techniques become.
a) Comparative Analysis
Comparative analysis simply compares observable facts of travel behavior or energy consumption patterns in different neighborhood settings, directly showing what is happening at a particular place at a particular time. This approach was more favored in the early stage of empirical research in the field (Cervero & Gorham, 1995; Dagang & Loudon, 1995; Friedman, et
al., 1994), although it was also applied in some recent studies (VandeWeghe & Kennedy, 2007).
In terms of the scale of data, the urban form data were often collected at the neighborhood level. Identification of neighborhoods could be: 1) pre-determined by existing data sources (census tract, traffic analysis zone, census block group, etc.); 2) standardized via assigning a buffer area (e.g., a 400m by 400m grid) for each household sample; or 3) based on relative homogeneity among a range of form attributes. The first two are more of operational convenience. Examples of the third approach are shown in Table 2-2, which involves somehow arbitrary neighborhood definition. In terms of the travel energy/emission/behavior data, information from individuals or households was aggregated to the neighborhood level before cross-comparison.
Table 2-2 Neighborhood Typologies and Characteristics in US Travel Behavior Studies
Source Auto-Oriented Neighborhood Transit-Oriented Neighborhood
Sasaki Associates (1993)
Friedman et al. (1994)
Cervero and Gorham
(1995)
Handy (1995)
Started construction after 1910 auto-oriented from outset single land use
branching street system Developed since the early 1950s
Segregated land uses
well-defined hierarchy of roads access concentrated at a few points little transit service
laid out and built after 1945 laid out without regard to transit primarily random street pattern lower density
Irregular curvilinear street networks
strip commercial commercial areas outside walking distance
Source: Ewing & Cervero (2001), p. 88
started construction before 1910 transit-oriented in initial stages mix of land uses
interconnected system of streets developed prior to WWII mixed-use commercial district neighborhoods close to commercial uses
interconnecting street grid laid out and built before 1945 initially built along a transit line primarily gridded street pattern higher density
regular rectilinear street networks main street commercial
commercial areas within walking distance
There are two main drawbacks of this method. First, comparative analysis tends to use aggregated travel data for direct comparison (comparing household by household is impossible), which makes the isolation of effects from any underlying disaggregate factors and the exploration of the urban form- travel pattern dynamics difficult (Handy, 1996). Second, findings using this approach are often challenged of the failure in effectively filtering out non-neighborhood factors (e.g., income) which also are believed to be crucial in affecting travel behavior patterns, associated energy use and emissions.
b) Multivariate-regression Analysis
Relevant multivariate-regression analyses typically involve ordinary least square (OLS), logitistic regression (LOGIT), TOBIT and/or other modeling techniques, in which confounding factors such as household socioeconomics and demographics are brought directly into the analysis for statistical control. Disaggregated neighborhood form elements represented in the models are sometimes grouped into three dimensions: density, diversity, and design (Ewing & Cervero, 2001). Although the multivariate-regression approach is effective in controlling for potentially confounding effects (e.g., due to socioeconomics and demographics), the approach
still poses challenges in establishing causality, due to the data type (e.g., lack of data on attitudes) and analytical approach (e.g., cross-sectional) typically employed. This problem has become widely referred to as the "self-selection" problem (e.g., see Mokhtarian and Cao, 2008).
c) Advanced Methods
More advanced methods and data have been applied to the urban form-travel behavior analysis field in recent years, mostly to address the "self-selection" problem and thereby attempt to strengthen claims that the built environment actual causes measurable differences in travel behavior. Instrumental variable models, sample selection models, joint discrete choice models, structural equations models, and/or models using longitudinal data are among the relevant advanced models. For detailed discussions, comparisons and evaluations of these modeling techniques, readers can refer to Mokhtarian & Cao (2008).
Figure 2-2 An Example of a Structure Equations Model MEASUREMENT MODEL
r --- --- 1
...I... . . . . . .
.
K:
Density
Dierit LAND USE - - -
---(X1) Dein-distance e --- - - -- - - - - - BEHAVIOUR e4 Education tr Jobstatu.ECOOMIC e6 STATUS I Income (X2) STRUCTURAL MODEL Source: Van Acker, et al. (2007), p. 342
2.2.2 Results
Some studies directly assess the links between neighborhood characteristics and transport energy use or emissions. Section a), below, reviews these in some detail and Table 2-3 summarizes them. Other studies more indirectly assess such a link by looking at elements of
energy-related travel behavior' (e.g., travel distance or VMT, frequency, mode choice, etc.). Section b), below, reviews some of those studies and literature reviews that exist (Ewing & Cervero, 2001; Handy, 2006; Zegras, 2005) and Table 2-4 summarizes them.
a) Energy/ emissions specific studies
Cheslow & Neels (1980) provided one of the first studies to explicitly investigate neighborhood form and location effects on travel energy use. They conducted multivariate regressions based on aggregate travel data from eight metropolitan areas in the United States. Energy use by urban passenger transportation was found to be lower with some development patterns than with others. Specifically, it was estimated that a tripling of neighborhood densities would reduce fuel use by 24% due to declining auto trip rates and travel distances (Cheslow & Neels, 1980).
Naess & Sandberg (1996) collected journey-to-work travel information of 485 employees from six companies in the Greater Oslo region, Norway. Multivariate regression analysis based on those disaggregated individual travel data was performed. The authors found that employees working in peripheral, low-density areas use considerably more energy in commuting than those working in central, high-density areas. Statistically, controlling for car ownership and income (but not density), an additional energy use of 73 percent, or 1640kWh was estimated for an outer-area worker in his/her commuting trips annually (Naess & Sandberg, 1996).
Travel behavior studies that focus exclusively on physical activities (e.g., walking, biking) are not included in the literature review since their energy consumption is considered negligible in this context, although we recognize there exists a possible link between physical activities and fuel-based travel patterns.
Table 2-3 Empirical Evidence from Transport Energy Use/ Emissions Specific Studies
Higher Higher Better Smarter
TOD-Impacts onH Methodology Context Source
Density Diversity Design Location Overall
Less travel energy use Regression/ Aggregate 8 metro areas, US Cheslow & Neels (1980)
Less travel energy for commuting trips Regression Greater Oslo, Norway Naess & Sandberg (1996)
Disaggregate
Less vehicle emission (NOx, VOC, CO) i Puget Sound, US Frank, et al (2000)
Disaggregate
Less household transport energy use X X Regression Greater Oslo, Norway Holden & Norland (2005)
Disaggregate
Less annual eco-footprint on commute Regression/ Aggregate Barcelona, Spain Muniz & Galindo (2005) Less per capita full-lifecycle
transportation-related GHG emissions and 4 Comparative/ Aggregate Toronto, Canada Norman, et aL. (2006)
energy use for auto, transit and light trucks)
Less per capita GHG emissions from transport 4Comparative/
Aggregate Toronto, Canada VandeWeghe & Kennedy (2007) operations for auto and transit
Less household total auto emissions (CO, Regression/ Charlotte, US Yasukochi (2007)
NOx, HG) Disaggregate
Regression!
Less vehicle emissions (CO2) 4igregate Nationwide, US Emrath & Liu (2008)
Disaggregate
Less motorized energy 4 4 4 4 Regression/
Less energy burned from walking X 4 X X Disaggregate
Notes:
"Smarter location"- close to the city center (CBD) or a major transit station
Frank, et al. (2000) explored the relationship between census-tract-measured urban form and automobile emissions (nitrogen oxides, volatile organic compounds, and carbon monoxide) within the Puget Sound region, US. Disaggregated household emission data were estimated from detailed local travel survey data using emission rates from MOBILE5a and separate engine start rates. Multivariate regression analysis was also adopted for controlling effects of income, vehicle ownership, and household size. Results showed that household density, work tract employment density, and, in the case of nitrogen oxides, street connectivity (census block density) were significantly and inversely correlated with vehicle emissions (Frank, et al., 2000).
Holden & Norland (2005) conducted surveys in eight residential areas in the Greater Oslo Region, Norway, the same area that Naess & Sandberg (1996) previously studied. The research performed similar multivariate regression analysis while using disaggregated household data. They found that the total household energy use decreases as density reaches a certain point, yet at higher density levels the total energy use increases. This effect is different from the workplace density effect identified in Naess & Sandberg (1996). The more recent research also found an interesting interaction between households' everyday travel and leisure-time travel: for example, residents living in high-density areas compensated for the energy savings from everyday travel
by having more leisure-time travel by plane (Holden & Norland, 2005).
Muniz & Galindo (2005) measured ecological footprints of commuting in the Barcelona Metropolitan Region (BMR), Spain for its 163 municipalities, considering the energy used in traction, vehicle manufacturing, the construction and maintenance of transport infrastructures, and the land occupied by those infrastructures in each municipality. Multivariate regression analysis using aggregated ecological footprint data was performed to control for average household income and job ratio (per capita employment) at the municipality level. Net population density was found to be negatively associated with ecological footprints. Conversely, distance to center and distance to transport axis were found to have significant positive effects. In general, urban form factors explained more of the variability of ecological footprints among municipalities than socioeconomics did (Muniz & Galindo, 2005).
Norman, et al. (2006) assessed energy use and GHG emissions (including transportation operations from light duty vehicles and public transit) associated with high and low residential development in the City of Toronto, Canada, using input-output life-cycle assessment
per capita transportation energy use and GHG emissions associated with low-density development was 3.7 times higher than the high density development; and the difference were mainly from automobile use accounted for more than 90% of total transportation energy use (Norman, et al., 2006).
VandeWeghe & Kennedy (2007) also focused on the City of Toronto, comparing GHG emissions (including auto and transit operations) among 832 census tracts, a more refined, yet still aggregate, scale than that in Norman, et al. (2006). They also followed a comparative approach, and found that the top ten tracts in terms of GHG emission were all located in low-density tracts on the outskirts, with their high emissions largely due to private auto use (VandeWeghe & Kennedy, 2007). In both analysis of Norman, et al. (2006) and VandeWeghe & Kennedy (2007), no socioeconomics or demographics were controlled for.
Yasukochi (2007) estimated a series of multivariate-regression models to analyze the affect of neighborhood design (measured at the census block group) using disaggregated household total automobile emission data (CO, NOx, HC) in the Charlotte, North Carolina metropolitan area. The study found that the most important land use variables in the models were median distance of houses within the block group to the central business district as well as local/regional accessibility. Other land use variables were either statistically insignificant or very weak in terms of their marginal effects (Yasukochi, 2007).
Emrath & Liu (2008) analyzed the effects of subdivision compactness and location on transportation CO2 emissions in the United States. In estimating disaggregated household travel
emissions, the study used VMT, the efficiency of the vehicles owned, and the efficiency of the speed with which vehicles are driven, all information extracted or derived from 2001 US National Household Travel Survey. Multivariate regression models were further applied and showed that controlling for household attributes, CO2 emissions were lower in denser developments primarily due to reductions of VMT, even though vehicles were driven at less efficient speeds (Emrath & Liu, 2008).
Frank, et al. (2009) studied the effect of regional accessibility and local walkability on the personal energy consumption pattern of in the Atlanta region, USA. The disaggregated energy consumption for both motorized travel and walking were derived from household 2-day travel diaries of 10,148 residents. Neighborhood forms were measured in GIS based on a 200-m grid around each participant's home location. Multivariate regression analysis was employed for