HAL Id: insu-01130332
https://hal-insu.archives-ouvertes.fr/insu-01130332
Submitted on 4 Jan 2021
HAL is a multi-disciplinary open access
archive for the deposit and dissemination of sci-entific research documents, whether they are pub-lished or not. The documents may come from teaching and research institutions in France or abroad, or from public or private research centers.
L’archive ouverte pluridisciplinaire HAL, est destinée au dépôt et à la diffusion de documents scientifiques de niveau recherche, publiés ou non, émanant des établissements d’enseignement et de recherche français ou étrangers, des laboratoires publics ou privés.
application to paleomagnetic dating of historical lava
flows in Chile
Pierrick Roperch, Annick Chauvin, Luis Lara, Hugo Moreno
To cite this version:
Pierrick Roperch, Annick Chauvin, Luis Lara, Hugo Moreno. Secular variation of the Earth magnetic field and application to paleomagnetic dating of historical lava flows in Chile. Physics of the Earth and Planetary Interiors, Elsevier, 2015, 242, pp.65-78. �10.1016/j.pepi.2015.03.005�. �insu-01130332�
Roperch, Pierrick, Annick Chauvin, Luis E. Lara, et Hugo Moreno. « Secular Variation of the Earth’s Magnetic Field and Application to Paleomagnetic Dating of Historical Lava Flows in Chile ». Physics of the Earth and Planetary Interiors 242 (mai 2015): 65-78. https://doi.org/10.1016/j.pepi.2015.03.005.
Secular variation of the Earth’s magnetic field and application to
paleomagnetic dating of historical lava flows in Chile.
Pierrick Roperch1, Annick Chauvin1, Luis E. Lara2 , Hugo Moreno3
1. Geosciences Rennes, UMR 6118, CNRS & University of Rennes1, 35042 Rennes , France. 2. Servicio Nacional de Geología y Minería, Santiago, Chile 3. Servicio Nacional de Geología y Minería, OVDAS, Temuco, Chile Abstract The recent geomagnetic secular variation is mainly characterized by the large growth of the South Atlantic Magnetic Anomaly during the last three centuries, first documented by the geomagnetic model gufm1 (Jackson et al., 2000). We report new paleomagnetic results (directions and paleointensities) from several sites in two well dated lava flows in Chile, the 1835 AD eruption of the Osorno volcano and the 1751 AD eruption of the Llaima volcano. In addition, paleointensities were obtained on 14 samples from bricks of shelters built along the main road across the Andes from Santiago (Chile) to Mendoza (Argentina) in 1770±5 AD. The results confirm the high reliability of the global geomagnetic model gufm1 for the last three centuries with a large amplitude of the secular variation in inclination (~20°) and intensity (~25µT). Results from three 14C dated volcanic units in the time interval 1400-1750 AD indicate that more paleomagnetic results in well dated lava flows are necessary to improve the robustness of existing global geomagnetic models. At this stage, precise paleomagnetic or archeomagnetic dating in South America using global models should be restricted to the last 3 centuries. To illustrate the potential of paleomagnetic dating in region and time interval with very large geomagnetic secular variation, we report paleomagnetic data from several sites in historical lava flows (1700-1900 AD) from the Antuco, Llaima and Villarrica volcanoes that permit to refine the ages of the major historical effusive volcanic events. Keywords. Paleomagnetism; Geomagnetic secular variation; South Atlantic Geomagnetic Anomaly; Volcanism; Chile
1.0 Introduction
The secular variation of the Earth Magnetic Field is relatively well determined for the last four centuries. From an impressive compilation of magnetic records made by navigators and direct measurements, Jackson et al. (2000) proposed a global field model (gufm1) providing our most complete picture of the evolution of the geomagnetic field at Earth's surface from 1590 to 1990. However, no measurement of intensity data was available prior to 1840 and the axial dipole component was linearly extrapolated back before this date in the original model. Gubbins et al. (2006) and later Finlay (2008) found that this extrapolation in the fall of the dipole was not justified and the
gufm1 model was adjusted with paleointensities determined from
archeomagnetic data prior to 1840.
Most recent geomagnetic models extended to the last 3 millennia (Korte et al., 2009, Korte and Constable, 2011) are constrained by the gufm1 model especially for the last 3 centuries.
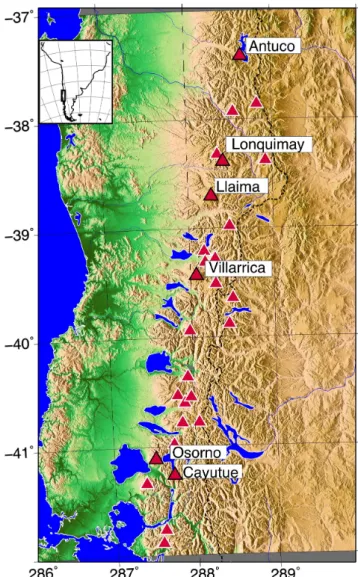
The growth of the South Atlantic Geomagnetic Anomaly during the last three centuries induces a large decrease in the magnetic field inclination and intensity of the Earth magnetic field over South America. This large geomagnetic secular variation is likely to provide an accurate paleomagnetic dating tool for archeologic or volcanic material for the last three centuries. In the present study, new paleomagnetic results from dated material from the Chilean Andes permit to verify and consolidate current geomagnetic models. Numerous active volcanoes mark the western border of the Andes in south central Chile between 37°S and 42°S (Fig. 1). This part of Chile is the Araucania inhabited by the Mapuche people who resisted the Spanish conquest until the 18th century. The chronology of the historical volcanic activity of several of the active volcanoes has been studied in detail by Petit-Breuilh (2004). However, though the ages of the eruptions of some volcanoes are usually well defined, it is much more difficult to assess the exact location and extent of the lava flows possibly associated with an historic eruption. Informations related to volcanic eruptions prior to the 19th century are often scarce (supplementary Fig. 1). We report paleomagnetic results from the two best-documented volcanic events with well-defined lava flows, the 1835 AD Osorno and the 1751 AD Llaima eruptions.
Fig. 1. Maps of south central Chile and locations of the main active volcanoes (red triangles). The largest triangles correspond to the locations of the present paleomagnetic sampling. Paleointensity results from bricks of two shelters built in the time interval 1766-1774 AD along the road from Chile to Argentina (Casuchas del Virey) provide an additional control on the intensity of the geomagnetic field in the 18th century. To further constrain the geomagnetic models in South America prior to the 18th century, we sampled 14C dated lavas from the Villarrica, Lonquimay and Cayutue volcanoes. Finally, we also report paleomagnetic results (direction and paleointensity) obtained from several lava flows with ages assigned to the historical period from three volcanoes (Villarrica, Llaima and Antuco) and we use the paleomagnetic results to discuss and refine the ages assigned to these flows.
Fig. 2. Paleomagnetic sampling map with GoogleEarth images for the four detailed studied volcanoes (Antuco, Llaima, Villarrica and Osorno). Antuco volcano: sites 12, 2,54,11 and 53 correspond to the most recent lava flows, which were responsible of the rise in the level of the lake “laguna del Laja”. Sites 3 and 4 correspond to a lava flowing from the western side of the volcano. Llaima volcano: red circles correspond to the sampling of the 1751 AD flow. Villarrica volcano: sites 43,45,73 and 74 (purple circles) correspond to an historical lava flow and the other sites are in lava flows with a 14C age below the flow at site R20. Osorno volcano: paleomagnetic sampling of the 1835 AD flows. Orange circles correspond to sites in the January 1835 flow while yellow circles correspond to sites of the December 1835 eruption. 2.0 Paleomagnetic sampling 2.1 Dated units 2.1.1 The Osorno 1835 AD eruption Osorno volcano (Fig. 2) is a high (2652 masl) stratovolcano that lies in a transversal NE-trending volcanic chain. The last historical eruptions were reported in 1778–1779 AD and 1835 AD (Petit-Breuilh, 2004). The area around the Llanquihue Lake was an isolated place until the second half of the 19th century and no local inhabitants served as direct eyewitnesses of the 1835 AD eruption of Osorno volcano. Charles Darwin was on board of the HV Beagle at that time and described the onset of the eruption from the Ancud bay in Chiloé Island (Darwin, 1840). Lara et al. (2012) provide a detailed 2 12 13 5 54 11 53 4 3 Antuco Volcano W71.4° S37.4° W71.35° 1km Lagu na de l Laja 22 15 58 24 19 60 16 14 18 17 66 65 64 63 105 106 107 108 109 1km W71.7° S38.85° S38.8° S38.75° S38.7° Melipeuco Lago verde Llaima volcano 72 46 44 45 43 R21 74 47 75 76 70 R20 71 73 Villarrica Volcano S39.35° S39.40° W71.93° W71.95° 1Km Villarrica Ski Resort Osorno Volcano 83 32 28 31 30 29 81 82 87 78 Lago Llanquihue Ensenada W72.6° W72.5° S41.15° S41.2° S41.1° 1km
cartography of the products of the 1835 AD volcanic eruption. Two main stages with lava flows emplacement and pyroclastic cones are recognized. The first stage occurred in January 1835 and the second stage occurred in December 1835. Two sites (81,82) were drilled in a thick lava flow belonging to the January eruption. Site 87 was drilled on the limit between the 1835 and the pre-historical lava sequence. Three sites (28, 32, 78) were drilled in flows attributed to the December 1835 volcanic eruption. Three sites (29, 30, 31) were drilled along the road to the ski resort. At these sites, the volcanic flows were correlated to a pre-historical event on the base of 14C ages of 240BP to 350BP (Lara et al., 2012) but new field evidences and the large uncertainties in the calibrated ages suggest that the sampled unit is part of the 1835 volcanic eruption. 2.1.2 Bricks of the “Casuchas del Virrey” Ambrosio O'Higgins proposed in 1765 to build houses to provide shelters to people transporting mail between Buenos Aires and Santiago de Chile while crossing the Andes. The shelters were built mainly with bricks and brick arches formed the roof. In Chile, the only shelter that is not destroyed is the one located in Juncalillo. At the Las Calaveras site a few kilometers to the east, the refuge is entirely destroyed. We collected pieces of broken bricks littered on the ground at both Juncalillo and Las Calaveras sites. The Juncalillo shelter was one of the first to be built and the Las Calaveras shelter was built a few years later in 1774AD. We assign an age of 1770±5 AD for these structures. The bricks were not fired at the locations of the shelters. However, the shelters were not made with ornamental bricks likely to be transported over large distances. In contrast, the artisanal bricks were probably made at short distances of the shelters either near Mendoza at about 100km to the east or near Los Andes at about 50km to the west, the two closest towns on both sides of the Andes. Two cores were drilled in the bricks. One was drilled orthogonal to the brick plane and the other within the brick plane. This procedure was chosen to better detect the importance of the magnetic anisotropy in the paleointensity determinations since the laboratory thermoremanent magnetization was given along the Z axis of the core. 2.1.3 The Llaima 1751 AD lava flow Llaima is one of the most historically active volcanoes in Chile with more than 50 eruptions since 1640 AD (Naranjo and Moreno, 2005).
Holocene volcanic activity at Llaima began with caldera collapse and eruption of the basaltic to andesitic Curacautin Ignimbrite (~13.5 ka). Historical volcanic activity of Llaima consists predominantly of Strombolian events. Six major effusive eruptions occurred between 1640 and 1957 (Petit-Breuilh, 2004). Prior to the 20th century, the 1751 event is the most well established event with a large lava flow filling the Trufultruful river. This flow was sampled at several sites. Site 18 corresponds to the bottom part of the flow while nearby site 14 was drilled in the brecciated flow top above site 18. Site 15 was taken near the Trufultruful waterfall and sites 16 and 17 were taken on small outcrops of the upper part of the flow. Site 19, 24 and 58 correspond to the
CL14_02
CL45_09
CL46_04
Fig. 3. Microscope observations in reflected light of titanomagnetites with dendritic structures for samples from three different rapidly cooled upper part of the lava flows (sample CL14_02: flow llaima 1751 AD; sample CL45_09: Villarrica uncertain 1787?; CL46_04: Villarrica: 14C dated).lower part of the 1751 flow where the brecciated upper part of the 1751 AD lava was eroded.
2.1.4 14C dated volcanic units
Lonquimay is a stratovolcano of late-Pleistocene to dominantly Holocene age. A prominent NE-SW fissure cuts across the entire volcano and extends 10 km to the NE with a series of NE-flank vents and cinder cones, some of which have been the source of voluminous lava flows like the major andesitic lava flow erupted in 1988-90 from crater Navidad. Two kilometers to the E-NE of the crater Navidad, we sampled one of two nearby volcanic vents. These vents are likely the source of a lava flow for which a 14C age of 200±40yr. BP (Sernageomin, unpublished data) was obtained on carbonized wood below the lava. Using the new calibration (SHcal13) curve for the southern hemisphere, calibrated ages provide three time intervals. From the historical record, we can discard the two youngest intervals and thus we consider that the probable age is within the time interval [1653-1818]. Villarrica is one of Chile's most active volcanoes with a 6-km wide caldera formed during the late Pleistocene (Lara, 2004; Clavero and Moreno, 2004; Moreno and Clavero, 2006). Villarrica volcano has a cone-like shape and its summit is occupied by a 200m diameter crater with a permanent lava-lake with a weak strombolian activity. One of the main Holocene volcanic event is the emplacement of a pyroclastic sequence (Pucon ignimbritie, Silva Pajeras et al., 2006) with a calibrated age range of 1920-1690BC (Roperch et al., 2014). We sampled the lava flow overlying this pyroclastic sequence and found pieces of charcoal below the flow (39°S 22.697’, 71°W 57.049’) providing a 14C age of 500±30BP (calibrated age range 1408-1464 AD). This age is in good agreement with one of 530±50BC found in charcoal near the town of Pucón. The flow was sampled at several sites within the Zanjon seco valley (Fig. 2). At two sites (46 and 72), we sampled the rapidly cooled upper part of the lava flow. At some sites (44,47, 71), where the fragile part is eroded, the samples correspond to the massive part of the lava with well-crystallized large plagioclases. At site 71, the plagioclase-rich lava is overlain by a flow with smaller plagioclase crystals.
Nearly 300km farther south, we sampled lava blocks and scorias dated by 14C at 400±40BP south of the Cayutué laguna (calibrated age range 1454-1627 AD). This volcanic unit is likely associated with the activity of the Cayutué volcanic field with
maars and cinder cones of Holocene age. The quality of the outcrop is however not as good as most of the other sites sampled in this study. 2.2 Historical flows with uncertain ages 2.2.1 The Antuco historical activity Antuco volcano, constructed to the NE of the Pleistocene Sierra Velluda stratovolcano, is located along the SW shore of the Laguna del Laja lake. About 10,000 years ago, a large collapse of the volcano caused the damming of the Laguna del Laja lake. A central basaltic-to-andesitic cone has grown 1000 m since then in the old structure with some side emissions centers. Moderate explosive eruptions were recorded in the 18th and 19th centuries from both summit and flank vents, and historical lava have flown into the Río Laja drainage (Fig. 2). Thiele et al. (1998) indicate that a large eruption in 1852-1853 induced a lake level change of about 20m by closing further the waterfall from the lake. However, as it was described by Domeyko in 1845 (in Petit-Breuilh, 2004) during his visit to the Antuco volcano, Antuco was already a very active volcano and several lava flows formed the lava fields on the northern flank. We collected several sites along the road that goes to the Laguna del Laja lake. Sites 3 and 4 correspond to a flow that was emitted on the western side of the Antuco volcano and reached the Laja river at an elevation of 980m (Fig. 2). Sites 5, 13 were drilled along the road at elevation of 1240, 1350m respectively. In the field, the youngest flows are those sampled further east and closest to the lake (sites 2,12,53,11 and 54) at an elevation of about 1400m. Samples from nearby sites 11 and 53 are grouped into one site. 2.2.2 Llaima volcano On the southern side of the Llaima volcano (Fig. 2), we sampled only one site (site 22) on the broken blocks making the top of a recent lava flow attributed to a 1780 AD event by Naranjo and Moreno (2005) and also reported on the map of Bouvet de Maisonneuve et al. (2012). Reubi et al. (2011) suggest that the lava flow, sampled at site 60, that created the small Arco Iris lake corresponds to an eruption in 1852 AD. This lava flow is associated to a fissural emission and cones on the northeastern flank of the volcano. Bouvet de Maisonneuve et al. (2012) indicate a 14C age of ~1850 AD without age uncertainty for this Fissural 3 event. The age of this flow is thus uncertain because of the low resolution
of 14C dating but this flow clearly corresponds to an historical eruption of the Llaima volcano. We sampled only the broken blocks on top of this flow (site 60) because it was impossible to find a very good outcrop. Field evidences show that the unstable broken lava blocks were tilted after cooling. Samples from this site were used only for paleointensity determinations. Finally, we made two short sections. One corresponds to four flows drilled below the 1751 AD flow (from top to bottom, 66,65,64,63). A sequence of 5 flows (from top to bottom 105 to 109) was also drilled farther north (Fig. 2). Despite its apparent oldest shape due to the erosion of the fragile upper part, the upper flow (105) is likely an historical lava flow, which could be contemporaneous with the Fissural activity described above and sampled at site 60. For these two sequences we sampled mainly the massive part of the lava flows. 2.2.3 Villarrica volcano A detailed eruptive chronology was first established by Petit-Breuihl (1994) and modified by Lara (2004). Despite the numerous eruptions reported since 1558, only one lava flow is reported prior to the beginning of the 20th century. This lava flow is supposed to have been emplaced in 1787 AD in the Zanjon seco valley. We made a detailed field sampling of the historical flow attributed to the 1787 AD event at 4 sites (43,45, 73 and 74). Sites 45 and 74 correspond to the rapidly cooled lava blocks making the roof of the lava flow. In contrast, at site 73, the fragile upper part of the flow was eroded and we sampled the massive lower part of the lava. 3.0 Paleomagnetic methods 3.1 Field work Samples were drilled in the field with a gasoline portable drill and were oriented with magnetic and sun compasses. Differences between the magnetic declination expected from the IGRF model and the magnetic declination determined from the combined magnetic and sun compasses measurements were often significant and up to 10° because of the strong magnetization of these young lava flows. The sample orientation is made with the Pomeroy orienting device and the magnetic compass is at about 20-30cm from the rock and very sensitive to the shape of the outcrop in strongly magnetized lavas.
In order to test the importance of magnetic anomalies due to the underlying lavas and basement magnetism, we made some direct measurements in the field in the same areas where the paleomagnetic sites were sampled. We use a MEDA FVM-400 three axis fluxgate magnetometer. Due to the large magnetic anomalies induced by the nearby rocks, we made the measurements on relatively flat areas and with the magnetometer at about 1.2 m above the ground. The fluxgate magnetic sensor was oriented using a sun compass and the true north declination was calculated using the same procedure used to orient the paleomagnetic samples. Magnetic measurements were made at seventeen stations for the Antuco volcano and 18 stations for the Llaima. For the Llaima volcano, the mean geomagnetic field measured in the field (N=18, D=6.3, I=-39.5, α95=1.6, K=449, F=25.9µT) compares well with the expected IGRF field direction (D=6.6, I=-39.0, F=25.6µT). For the Antuco volcano, the mean geomagnetic field direction is (N=17, D=3.4°, I=-36.4°, α95=1.5, K=531, F=25.9µT) which is slightly different from the expected IGRF field (D=5.6°, I=-37.7°, F=25.2µT). A small magnetic anomaly (2 to 4°) is thus possible especially for the sites near the lake where the lava flows entered the Laguna del Laja lake making a small scarp. The present day field is especially low (~26µT) and about half the mean value expected for the 18th century from the gufm1 model. The present-day magnetic anomalies should thus be roughly 1.5 to 2 times stronger than the magnetic anomalies present at the time of emplacement of the oldest flows. While the measured field calculated from several stations is in good agreement with the expected IGRF field, it is important to recognize that paleomagnetic results from sites in lava flows filling small ravine in underlying flows are likely the most prone to departure from expected fields. When several paleomagnetic results are available from spatially distributed sites in the same volcanic unit, the mean direction and mean paleointensity will not be significantly affected by a local magnetic anomaly. Therefore caution is advised when only one or two paleomagnetic sites are available. 3.2 Laboratory experiments A specimen per core was progressively demagnetized with the online 2G AF degausser and measured with the 2G magnetometer. Some samples with strong magnetization were AF demagnetized by the Schonstedt degausser and measured with the Molspin or Agico JR5 spinner magnetometers.
Fig. 4. Hysteresis data (Mrs/Ms vs. Hcr/Hc) for samples of lava flows and bricks (green circles). Red circles correspond to the upper part of the flow with rapid cooling while blue filled circles are samples from the more massive internal part of the lava flow. Curves and domains modified from Dunlop (2002). The Thellier and Thellier (1959) method was applied for paleointensity experiments and heating/cooling were performed under a primary vacuum (10-2 Torr) except for samples from bricks that were heated in air (see also Roperch et al., (2014) for more information about the paleointensity method). We always attempted to sample the diverse parts of a lava flow whenever possible. We do not use specific criterions to select samples prior to paleointensity experiments. Samples with the largest NRM intensity and without secondary magnetization provide better quality paleointensity determinations than samples with lowest NRM intensity. High intensities of NRM correspond to samples with the highest Koenigsberger ratio and likely a largest contribution of single domain grains. We rejected paleointensity experiments when the partial TRM checks (pTRM) were negative. During the last 15 years, numerous papers have addressed the problem of non-linerarity in Thellier experiments (see Dunlop, (2011) and Chauvin et al., (2005) for a review of methods and problems in paleointensity determinations). The determination of the paleointensity
0.1
1
1
2
3
4
5
6
7 8 9
10
TM60 20nm SD+MD Magnetite TM60 SP+SD mixing curves Magnetite 10nm0.2
0.3
0.4
0.5
0.6
0.8
Mrs/Ms
Hcr/Hc
SP saturation enveloppe
Flow tops Bricks
Flow massive parts
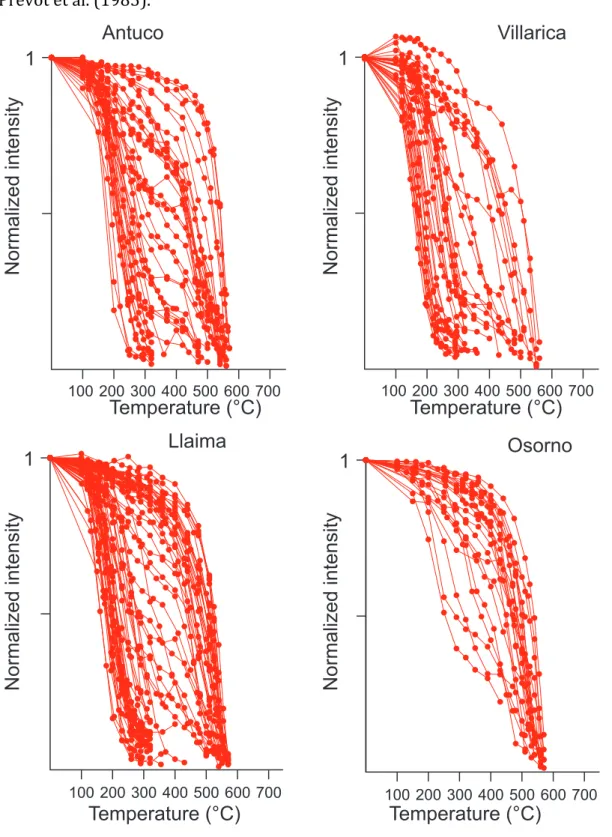
and its quality factor q were made following the method proposed by Coe et al. (1978). The weighted mean paleointensity for a site was calculated using the method given by Prévot et al. (1985). Fig. 5. Plot of the normalized intensity of NRM versus temperature. The NRM was calculated from the two measurements at one temperature step during paleointensity experiments with the Thellier method. 100 200 300 400 500 600 700 1 100 200 300 400 500 600 700 1 100 200 300 400 500 600 700 1 Antuco Villarica Llaima Osorno 100 200 300 400 500 600 700 1 Normalized intensity Normalized intensity Normalized intensity Normalized intensity Temperature (°C) Temperature (°C) Temperature (°C) Temperature (°C)
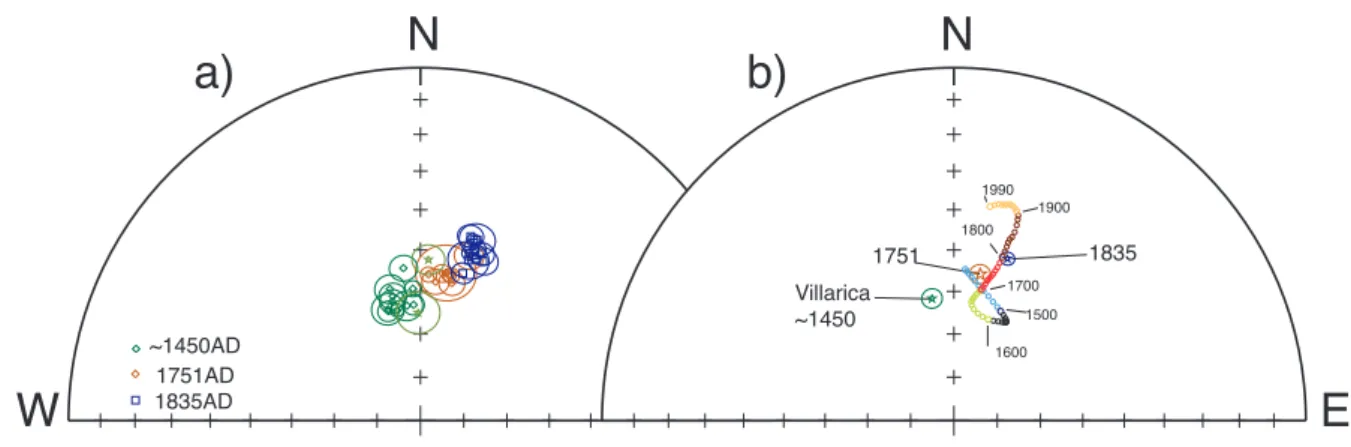
Hysteresis curves were obtained with the AGM vibrating magnetometer and FORC diagrams were processed with the FORCINEL software (Harrison and Feinberg, 2008). Thermomagnetic experiments and anisotropy of magnetic susceptibility were done with the AGICO KLY3 kappabridge. The Agico CS3 furnace was used with the KLY3 kappabridge to measure the susceptibility variation with temperature (K-T experiments). Fig. 6. a) Equal-area stereonets of the characteristic directions from sites from the 1835 AD flow from Osorno (blue squares), 1751 AD Llaima flow (brown diamonds) and 14C dated lavas (~1450 AD) at Villarrica; the directions for the Lonquimay and Cayutue units are shown with a star. b) Comparison of the mean directions determined for the three groups shown in (a), with the expected directions from 1400 AD to 1990 AD calculated every ten years with the Cals3k.4 model. Each century is shown with distinct colors to facilitate the identification of the time interval. Open symbols correspond to negative inclinations. 4.0 Magnetic properties. The studied lava flows correspond to basalt – andesite lavas and the magnetic properties vary mainly according to the position of the sampling within a flow. Several sites were drilled in the brecciated upper part of lava flows with large blocks apparently not disturbed after initial cooling (site 14, 22 at Llaima volcano, sites 45,46, 72 and 74 at Villarrica volcano). Field evidences for broken displaced blocks after cooling were however observed at site 60 (Llaima volcano). These sites correspond to the rapidly cooled part of the lava flows that are characterized by specific magnetic properties. Intensity of the natural remanent magnetization (NRM) is usually high (> 10 Am-1) and the Koenigsberger ratio calculated in a dc field of 45µT are often larger than 100. Observations with a microscope under a reflected light or with a scanning electron microscope always indicate well-defined dendritic structures (Fig. 3). Hysteresis parameters (Fig. 4) and FORCs (supplementary Fig. 2) indicate that the magnetization is
N
W
a)
b)
E
N
1900 1800 1700 1600 1500 1990 1835 1751 Villarica ~1450 1835AD 1751AD ~1450ADmainly dominated by single domain grains in the upper part of the flows and pseudosingle domain grains in the more massive part of the lava flow. Although the size of the dendrites is often larger than the size expected for single domain grains, our results confirm the observations of Shaar and Feinberg (2013). These authors indicate that dendrites built from branches of interconnected octahedra, typical for basaltic glass, have a stable, high coercivity, SD-like magnetization despite the E Down N NRM 1 TRM 1 10CL3205A NRM = 17.7 A/m Hlab = 50.0 µT Q = 43.9 H = 45.1 µT 340 460 500 520 N Down E 11CL7217B NRM 1 TRM 1 NRM = 33.6 A/m Hlab = 50.0 µT Q = 44.0 H = 49.1 µT 120 200 290 N Down E 10CL1401A NRM 1 TRM 1 NRM = 37.9 A/m Hlab = 50.0 µT Q = 29.1 H = 50.8 µT 155 200 260
a)
b)
c)
d)
NRM 1 TRM 1 12CL9010B NRM = 19.4 A/m Hlab = 60.0 µT Q = 53.5 H = 53.6 µT 240 470 560 N Down E Fig. 7. Examples of successful paleointensity determinations with the Thellier and Thellier method and corresponding orthogonal plot of the demagnetization (open, filled symbols are projection in the horizontal and vertical plane). a) sample of Osorno 1835 flow; b) sample of the 1751 flow; c) sample from the site at Lonquimay; d) sample from one site of the Zanjon seco lavas.fact that their overall dimensions exceed the SD-MD threshold. The main magnetic carrier is a Ti-rich titanomagnetite with Curie point < 300°C but these samples contain also a smaller amount of Ti-poor titanomagnetite as seen in the K-T plots (supplementary Fig. 3). Samples from the upper part of the flows have also low unblocking temperatures (Fig. 5). In contrast, high Curie points (Supplementary Fig. 3) and high unblocking temperatures (Fig. 5) are usually found in samples from the more massive parts of the lava flows while hysteresis parameters indicate pseudo-single domain behavior (Fig. 4). Fig. 8. a) Variation of the intensity of the NRM during AF (red curves) and thermal demagnetization (green curves). b) Example of a paleointensity determination for one sample of the Las Calaveras site. c) Orthogonal plot of the NRM evolution during the Thellier and Thellier experiment. There has been a lot of discussion with respect to the contribution of multidomain grains in failed paleointensity experiments. In our study, non linearity expected due to multidomain grains was not the main cause of failure in paleointensity experiments. Negative pTRM checks are often observed in the temperature range 350-500°C for several samples with Ti-poor titanomagnetite as the main magnetic carriers. Examples of rejected samples are given in supplementary Fig. 4. Samples in flow tops, with Ti-rich titanomagnetite carriers provided paleointensity determinations with a high success rate because chemical alteration during heating in paleointensity experiments was minimized since it was not necessary to heat these samples at high temperatures. 20 40 60 80 100 120 140 100 0 0 200 300 400 500 600 1
demagnetizing field (mT)
Temperature (°C)
TH AFnor
maliz
ed in
tensit
y
N
Down
E
11CA0701A
NRM
1TRM
1 NRM = 18.4 A/m Hlab = 50.0 µT Q = 87.1 H = 48.1 µT 220 360 490a)
b)
c)
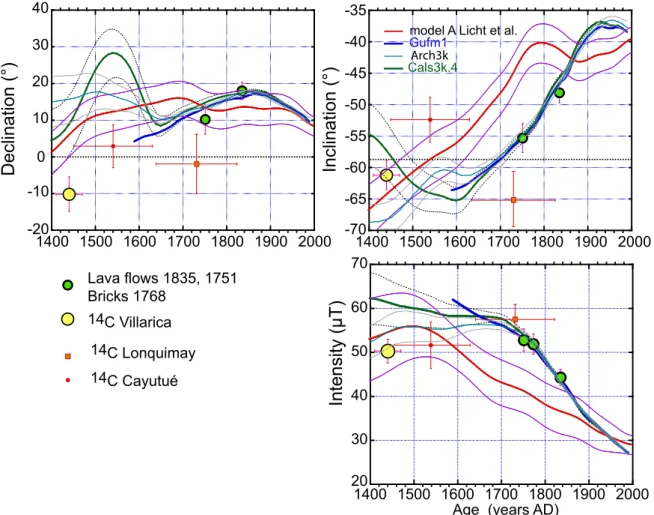
Anisotropy of magnetic susceptibility measurements give low anisotropy values (90% of the samples have AMS lineation and foliation degree lower than 1.02) with large intra-site scatter of the orientation of AMS ellipsoids. TRM anisotropy is also low and difficult to determine accurately. For this reason, the paleointensity data in the volcanic rocks were not corrected for anisotropy. Fig. 9. Comparison of the variation of the observed declination, inclination and paleointensity with geomagnetic models. Cooling rate is a factor susceptible to bias paleointensity determinations (Yu, 2011). Fast cooling rates during laboratory experiments result in overestimated paleointensity values in samples with small single domain grains while the contribution of large grains is likely to underestimate paleointensity values. Cooling rate effect has been documented in rapidly quenched volcanic glasses (Leonhardt et al., 2006). Our samples from the rapidly cooled flow tops show titanomagnetites with dendritic structures. The grain size is however higher than the grain size in rapidly quenched volcanics like the juvenile clasts of pyroclastic deposits (Roperch et al., 2014). We attempted cooling rate experiments in 15 samples from 5 sites (14, 22, 54, 74 and 60). The slow cooled TRM -20 -10 0 10 20 30 40 1400 1500 1600 1700 1800 1900 2000 Gufm1 Cals3k.4 14C Villarica 14C Cayutué 14C Lonquimay 20 30 40 50 60 70 1400 1500 1600 1700 1800 1900 2000 Age (years AD)
Intensity ( µ T) Inclination (°) Declination (°) -70 -65 -60 -55 -50 -45 -40 -35 1400 1500 1600 1700 1800 1900 2000
model A Licht et al. Arch3k
Lava flows 1835, 1751 Bricks 1768
was given at a constant cooling rate of 0.3°C/mn while the cooling rate during the standard paleointensity experiments is not linear with a mean cooling rate of about 10°C/mn. Fig. 10. a) Comparison of the paleointensity data in Brazil (Hartmann et al., 2010,2011) and Chile (flow 1835 AD, 1751 AD and bricks 1770±5 AD) with the expected paleointensities from model Cals3k.4 at each site. The present-day field is shown by the arrows for the Salvador and Sao Paulo in Brazil and Villarrica in Chile. The error bars on the values calculated with model Cals3k.4 are the errors provided with model Cals3k.4b. b) Differences in intensity between the data and model shown in (a) with respect of the age. We found no significant trend with a mean cooling rate of ~0% with a standard deviation of ~5%. These experiments suggest that no systematic cooling rate effect should be expected in these lava flows. We thus consider that anisotropy or cooling rate effects are unlikely to bias systematically the paleointensity determinations but they can contribute to the within-site scatter of paleointensities characterized by a standard deviation often about 10%. Bricks sampled at Juncal and Las Calaveras sites have similar magnetic properties with NRM values varying from about 1 to 20A/m and magnetic susceptibilities betwen 0.005SI and 0.02SI. The strong magnetization clearly indicates that these bricks were fired at high temperature. More than two third of the magnetization was usually unblocked in between 150° and 500°C. As shown by the AF demagnetization, there is a high coercivity magnetic phase carrying 10 to 30% of the NRM that is not AF demagnetized. This magnetic phase produce the typical wasp-waisted hysteresis loops 20 30 40 50 60 20 30 40 50 60 Sao Paulo Salvador
Intensity (µT) from model Cals3K.4 Year (AD)
a)
b)
-20 -15 -10 -5 0 5 10 15 20 1600 1700 1800 1900 Sao Paulo Salvador Chile Chile Paleoin tenist y obser ved (µT ) D iff er enc e b et w een obser ved and mo del (µT )(supplementary Fig. 5). Thermomagnetic experiments in low field do not permit the identification of this magnetic phase (supplementary Fig. 6). This high coercivity magnetic phase is commonly observed in baked clays but has not been clearly identified (McIntosh et al., 2011). It is very stable and enables the determination of accurate paleointensities (Chauvin et al., 2000; McIntosh et al., 2011). Fig. 11. Equal-area stereonets of the characteristic directions from paleomagnetic sites and predicted path from the Cals3k.4 model (all data relocated to Villarrica). a) results from the 1787 AD flow from Villarrica (blue triangles); b) for all sites sampled in the Antuco volcano; c) directions observed at two sections at Llaima and comparison with the mean direction determined for the LLaima 1751 flow (red star) and Zanjon seco flow at Villarrica (black stars). The green diamond is the results from site 22; d) comparison of the mean directions for the two groups of flows at Antuco and Villarrica with the Cals3k.4 model. We report successful paleointensity determinations for 146 samples. To illustrate the high quality determinations, statistical distributions of 3 parameters (f fraction, quality factor f and the angle dang) are given in supplementary Fig. 7. 5.0 Paleomagnetic results in dated units Characteristic directions were determined after progressive alternating field demagnetization showing characteristic univectorial magnetizations. Mean-site
c)
d)
a)
b)
N
W
N
W
E
N
E
N
Villarrica 1787 Antuco 1Antuco 2
Villarrica 1787
Villarrica ~1450AD Antuco 1
Antuco 2 Llaima 1751 Section A Section B 1900 1800 1700 1600 1500 1990 1900 1800 1700 1600 1500 1990 1900 1800 1700 1600 1500 1990 1900 1700 1800 1600 1500 1990
characteristic directions are well determined with semi-angles of confidence of about 2 to 3°. The largest scatter (α95 of 6.7°) corresponds to site 14 drilled in a brecciated flow top. 5.1 The Osorno 1835 AD eruption Lara et al. (2012) provide a map of the expected two main January and December 1835 events. The characteristic direction of the three sites (29, 30, 31) possibly belonging to an older volcanic event are statistically in agreement with the directions found at sites from both 1835 events (Fig. 6a, Table 1). The paleomagnetic data thus confirm some field evidences suggesting that this uncertain volcanic unit is one of the flow of the 1835 eruption cycle. Site 87, which has a slightly highest inclination, could correspond to a slightly oldest event and we thus do not include this site in the calculation of the mean direction. The mean direction calculated from the 9 sites (without site 87) is (D=18.3; I=-50.0; α95=1.6; N=9). Paleointensity experiments were carried on 29 samples. As seen in Fig. 5, all the studied samples from Osorno have medium to high unblocking temperatures. Unfortunately, 15 samples had PTRM checks indicating some changes in the NRM-TRM unblocking and blocking temperature ranges. Only 14 samples provided apparently reliable paleointensity results with high NRM fractions used in the mean calculation (Fig. 7a, supplementary Table 1). The two samples from site 87 provided the highest paleointensity values (55-57µT). Since the direction recorded at site 87 is also slightly different from the directions recorded at other sites, we speculate that this site may correspond to a slightly older volcanic unit. Sample 10CL2903A gives an anomalous low paleointensity of 29.7µT and was not included in the mean calculation. We thus calculated the mean paleointensity value for the 1835 event with 11 determinations from 4 sites (28,29,31,32, weighted mean 45.2±3µT). There is no difference between the arithmetic, weighted and geometric means indicating no bias in the calculation of the mean (Table 2). 5.2 Bricks of the Casuchas del Virrey Paleointensity determinations were made on 9 samples of the Las Calaveras and 5 samples of the Juncal site using a temperature range 140-490°C (Fig. 8) with high NRM fractions and high quality factors q from 24 to >100 (supplementary Table 1). TRM
anisotropy is low (anisotropy degree between 1.05 and 1.1) and the mean paleointensity value determined from the 14 samples before and after anisotropy correction is not changed (same weighted mean of 48µT) but the scatter is slightly reduced (standard deviation 2.5 to 2.3µT). Cooling rate experiments at 490°C were performed with a constant cooling rate of 0.3°C/min. The mean paleointensity (47.4µT±1.7) is reduced by only 0.6µT after cooling rate correction. 5.3 The LLaima 1751 AD flow The mean direction calculated for the 8 sites is D=10.1°; I=-54.7°; α95=2.3°. Paleointensity determinations were attempted on 37 samples. Most of the 23 successful paleointensities were obtained on samples with low unblocking temperatures and Ti-rich titanomagnetic carriers (Fig. 7b) except two samples from site 58 with high unblocking temperatures (supplementary Table 1). The weighted mean paleointensity is 52.4µT±6.1 (Table 2). 5.4 14C dated volcanic units 5.4.1 Lonquimay volcano Site 90 was drilled on lava blocks and the scatter is slightly larger (Fisher parameter k of 80) than for sites drilled in massive lava flows. The mean direction was calculated with 12 samples out of 13. In contrast with all other sites from lava blocks of flow tops, samples from site 90 have high unblocking temperatures. However these samples provided high quality paleointensity determinations in the six studied samples (Fig. 7c). The weighted mean paleointensity is 57µT±4.3 (supplementary Table 1; Table 2). 5.4.2 Cayutué The paleomagnetic direction determined at this site is (D=3.0°; I=-54.4°; α95=2.9°). Four samples out of six studied samples provided paleointensity results with a weighted mean paleointensity of 52.6µT±4.3 (supplementary Table 1; Table 2). 5.4.3 The Zanjon seco flows at Villarrica volcano. Ten sites were drilled in lava flows overlying the Pucon pyroclastic sequence (Silva Pajeras, 2010). As shown in Fig. 6a, the characteristic directions are well-grouped with a NNW declination and steep inclination except for site 75 which has a slightly lower inclination. The mean direction is (D=349.8°, I=-61.2°, α95=2.3°) (Fig. 6b).
Twenty nine paleointensity experiments were performed and 19 reliable results were obtained. Most results are from samples of the two sites 46 and 72 where the upper part of the rapidly cooled lava was sampled (Fig. 7d). The mean paleointensity values for samples of sites 46 and 72 are identical (50.1±5.2 and 50.2±7.4). With the addition of three results from three other sites, a mean paleointensity of 50.3±6.1 is calculated from these 19 determinations (supplementary Table 1; Table2). 6.0 Comparison with geomagnetic models. The paleomagnetic data (Table 3) are compared with four models, gufm1, Cals3k.4, Arch3k, and the recent model proposed by Licht et al. (2013) (Fig. 9). The original gufm1 model (Jackson et al., 1990) considers a linearly decreasing dipole field prior to 1820 AD. The model Cals3k.4 is tied to the gufm1 model but attempt to better constrain the variation of the dipole field prior to 1820 AD. Licht et al. (2013) provided three models that are not tied with the gufm1 model. We use model A which is based on archeomagnetic and paleomagnetic data (Licht et al., 2013) and we discard models based on sediment data. We do not consider the model of Nilsson et al. (2014), which also includes sediment data, because of its low temporal resolution. The model proposed by Pavón-Carrasco et al. (2014) for the last 14 000 yr. is tied to the gufm1 model for the last 4 centuries and not significantly different from the Cals3k.4 model for the period considered in the present study. In order to facilitate the comparison between the observed data and the geomagnetic models, all the directions have been relocated to the Villarrica site using the virtual geomagnetic pole. The Osorno volcano is at about 200km from the Villarrica volcano and the relocation is unlikely to introduce significant errors. Bricks from the Casuchas del Virrey are at more than 700km to the north but the correction by the relocation with the geocentric axial dipole is only about 3µT. The 1835 AD flow from the Osorno volcano and the 1751 AD flow from the Llaima volcano are the only flows with a precise age and the mean directions for these units were determined on several different sites. We can thus expect that field disturbances like an undetected tilt of the rock at the outcrop scale or magnetic field anomalies are cancelled out and that the mean direction is an excellent determination of the geomagnetic field at the time of emplacement of the volcanic rock. The direction of a
single site, like those of Cayutué or Lonquimay (Fig. 6a) should be interpreted with more caution. The mean directions observed for these 1835 and 1751 flows compare well with the gufm1 model (Fig. 6b and 9). The paleointensity of the geomagnetic field recorded by these two flows and by the 1770±5 AD bricks also document the reliability of the gufm1 model for the last three centuries. Model A from Licht et al. (2013) departs strongly from the gufm1 model. Paleointensity data from eastern Brazil (Hartmann et al., 2010, 2011) are the most reliable archeomagnetic data available for South America for the last 5 centuries. Unfortunately, there is no directional data and the amplitude of the secular variation in intensity is significantly less important in Brazil than in Chile (Fig. 10a). It is dificult to evaluate the growth of the South Atlantic Geomagnetic Anomaly with the Brazilian paleointensity data only. The sparse amount of archeomagnetic or paleomagnetic data in the southern hemisphere and especially in South America, used by Licht et al. (2013) to produce model A, likely explains the poor fit to the most relevant geomagnetic secular variation feature of the last three centuries. The same problem is found for model pfm9k.1 from Nilsson et al. (2014). Paleointensity data obtained in Chile and Brazil are in good agreement with geomagnetic model Cals3k.4 and the largest differences are found for the time period prior to 1650 AD (Fig. 10b). The growth of the South Atlantic geomagnetic anomaly is not detectable in the southern part of South America prior to 1700 AD. The mean direction recorded in the Zanjon seco lavas (Villarrica) dated at 500±30BP (calibrated age of 1440±30 AD) is different from the expected directions in both the Cals3k.4 or Licht et al. models. The secular variation curves from all models in the time interval 1400-1650 are thus not reliable for paleomagnetic dating. We can thus use the geomagnetic models to better constrain the age of the historical lava flow with an uncertain age only for lava flows younger than ~1650 AD. 7.0 Paleomagnetic dating of historical lava flows. Korte and Constable (2011) suggest to use the Cals3k.4 model for Earth’s surface studies. This model is strongly tied to the original gufm1 model. We use the Cals3k.4 model with the standard error provided with the model Cals3k.4b to assess the age of some of the lava flows. As discussed above, these units are unquestionably historical flows but we
will show that the very high geomagnetic secular variation during the last three centuries in South America enables high resolution paleomagnetic dating. 7.1 The 1787 AD volcanic flow from Villarrica volcano Four sites were drilled in this flow expected to be the product of the 1787 AD eruption. Sites 45 and site 74 come from the rapidly cooled upper fragile part of lava flow which was eroded at site 73. A mean direction of D=16.9°; I=-45.4°; α95=3.2 is calculated for this flow in agreement with an eruption during the 19th century and not in the 18th century (Table 1, Fig. 11a, 12). Paleointensity experiments were carried on 15 samples and 13 samples provided reliable paleointensities with large NRM fractions (supplementary Table 2, Table 2). A weighted mean paleointensity of 45.4±4.8 µT is obtained for this flow. Using Bayesian statistics to compare the paleomagnetic data with the Cals3k.4 curve, paleomagnetic dating provides an age interval of 1815-1859 at 95% for this flow (supplementary Fig. 8). Up to four eruptions with a VEI of 2 are reported in this time interval (1822; 1832; 1837; 1852-1853)(Petit-Breuilh, 2004) but without evidence for a lava flow. The paleomagnetic results indicate that the flow could correspond to one of these four events. 7.2 The Antuco volcano The palomagnetic directions determined for the eight sites sampled along the road to the Laguna del Laja lake are distributed along a path that is not very different of the expected directions from global geomagnetic models since 1750 AD (Table 1, Fig. 11b). The sites with the highest inclinations are those located to the west and sites recording the shallowest inclinations are those located nearby the lake border. The distribution of the paleomagnetic directions is in agreement with the proposition that sites near the lake correspond to the latest effusive eruptions of the Antuco volcano. Site 2 has however an inclination that is 5° to 10° too low and this site may record a slightly anomalous inclination. Site 5 records the highest inclination suggesting an eruption by the end of the 18th century while sites 4, 3 and 13 are in agreement with an eruption during the 19th century.
We think that it is difficult to date each unit and we separate the lava flows in two groups. The first group corresponds to sites in lava flows along the road before to reach the Lake (Antuco 1) and the sites in the lava flows near the lake (Antuco 2). The mean direction for the Antuco 1 group is (D=13.1°; I=-46.1° α95=3.8°; k=573). For the Antuco 2 group, the anomalous low inclination at site 2 might be the consequence of an undetected tilt and we calculate the mean with the other three sites (D=15.8°; I=-35.9°; α95=5.4°;k= 517). Paleointensity experiments were carried on 40 samples and paleointensity results were obtained in 30 samples (Supplementary Table 2). Sites 2 and 54 have low Curie points and low unblocking temperatures while samples from site 13 contain mainly low-Ti titanomagnetites. A weighted mean paleointensity of 40.9±6.5µT is determined for all samples from the three sites near the lake while a weighted mean paleointensity of 48.1±5.4µT is obtained for the three other sites (3, 4 and 13). Both the directions and paleointensities support field evidences that the volcanic flows to the west are slightly older than the flows near the lake (Fig. 12). The age estimated with the mean-direction of the Antuco 1 group corresponds to the interval 1784-1848 AD while the mean paleointensity is in agreement with an age interval (1747-1826 AD). After combining the direction and the paleointensity, the most probable age for the emplacement of the Antuco 1 lavas is 1782-1819 AD. The paleomagnetic directions of the sites near the lake suggest an emplacement during the beginning of the 20th century while the paleointensity data indicate a period of emplacement in the time interval 1822-1869 in better agreement with the expected large eruption of 1852-1853 AD. We suspect that part of the inclination shallowing might be due to some amount of magnetic anomaly and a possible small tilt (<5°) toward the north. As discussed above, the present-day magnetic anomalies are not large on average but we cannot reject the hypothesis that some sites like site 2 are indeed affected by some terrain effect. In that case, the paleointensity is a parameter that is not affected by terrain movement and is a necessary complement to improve paleomagnetic dating. The paleomagnetic results suggest that lava flow emissions along the north-western flank of the Antuco volcano occurred during a time interval of about a century starting in the middle of the 18th century as proposed by Petit-Breuilh (2004).
7.3 The Llaima volcano 7.3.1 The 1780 AD flow (site 22) The flow attributed to a 1780 AD volcanic eruption was sampled at site 22. A mean direction of D=9.4°; I=-41.4°; α95=4.2° was obtained for this site (Table 1). Samples from this site correspond to the rapidly cooled flow top with Ti-rich titanomagnetite as the main magnetic carrier. The low unblocking temperatures of the NRM permitted good paleointensity determinations on 8 samples from this flow with a weighted mean value of 38.9±4.7 µT (supplementary Table 2). Both the paleointensity and the direction are in disagreement with the proposed age for this flow when compared to secular variation models. This flow is likely to have been emplaced in the time interval 1820-1900 AD and not in 1780 AD. In her review of the historical activity of the Llaima volcano, Petit-Breuilh (2004) indicates that a volcanic event occurred in December 1875 – January 1876. The flow sampled at site 22 could be a product of this eruption. 7.3.2 The flow sequence A below the 1751 AD. Sequence A corresponds to sites 63-66 sampled in a vertical section ~20 m below the 1751 AD flow. This sequence is undated but there is no field evidence like baked soils to suggest a large time interval with the overlying historical 1751 AD flow. The field direction recorded at the two bottom sites is clearly different from the 1751 AD mean direction with a NNW declination (Table 1, Fig. 11) but close to the direction recorded at Villarrica for the Zanjon Seco lava sequence with an age around 1450 AD. 7.3.3 The Fissural 3 event (site 60) This flow was sampled at site 60. Unfortunately, it was obvious in the field that the broken flow tops were unstable and moved during or after cooling. The scatter of the univectorial characteristic magnetizations determined after AF or in the course of paleointensity experiments demonstrate however that the blocks were tilted after cooling and not during cooling. Paleointensity experiments were carried on 11 samples and accurate results were obtained on 10 samples. Except one sample (CL6013B) showing two magnetic phases, all the other samples have only Ti-rich titanomagnetite carriers with medium destructive temperature of about 200°C. Again the low unblocking temperatures provided a high success rate of high quality paleointensity results (mean quality factor of 32), (Table 2, supplementary Table 2).
The weighted mean paleointensity is 51.0µT±3.6 and the comparison with the geomagnetic model provides a best age interval at 95% (1736-1801 AD). Fig. 12. Comparison of the mean paleomagnetic results with geomagnetic models. Same as in Figure 9. The red circles correspond to the paleomagnetic results with their initial age assignment. A simple adjustment in age, shown with the black arrow improves the fit between the data and the models anchored to the gufm1 model. 7.3.4 The Fissural flows sequence B. While the Arco Iris lava flow comes from the N-NE border of the parasitic cones, other lavas were emitted from the other side of the cones and site 105 was likely drilled in one of this flow. This interpretation is in agreement with the extent of the Fissural 3 event proposed by Reubi et al. (2012). The upper site (105) sampled at section B (105-109) has a paleomagnetic direction providing the same age interval (1736-1815) than the Fissural 3 flow. In both cases the most probable age is in the time interval 1770-1790 suggesting that the Fissural event occurred in 1780 AD which is the main event following the 1751 AD large eruption -20 -10 0 10 20 30 40 1400 1500 1600 1700 1800 1900 2000 Gufm1 Cals3k.4 14C Villarica 14C Cayutué 14C Lonquimay 20 30 40 50 60 70 1400 1500 1600 1700 1800 1900 2000 Age (years AD)
Intensity ( µ T) Inclination (°) Declination (°) -70 -65 -60 -55 -50 -45 -40 -35 1400 1500 1600 1700 1800 1900 2000
model A Licht et al. Arch3k Lava flows 1835, 1751 Bricks 1768 Villarrica 1787 ==> ~1822 Llaima 1852 ==> ~ 1780 Llaima 1780 ==> ~ 1870 Antuco 1 & 2
As for sequence A below the 1751 AD flow (sites 63-66), the same direction with a NNW declination is observed at the base in flows 108 and 109 (Table 1). This direction is close to the one observed in the Zanjon Seco lavas with a calibrated age in the first half of the 15th century. We speculate that both sections A and B illustrate the secular variation during the 15th, 16th and 17th centuries and these results support a more simple secular variation path between 1750-1450 AD than the large loop proposed by the Cals3k.4 geomagnetic model (Fig. 11c,d). 8.0 Conclusion The paleomagnetic results from several sites in two well-dated lava flows (1835 AD and at 1751 AD) and in bricks from two shelters along the road crossing the Andes north of Santiago confirm the exceptional geomagnetic secular variation in western South America over the last 3 centuries with an almost linear decrease in magnetic inclination and magnetic intensity first described by Jackson et al. (2000). New paleomagnetic data in 14C dated volcanic units indicate that the available geomagnetic models do not fit the Chilean secular variation in the time interval 1450-1650 AD (Fig. 9). The available models (Cals3k.4 and others) are likely robust enough in the northern hemisphere where a large number of observations are available but they are not yet accurate for paleomagnetic dating purpose in the southern hemisphere prior to ~1700 AD. In contrast, for the last three centuries, the almost linear 20° decrease in inclination and 25µT decrease in intensity in southern South America makes paleomagnetism the best tool for dating in a time interval for which uncertainties in calibrated 14C ages are often too large. We also show that paleointensity data are really usefull to ascertain and refine ages derived from paleomagnetic directions only. Acknowledgements. We thank Francisco Hervé for pointing out the work of our colleague Victor Ramos about the Casuchas del Virrey. Hysteresis and FORC data were acquired in the paleomagnetic laboratory of LSCE at Gif/Yvette. We thank Rodolfo Ferrando, Javiera Morande, Fernando Poblete, Matias Peña and Loreto Cordova for their help in the field. Philippe Cullerier made numerous measurements in the laboratory. We thank Philippe Lanos and Philippe Dufresne for the software used in archeomagnetic dating. Funding for this work was supported by CNRS-INSU.
References
Bouvet de Maisonneuve, C., M.A. Dungan, O. Bachmann, A. Burgisser, 2012. Insights into shallow magma storage and crystallization at Volcán Llaima (Andean Southern Volcanic Zone, Chile), Journal of Volcanology and Geothermal Research, 211-212, 76–91.
Chauvin, A., Roperch, P., Levi, S., 2005. Reliability of geomagnetic palaeointensity data : the effects of the NRM fraction and concave-up behaviour on palaeointensity determinations by the Thellier method, Phys. Earth Planet. Inter., 150, 265-286 Chauvin, A., Garcia, Y., Lanos, P., Laubenheimer, F., 2000. Paleointensity of the
geomagnetic field recovered on archaeomagnetic sites from France. Phys. Earth Planet. Inter. 120, 111–136. http://dx.doi.org/10.1016/S00319201(00)00148-5. Clavero, J. and H. Moreno, 2004. Evolution of Villarrica volcano, in Villarrica volcano (39.5°S), Southern Andes, Chile, ed. L.E. Lara and J. Clavero, Sernageomin, Boletin, 61, 17-27.
Coe, R.S., Grommé, S., Mankinen, A., 1978. Geomagnetic paleointensities from radiocarbon-dated lava flows on Hawai and the question of the Pacific nondipole low. J. Geophys. Res. 83, 1740–1756.
Darwin, C.R., 1840. On the connexion of certain volcanic phenomena in South America; and on the formation of mountain chains and volcanos, as the effect of the same power by which continents are elevated. Transactions Geological Society of London 5, 601–631. Dunlop, D., 2011. Physical basis of the Thellier–Thellier and related paleointensity methods,
Phys. Earth Planet. Int., 187, 118-138
Dunlop, D.J, 2002. Theory and application of the Day plot (Mrs/Ms versus Hcr/Hc) 1. Theoretical curves and tests using titanomagnetite data, J. Geophys. Res., 107, B3, 2056, 10.1029/2001JB000486
Finlay, C.C., 2008. Historical variation of the geomagnetic axial dipole. Phys. Earth Planet. Int. 170, 1–14. doi:10.1016/j.pepi.2008.06.029.
Gubbins, D., Jones, A.L., Finlay, C.C., 2006. Fall in Earth’s magnetic field is erratic. Science 312, 900–902. Harrison, R.J., Feinberg, J.M., 2008. FORCinel: an improved algorithm for calculating first-order reversal curve distributions using locally weighted regression smoothing. Geochem. Geophys. Geosyst. 9, Q05016. http://dx.doi.org/10.1029/ 2008GC001987. Hartmann, G.A., Genevey, A., Gallet, Y., Trindade, R.I.F., Etchevarne, C., Le Goff, M., Afonso, M.C., 2010. Archeointensity in Northeast Brazil over the past five centuries, Earth Planet. Sci. Lett., 296, 340-352 Hartmann, G.A., Genevey, A., Gallet, Y., Trindade, R.I.F., Le Goff, M., Najjar, R., Etchevarne, C., Afonso, M.C., 2011. New historical archeointensity data from Brazil: Evidence for a large regional non-dipole field contribution over the past few centuries, Earth Planet. Sci. Lett., 306, 66-76.
Jackson, A., Jonkers, A.R.T., Walker, M.R., 2000. Four centuries of geomagnetic secular variation from historical records. Phil. Trans. Roy. Soc. A 358, 957–999.
Korte, M. & Constable, C.G., 2011. Improving geomagnetic field reconstructions for 0-3ka, Phys. Earth planet. Inter., doi: 10.1016/j.pepi.2011.06.017, 188(3-4), 247-259
Korte, M., Donadini, F., Constable, C.G., 2009a. Geomagnetic field for 0-3 ka :2. A new series of time-varying global models, Geochem. Geophys. Geosyst., 10(6), Q06008, doi:10.1029/2008GC002297.
Lara, L.E., 2004. Overview of Villarrica volcano, in Villarrica volcano (39.5°S), Southern Andes, Chile, ed. L.E. Lara and J. Clavero, Sernageomin, Boletin, 61, 5-12.
Lara, L.E., G. Orozco, M. Piña-Gauthier, 2012. The 1835 AD fissure eruption at Osorno volcano, Southern Andes: Tectonic control by the intraarc stress field instead of remote megathrust-related dynamic strain. Tectonophysics, 530–531, 102-110. Leonhardt, R., J. Matzka, A. R. L. Nichols, Dingwell, D.B., 2006. Cooling rate correction of
paleointensity for volcanic glasses by relaxation geospeedometry, Earth Planet. Sci. Lett., 243, 282–292, doi:10.1016/j. epsl.2005.12.038.
Licht, A., Hulot, G., Gallet , Y., Thebault, E., 2013. Ensembles of low degree archeomagnetic field models for the past three millennia. Phys. Earth Planet. Int. , 224 38–67. McIntosh, G., Kovacheva, M., Catanzariti, G., Donadini, F., Lopez, M.L.O., 2011. High coercivity remanence in baked clay materials used in archeomagnetism. Geochem. Geophys. Geosystems 12, Q02003. doi:10.1029/2010GC003310
Moreno, H., Clavero,J., 2006. Geología del volcan Villarrica, Regiones de la Araucania y de los Lagos, Carta Geológica de Chile, Sernageomin, N°98.
Naranjo, J., Moreno,H., 2005. Geología del volcan Llaima, Región de la Araucanía, Carta Geológica de Chile, Sernageomin, N°88.
Nilsson, A., Holme, R., Korte, M., Suttie, N., Hill, M. (2014), Reconstructing Holocene geomagnetic field variation: new methods, models and implications, Geophysical Journal International, 198(1), 229–248, doi:10.1093/gji/ggu120.
Pavón-Carrasco, F.J., Osete, M.L., Torta, J.M., De Santis, A. (2014), A geomagnetic field model for the Holocene based on archaeomagnetic and lava flow data, Earth And Planetary Science Letters, 388, 98–109, doi:10.1016/j.epsl.2013.11.046.
Petit-Breuilh, M.E., 2004. La historia eruptiva de los volcanes hispanoamericanos (siglos XVI al XX). Servicio de Publicaciones del Exmo. Cabildo Insular de Lanzarote-Casa de los Volcanes, Spain. 431 pp.
Prévot, M., Mankinen, E.A., Coe, R.S., Gromme, C.S., 1985. The Steens Mountain (Oregon) geomagnetic polarity transition, 2. Field intensity variations and discussion of reversal models, J. Geophys. Res., 90, B12, 10417-10448.
Reubi, O., Bourdon, B., Dungan, M.A., Koornneef, J.M., Sellés, D., Langmuir, C.H., Aciego, S., 2011. Assimilation of the plutonic roots of the Andean arc controls variations in U-series disequilibria at Volcan Llaima, Chile, Earth and Planetary Science Letters, 303, 1–2, 37-47.
Roperch, P., Chauvin A., Le Pennec, J-L, Lara, L. 2014. Paleomagnetic study of juvenile basaltic–andesite clasts from Andean pyroclastic density current deposits, Phys. Earth Planet. Int., 227, 20-29.
Shaar, R., Feinberg, J.M., 2013. Rock magnetic properties of dendrites: insights from MFM imaging and implications for paleomagnetic studies, Geochem. Geophys. Geosyst., 14, 407–421, doi:10.1002/ggge.20053 Silva Parejas, C., Druitt, T.H., Robin, C., Moreno, H., Naranjo, J.-A., 2010. The Holocene Pucón eruption of Volcán Villarrica, Chile: deposit architecture and eruption chronology. Bull. Volcanol. 72, 677–692. http://dx.doi.org/10.1007/s00445-010- 0348-9.
Thellier, E., Thellier, O., 1959. Sur l’intensité du champ magnétique terrestre dans le passé historique et géologique, Ann. Geophys., 15, 285–376.
Thiele, R., Moreno, H., Elgueta, S., Lahsen, A., Rebolledo, S., Petit-Breuilh, M.E., 1998. Evolución geológico-geomorfológica cuaternaria del tramo superior del valle del río Laja, Rev. Geol. Chile v.25 n.2 doi: 10.4067/S0716-02081998000200007
Yu, Y. 2011. Importance of cooling rate dependence of thermoremanence in paleointensity determination, J. Geophys. Res., 116, B09101, doi:10.1029/2011JB008388.
Table 1. Paleomagnetic directions
---
Site location VGP
Site N Dec Inc Dec* Inc* α95 k Lat Lon lat Lon
--- Dated units Osorno December 1835 10CL28 8 22.0 -51.8 21.5 -49.8 3.3 289 -41.14903 -72.51718 70.4 358.1 10CL32 9 16.9 -47.9 16.5 -45.7 1.5 1197 -41.16078 -72.51148 71.6 341.1 11CL78 12 18.1 -49.8 17.7 -47.7 2.4 330 -41.12587 -72.61464 72.0 347.4 11CL83 8 20.7 -50.4 20.2 -48.3 2.8 391 -41.20317 -72.48986 70.6 352.9 Osorno January 1835 11CL82 11 17.1 -52.8 16.7 -50.8 4.5 105 -41.17480 -72.55769 74.3 353.0 11CL81 18 19.5 -51.9 19.0 -49.9 1.1 1021 -41.16697 -72.57264 72.2 354.6 Osorno 1835 10CL29 8 16.8 -51.1 16.4 -49.1 1.7 1101 -41.13539 -72.53922 73.6 348.2 10CL30 9 18.0 -47.4 17.5 -45.3 3.9 176 -41.13281 -72.53606 70.7 342.5 10CL31 7 15.7 -47.2 15.3 -45.0 2.8 482 -41.13702 -72.53802 71.9 337.6 11CL87 10 16.5 -56.1 16.1 -54.2 2.5 386 -41.17846 -72.55372 76.4 3.1 all 10 18.1 -50.7 1.8 714 all (-87) 9 18.3 -50.0 18.0 -48.1 1.6 1077 72.0 348.8 Llaima 1751AD 10CL14 8 9.7 -54.4 9.8 -55.0 6.7 69 -38.84149 -71.65522 81.3 354.8 10CL15 13 16.3 -49.1 16.5 -49.8 3.2 166 -38.82779 -71.65076 73.9 349.8 10CL16 12 3.1 -55.4 3.2 -55.9 1.8 608 -38.83526 -71.65525 86.1 329.4 10CL17 7 12.8 -56.6 12.9 -57.2 2.9 435 -38.83234 -71.65502 79.8 13.0 10CL18 10 6.2 -56.9 6.2 -57.5 3.0 267 -38.84186 -71.65535 85.0 5.2 10CL19 11 12.0 -54.7 12.1 -55.4 1.8 656 -38.75937 -71.62951 79.8 1.7 10CL24 13 8.4 -54.6 8.5 -55.3 2.1 392 -38.75519 -71.62458 82.4 353.0 11CL58 15 11.1 -55.0 11.2 -55.6 1.5 611 -38.77203 -71.62953 80.6 1.4 mean 8 10.1 -54.7 10.2 -55.3 2.3 569 81.2 357.6
Lonquimay volcano age (range 1500 – 1700 AD)
CL90 12 358.1 -64.3 358 -65.1 4.9 80 -38.36335 -71.53029 82.2 118.0
Cayutué
12CL96 7 3.0 -54.4 2.9 -52.4 3.6 283 -41.30272 -72.26950 83.2 309.3
Villarrica Zanjon seco lavas
10CL44 9 353.3 -63.2 3.5 217 -39.35439 -71.97070 82.7 148.4 10CL47 16 348.0 -63.9 1.5 624 -39.37148 -71.95588 79.2 158.9 11CL71 12 356.7 -59.3 1.9 508 -39.37543 -71.94408 87.4 181.0 11CL70 15 356.6 -63.1 2.4 259 -39.37543 -71.94408 84.2 132.9 11CL75 12 353.6 -54.2 3.1 201 -39.37687 -71.95057 83.1 238.1 11CL76 10 343.7 -63.1 3.7 171 -39.37970 -71.94987 76.8 169.5 10CL46 5 346.9 -58.6 3.4 513 -39.35610 -71.96397 79.9 194.0 11CL72 17 346.7 -61.6 2.8 167 -39.35705 -71.96223 79.4 175.2 95VR20 15 347.4 -60.4 3.1 149 -39.39133 -71.95017 80.2 182.1 95VR21 12 343.6 -63.6 2.4 331 -39.34109 -71.97106 76.5 166.7 mean 10 349.8 -61.2 349.8 -61.2 2.3 436
Table 1. Paleomagnetic directions
---
Site location VGP
Site N Dec Inc Dec* Inc* a95 k Lat Lon lat Lon
--- Volcanic units with an uncertain age
Antuco first stage
10CL03 10 12.2 -43.3 12.6 -45.9 2.0 579 -37.39634 -71.43433 74.0 332.6
10CL04 11 14.4 -47.0 14.7 -49.5 1.8 677 -37.39796 -71.42669 74.9 345.5
10CL05 8 12.1 -50.3 12.4 -52.6 1.2 2205 -37.38838 -71.39425 78.2 349.9
10CL13 10 13.7 -43.6 14.2 -46.2 1.7 797 -37.38650 -71.38445 73.3 337.0
mean 4 13.1 -46.1 3.8 573
Antuco second stage
10CL12 7 16.1 -39.4 16.5 -42.2 2.0 882 -37.38352 -71.37692 69.5 335.8 11CL53 20 13.6 -34.7 14.0 -37.8 1.6 429 -37.37805 -71.36315 68.2 325.4 11CL54 13 17.8 -33.5 18.2 -36.7 3.4 148 -37.37833 -71.37169 65.4 332.8 10CL02 9 11.2 -30.5 11.6 -33.8 1.5 1202 -37.37810 -71.37384 66.8 316.9 mean 4 14.6 -34.6 5.0 337 Villarica 1787 AD flow 11CL73 12 13.2 -45.3 2.4 330 -39.35933 -71.96648 73.4 333.2 11CL74 18 19.5 -46.2 3.5 101 -39.37115 -71.95949 70.0 347.7 10CL43 10 15.0 -47.0 3.8 166 -39.35370 -71.96825 73.3 340.5 10CL45 11 19.7 -43.1 1.9 552 -39.35288 -71.96942 68.2 343.1 mean 4 16.9 -45.4 3.2 811 Llaima 1780AD 10CL22 7 9.4 -41.4 9.5 -42.4 4.2 204 -38.77308 -71.69654 73.1 319.0 Llaima Sequence A 11CL66 6 2.7 -57.0 2.7 -57.7 2.6 667 -38.75272 -71.65466 87.6 351.4 11CL65 8 0.9 -61.5 0.8 -62.0 3.1 323 -38.75272 -71.65466 86.1 98.9 11CL64 7 349.2 -54.6 349.1 -55.2 2.9 422 -38.75272 -71.65466 80.6 217.8 11CL63 9 355.1 -63.2 355.0 -63.7 2.1 600 -38.75272 -71.65466 83.0 138.5 Llaima Sequence B 12C105 9 13.9 -51.1 14.0 -51.8 4.0 163 -38.70529 -71.65280 76.7 350.9 12C106 8 7.1 -59.3 7.2 -60.0 2.6 441 -38.70529 -71.65280 84.3 35.0 12C107 8 6.8 -54.3 6.9 -55.0 3.0 333 -38.70505 -71.65466 83.3 345.2 12C108 9 350.3 -62.3 350.1 -62.8 3.4 237 -38.70505 -71.65466 81.2 161.4 12C109 10 347.8 -65.9 347.5 -66.3 1.7 780 -38.70505 -71.65466 77.1 147.6 ---
N, number of samples used in the calculation of the mean direction ; Dec, Inc : declination and inclination, Dec*, Inc* : declination and inclination after relocation to Villarrica (39.4°S, 72°W) using the geocentric dipole model; Lat and Lon are the coordinates of the site locations, VGP lat and lon are the virtual geomagnetic pole calculated with the direction at the site location.
Table 2. Mean paleointensity results
Mean unit Mean
arithmetic Mean weighted σ n err95% Q factor Bricks 1770±5 AD 48.0 48.0 2.5 14 1.3 52.4 Aniso. cor. 48.2 48.0 2.3 14 1.2 53.2 Osorno 1835 AD 45.1 45.2 3.0 11 1.8 20.1 1751 AD site14 54.0 53.4 4.6 8 3.2 25.6 1751 AD site15 48.9 48.9 6.5 7 4.8 10.7 1751 AD others 52.5 53.2 6.6 8 4.5 14.3 All Llaima 1751 51.9 52.4 6.1 23 2.5 16.1 ZanjonSeco 49.8 50.3 6.1 19 2.7 22.8 Cayutue 53.0 52.6 4.3 4 4.2 14.0 Lonquimay 56.4 57.0 4.3 6 3.4 73.9
Sites with an uncertain age
Antuco A 49.5 48.1 5.4 13 3.0 22.5
Antuco B 40.8 40.9 6.5 16 3.2 21.2
Llaima site 22 39.1 38.9 4.7 8 3.2 38.1
Villarrica 1787 45.7 45.4 4.8 13 2.6 32.9
Llaima site 60 51.5 51.0 3.6 10 2.2 29.0
n : number of paleointensity determinations using the Thellier method used to calculate the arithmetic and weighted means (µT) (Coe 1967, 1978). σ is the standard deviation (in µT) and err is the standard error at 95%, Q factor is the geometric mean values of the quality factors corresponding to the Thellier determinations used in the mean calculation (supplementary Table 1 and Table 2).
Age, err : estimated age and error. Lat & long are the mean site location, Nsites : number of sites used in the calculation of the mean declination and inclination ;
latV and lonV are the latitude and longitude of virtual geomagnetic poles ; Dec*,Inc* are the declination and inclination relocated to Villarrica;
α95 is the semi angle of confidence around the mean direction; F and F* are the mean intensity at the site and after relocation to Villarica.
∂F is the error at 95% for the mean intensity.
Table 3. Mean paleomagnetic results in dated units
Site age err lat long Nsites Dec Inc latV lonV Dec* Inc* α95 N F F* ∂F ZanjonSeco 1440 30 -39.4 -72.0 10 -10.2 -61.2 81.8 174.2 -10.2 -61.2 2.3 19 50.3 50.3 2.7 Cayutue 1540 90 -41.3 -72.3 1 3.0 -54.4 83.2 309.3 2.9 -52.4 3.6 4 52.6 51.6 5.3 Lonquimay 1735 82 -38.4 -71.5 1 358.1 -65.1 2.2 118.0 358 -64.9 4.9 6 57.0 57.5 3.4 Llaima_1751 1751 -38.8 -71.6 8 10.1 -54.7 81.2 357.6 10.2 -55.3 2.3 23 52.4 52.8 2.5 Casuchas 1770 5 -33.0 -70.0 2 14 48.0 51.9 2.3 Osorno 1835 -41.1 -72.1 9 18.3 -50.0 72.0 348.8 18.0 -48.1 1.6 11 45.2 44.3 1.8
Supplementary Figures. Supplementary Fig. 1. Eruptive history of the Villarrica and Llaima volcanoes with a VEI greater than 1 (Data from the Smithsonian global volcanism program (http://www.volcano.si.edu/) and Petit-Breuihl (2004). 1600 1650 1700 1750 1800 1850 1900 1950 2000 1600 1650 1700 1750 1800 1850 1900 1950 2000