HAL Id: hal-00329208
https://hal.archives-ouvertes.fr/hal-00329208
Submitted on 1 Jan 2002
HAL is a multi-disciplinary open access
archive for the deposit and dissemination of
sci-entific research documents, whether they are
pub-lished or not. The documents may come from
teaching and research institutions in France or
abroad, or from public or private research centers.
L’archive ouverte pluridisciplinaire HAL, est
destinée au dépôt et à la diffusion de documents
scientifiques de niveau recherche, publiés ou non,
émanant des établissements d’enseignement et de
recherche français ou étrangers, des laboratoires
publics ou privés.
magnetotail lobes and plasma sheet boundary layer:
Interball-1 observations
E. E. Grigorenko, A. Fedorov, L. M. Zelenyi
To cite this version:
E. E. Grigorenko, A. Fedorov, L. M. Zelenyi. Statistical study of transient plasma structures in
magnetotail lobes and plasma sheet boundary layer: Interball-1 observations. Annales Geophysicae,
European Geosciences Union, 2002, 20 (3), pp.329-340. �hal-00329208�
Annales
Geophysicae
Statistical study of transient plasma structures in magnetotail lobes
and plasma sheet boundary layer: Interball-1 observations
E. E. Grigorenko1,2, A. Fedorov3, *, and L. M. Zelenyi2
1Skobeltzyn Institute of Nuclear Physics of Moscow State University, Vorobjevy Gory, 117234, Moscow, Russia 2Space Research Institute, 84/32, Profsojuznaja, 117810, Moscow, Russia
3CESR - CNRS, 9, av. de Colonel-Roche, 31400, Toulouse, France *on leave from Space Research Institute, Moscow
Received: 31 January 2001 – Revised: 24 September 2001 – Accepted: 21 September 2001
Abstract. The present paper is devoted to the statistical study of plasma structures observed at the interface between mag-netospheric lobes and the plasma sheet at distances of 15– 25 RE. The majority of the registered structures are bursty
earthward ion streams with energies about 10–30 keV known as “beamlets”. The paper describes the results of beam-let statistical analysis for different interplanetary magnetic fields (IMF), clock-angles and various magnetospheric con-ditions. It is shown that the energy of beamlets increases monotonously with a distance from the neutral sheet (NS) during slightly southward IMF and quiet magnetospheric conditions. Under these conditions, beamlets are observed up to 5–6 RE over the NS. In contrast, the beamlet energy
decreases with increasing distance from the NS if the IMF is northward, and the region of beamlet observation becomes much wider up to 12 RE above the NS. The same (inverse)
beamlet energy dependence on the distance from the NS is also registered during active magnetospheric periods.
Yet, the plasma structures of various duration with quasi-isotropic ion velocity distributions resembling the plasma of the plasma sheet (PS) were observed in the same region. Statistical study performed for various IMF clock-angles demonstrates the clear difference in the spatial distributions of such plasma structures for two extreme IMF directions. When IMF is primarily northward, PS-like plasma fills the lobe region almost entirely and could be associated with the PS expansions. For primarily southward IMF time intervals, the probability of observing PS-like structures of long dura-tion sharply decreases with the increasing distance from the NS, but PS-like structures of short durations (< 500 s) are distributed almost uniformly up to 12 REabove the NS. This
feature cannot be described in terms of the PS flapping mo-tions and requires another explanation. Relevance and limi-tations of the existing models attempting to explain the gen-eration mechanisms of these transient structures are briefly discussed in the concluding part of the paper.
Correspondence to: E. E. Grigorenko ([email protected])
Key words. Magnetospheric physics (magnetotail; magne-totail boundary layers; plasma sheet)
1 Introduction
Numerous measurements carried out in 1980’s demonstrated the existence of the interface between the hot quasi-isotropic Central Plasma Sheet (CPS) and the magnetotail lobe region (Eastman et al., 1984, 1985; Parks et al., 1984; Takahashi and Hones, 1988). This temporal variable transition region was called the Plasma Sheet Boundary Layer (PSBL). The key role of the PSBL in the magnetotail dynamic, an important region of mass, energy and momentum transport, was real-ized since these early observations. First, it was assumed that the existence of the PSBL can be related to the substorm pro-cesses (Winningham et al., 1975) and only later it was proved that the PSBL is a permanent feature of the magnetotail pre-sented even during the extended quiet periods (Eastman et al., 1984).
The PSBL has no well-defined boundaries (Grigorenko et al., 2000) and consists of complex plasma structures includ-ing fast earthward (> 400 km/s) flows (Lui et al., 1983; East-man et al., 1984; Baumjohann et al., 1988). Bidirectional beams are observed with higher densities further inside the PSBL (Parks et al., 1998) and then they evolve into the hot isotropic CPS component.
High velocity ion beams are observed in a rather wide re-gion including magnetotail lobes (Baumjohann et al., 1988; Orsini et al., 1987). Their distribution function was first re-ported in the experiment by De Coster and Frank (1979) and theoretically explained by Onsager et al. (1990); B¨uchner and Zelenyi (1990); Zelenyi et al. (1996). According to the theory, such high velocity localized ion beams (beamlets) are the result of nonadiabatic plasma acceleration in the spatially limited regions of the distant magnetotail. A first attempt to make a kinetic modelling of the complicated mantle plasma acceleration in the magnetotail (Ashour-Abdalla et al., 1993) also revealed that the PSBL could be filled by spatially
lo-Magnetopause Plasma Sheet −30 −20 −10 0 10 X GSM, Re 20 15 −5 0 5 10 Z GSM, Re
Fig. 1. An example of the Interball-1 (Tail Probe) orbit passing near the midnight meridional plane in winter season.
calized earthward and tailward streaming ion beams. Other theoretical models (Chen et al., 1990; Onsager et al., 1991; Moses et al., 1993) also gave their explanations for the com-plicated structure of accelerated ion beams in the phase space (see Sect. 6).
Independently, the observations of plasma structures, re-sembling the “scraps” of the plasma sheet (PS) material (i.e. plasma structures detached from the main body of the PS) and having no pronounced bulk velocities were reported for the PSBL and the adjacent lobe regions (Himenez et al., 1984; Belova et al., 1987). Observation of such “scraps” could be related to the PS flapping motions. But such plasma structures can also be formed as a result of magnetospheric convection changes (Ogino et al., 1994) or due to the de-velopment of a large-scale instability at the edge of the PS (Belova et al., 1987; Milovanov et al., 2000).
The Interball-1 spacecraft performed observations in the lobes – PS interface during 1995–2000 time interval. The data discussed in the present paper were obtained in the 1995–1998 years. The aim of this study is to answer the following questions:
1. What types of plasma structures are observed in the PSBL and magnetotail lobes?
2. What is the spatial distribution of the various types of plasma structures under different interplanetary con-ditions and under different levels of magnetospheric activity?
3. How do the main characteristics of the plasma struc-tures (i.e. energy, duration and so on) depend on the location of the observational point and on the external conditions?
Then we will make an attempt to find the specific characteris-tics of the plasma properties of these structures which could clarify the physical mechanisms of their formation.
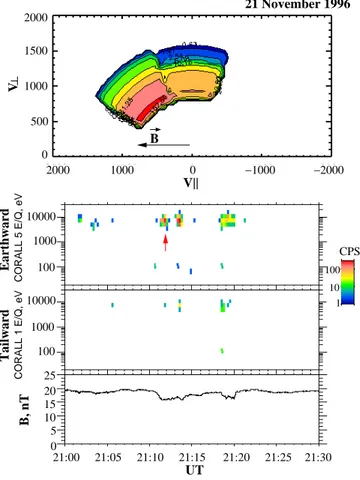
2000 1000 0 −1000 −2000 0 500 1000 1500 2000 V V|| 21 November 1996 B, nT B 1000 10000 100 10000 1000 100 CORALL 5 E/Q, eV Earthward CORALL 1 E/Q, eV Tailward 25 20 15 10 5 0 21:10 21:05 21:00 21:15 21:20 21:25 21:30 UT 100 10 1 CPS
Fig. 2. An example of an isolated beamlet. The lower 3 panels show from top to bottom: E-T spectrogram of earthward ions, E-T spectrogram of tailward ions, the magnitude of the magnetic field. The red arrow marks the beamlet event. The V⊥−V||distribution
function of the marked beamlet obtained for 3.8 s is shown in the top panel.
The organization of the paper is as follows: in Sect. 2, the Interball-1 orbit and the data used in our analysis are de-scribed. In Sect. 3, an overall description and examples of observed plasma structures are presented. In Sects. 4 and 5, we demonstrate the statistical characteristics of beamlets and PS-like plasma structures, respectively. Section 6 is devoted to the discussion of possible physical mechanisms of such “plasma regime” formations. The conclusion is presented in Sect. 7.
2 Instrumentation
The Interball-1 spacecraft was launched in 3 August 1995 to study mass, energy and momentum transport in the crit-ical regions of the solar wind/magnetospheric system. Ini-tial apogee and perigee of the orbit were 30 REand 800 km,
respectively, and the orbit inclination was 63◦. The satel-lite spins around the axis pointing to the Sun with a pe-riod of 118 s. An example of one real Interball-1 orbit is shown in Fig. 1. At each of the tail orbits the satel-lite crossed the magnetotail lobe-PSBL-PS interface region.
1000 100 10000 100 10000 1000 0 5 10 20 25 15 CORALL 5 E/Q, eV CORALL 1 E/Q, eV Earthward B, nT 1 10 100 23:20 23:25 23:30 23:35 23:40 23:45 23:50 15 November 1995 UT BEAMLETS Tailward CPS
Fig. 3. An example of “attached” beamlet. The figure layout is the same as Fig. 2 except for distribution.
The present study was undertaken for the midnight region of the tail. We analyzed 42 PSBL crossings that occurred inside |YGSM| < 7 RE interval. We used vector magnetic
field data and plasma measurements from the MIF mag-netometer (Klimov et al., 1997) and CORALL (Yermolaev et al., 1997) ion spectrometer, respectively. The ion spec-trometer CORALL allowed one to obtain 3-D distribution (without mass selection) for about 2 min (spacecraft spin pe-riod). The individual energy spectrum in the energy range 0.03–25 keV was collected for 3.6 s. The azimuthal reso-lution of the instrument was about 10◦, but polar resolu-tion (elevaresolu-tion from the solar-spacecraft line) was about 40◦. The IMF data monitored by the Wind spacecraft were ob-tained via CDA WEB (http://cdaweb.gsfc.nasa.gov). Wind data were shifted for solar wind propagation time between Wind and Interball-1. Geomagnetic activity indices Dst,
Kp, AE were obtained from the Geomagnetic Data Service
(http://swdcdb.kugi.kyoto-u.ac.jp/wdc/Sec3.html).
3 Observations of Plasma Structures.
High velocity ion beams (beamlets) moving earthward (more rarely tailward) are indentified in spectrograms as bursty plasma events along with the |B| depression. The typical event duration is not greater than 2 min. All events were reg-istered when (BX/|B| ∼ 1), i.e. in the northern lobe.
Fig-ure 2 shows the example of the isolated beamlet observed far from the PS region. Often, beamlets are observed in the re-gions adjacent to the PS, as it is shown in Fig. 3. This fact conforms the concept that the external part of the PS consists of the short intermittent ion beams (Ashour-Abdalla et al., 1993). All beamlets have a characteristic velocity distribu-tion funcdistribu-tion of a “lima-bean” shape (De Coster and Frank, 1979; Onsager et al., 1991; Zelenyi et al., 1996; Ashour-Abdalla et al., 1996) shown in two panels of Fig. 2.
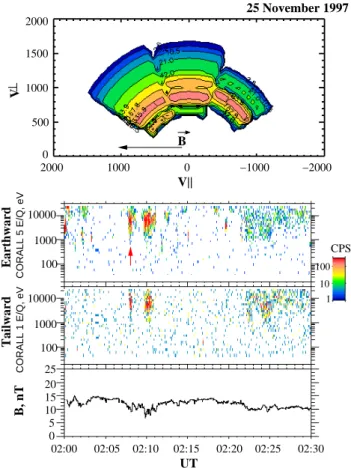
More-2000 1000 0 −1000 −2000 1500 2000 1000 500 0 V|| 25 November 1997 1000 10000 100 10000 1000 100 CORALL 5 E/Q, eV CORALL 1 E/Q, eV Earthward Tailward B, nT 0 5 15 25 20 10 100 10 1 02:00 02:05 02:10 02:15 02:20 02:25 02:30 UT V B CPS
Fig. 4. The same as Fig. 2 showing a bidirectional ion beam obser-vation.
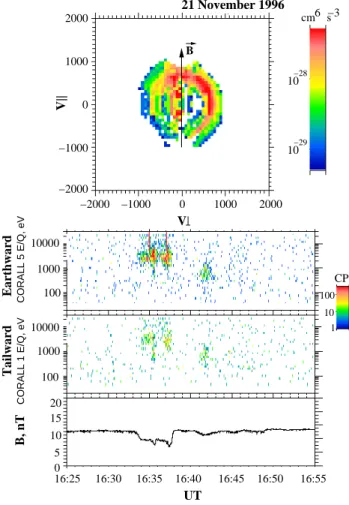
over, in some cases, a combination of earthward and tailward streaming (reflected) beamlets is observed. In these cases, the distribution function has a ring-like shape, as in Fig. 4. We have analysed 83 cases of beamlet observations for dif-ferent interplanetary and magnetospheric conditions. The re-sults of the study are discussed in Sect. 4. At the same time and almost at the same distances from the tail mid-plane, we observe quasi-isotropic plasma structures of various dura-tions, which are accompanied by the magnetic field depres-sion due to a diamagnetic effect. The typical experimental example of such a plasma structure is illustrated in Fig. 5. In contrast to beamlets, the ion velocity distribution function of such plasma events reveals nearly a quasi-isotropic but complex structure. The complexity of the distribution func-tion could be due to transient effects or due to low statistics. The main properties of such plasma structures, e.g. temper-ature (Ti >1000 eV), and an almost isotropic velocity
distri-bution makes them resemble the plasma of the PS. So we will call them “PS-like plasma structures”. Beamlets and PS-like plasma structures are clearly distinguished by their bulk ve-locity vectors. While the beamlet bulk veve-locity is primarily parallel to the magnetic field, plasma clouds may have rather high velocities across the magnetic field (in Y and/or Z direc-tion). The statistical analysis of such structures is presented in Sect. 5.
de-B 6 −3 100 10 1 10000 1000 100 10000 1000 100 CORALL 1 E/Q, eV Tailward Earthward cm s CORALL 5 E/Q, eV 0 5 15 20 B, nT 16:25 16:30 16:35 16:40 16:45 16:50 16:55 UT 2000 1000 0 −1000 −2000 V|| 21 November 1996 10−28 10−29 −2000 −1000 0 1000 2000 V 10 CPS
Fig. 5. An example of PS-like structure (plasma filament) observa-tion. Figure layout is the same as in Fig. 2.
tached from the main body of PS or their observations are related to the episodic excursions to the PS due to its flap-ping motions. In Sect. 6, we will make some speculations about the origin of such PS-like plasma structures.
4 Statistical analysis of beamlet observations
In this section we perform the statistical analysis of beamlet observations for different magnetospheric and interplanetary conditions. To characterise the magnetospheric conditions, we use the Kp and AE geomagnetic indices. The Kp
in-dex is a planetary K inin-dex, which, in turn, is obtained as the mean value of the disturbance levels in the two horizontal field components at a given station that measures the magni-tude of disturbances caused by the phenomena other than the diurnal variation and the long-term component of the storm-time variations, averaged for 3 h. The Kp index is obtained
from the K index by specific calculations and an averaging over 13 standard subauroral stations distributed over the en-tire Earth. Since ionospheric currents in the auroral zone con-siderably influence the magnetic field near the Earth, we also use the AE index for our analysis. The AE is the auroral-electrojet index which was defined to obtain a measure of the
0.6 1.0 0.8 0.4 0.2 0.0 0 1 2 3 4 5 6 7 8 9 10 11 0 2 4 6 8 10 12 5.0x10³ 104 x 1.0 1.5x10⁴ ∆Z, Re Beamlet Energy, eV
Beamlet Occurrence Frequency
SOUTHWARD IMF, QUIET CONDITIONS
∆Z, Re
Fig. 6. Left panel: beamlet occurrence frequency versus the nomi-nal distance from the neutral sheet (1Z) for quiet magnetospheric conditions under the southward IMF. Right panel: scatterplot of beamlets energy (i.e. energy associated with the field-aligned ve-locity of the beam) versus 1Z.
strength of the auroral electrojets relatively uncontaminated by the effects of ring current.
We have divided all PSBL crossings into 3 groups accord-ing to the correspondaccord-ing magnetospheric and interplanetary conditions. Namely:
1. southward interplanetary magnetic field (IMF), quiet conditions (Kp<1+, AE ≤ 50 nT);
2. southward IMF, disturbed conditions (Kp≥1+, AE >
50 nT);
3. northward IMF, quiet conditions (the same as in group 1).
Assuming the mechanism of the beamlet formation is the non-adiabatic acceleration in the distant magnetotail (Ashour-Abdalla et al., 1993, 1995; Moses et al., 1993; Harold et al., 1998), first of all, we have selected the cases of beamlet observations when the IMF was southward (the cross-tail electric field was definitely directed from down flank to the dusk, which provides the favourable acceleration conditions in the neutral sheet) and the magnetosphere was quiet enough (Kp<1+, AE ≤ 50 nT) to clarify the physics
of energization without the disturbing factors. We have found 15 cases which satisfied these criteria. All of these beam-lets were observed outside the current sheet (BX/|B| ∼1.0).
Figure 6 (left panel) shows the statistics of the beamlet oc-currence frequency versus the distance 1Z to the position of the NS. To avoid a satellite velocity effect, the “beam-let occurrence frequency” was calculated as the number of beamlet events encountered inside the 1 RE bin along 1Z
axis normalized to the time required to cross this bin. The probability of observing beamlets increases with the distance from the NS and drops down when 1Z reaches 6 RE. In the
right panel of Fig. 6, beamlet energies (i.e. energy associated with the field-aligned velocity of the beam) versus 1Z are presented. The energy of the beamlet increases with the dis-tance from the NS. Such an energy profile is predicted by
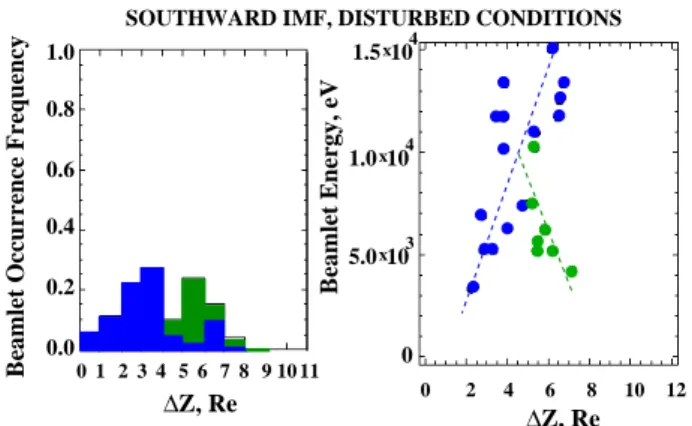
0 1 2 3 4 56 78 9 10 11 0 2 4 6 8 10 12 5.0x10³ 104 x 1.0 4 10 x 1.5 0 Beamlet Energy, eV 0.4 0.6 0.8 1.0 0.2 0.0
Beamlet Occurrence Frequency
∆Z, Re
∆Z, Re SOUTHWARD IMF, DISTURBED CONDITIONS
Fig. 7. Left panel: beamlet occurrence frequency versus 1Z for turbed magnetospheric conditions under southward IMF. Two dis-tributions displayed by blue and green correspond to two branches of energy profile shown in the right panel. Right panel: Scatterplot of beamlet energy versus 1Z. Two different beamlet populations are marked by blue and green.
theory (Onsager et al., 1991; Ashour-Abdalla et al., 1993) and we call it “normal beamlet velocity dispersion”.
During the active magnetospheric periods (Kp ≥ 1+,
AE > 50 nT, IMF is southward, 28 registered events), the spatial distribution of beamlet occurrence frequency distribu-tion is more spread out and has two maxima (see Fig. 7, left panel). Beamlet energy spatial distribution is now more com-plicated (Fig. 7, right panel). One can see here two beamlet populations marked by different colours with normal and in-verse velocity dispersions. Note that the maximum beamlet energy under the disturbed magnetospheric conditions is two times higher than the maximum energy during quiet periods. The main part of these beamlets was observed when Kpwas
moderate (< 3); neither altitude of beamlet observation nor beamlet energy are dependent on the value of Kp.
The last group of selected events (24 cases) was obtained when IMF was northward and the magnetosphere was quiet. Fourteen cases corresponding to northward IMF and dis-turbed magnetospheric conditions were excluded as interme-diate cases. Figure 8 (left panel) shows that beamlets were observed at higher distances above the NS. The right panel of this figure clearly displays the inverse beamlet energy dis-persion profile. In Sect. 6, we will discuss all beamlet distri-butions presented here.
5 Statistical distributions of PS-like plasma structures
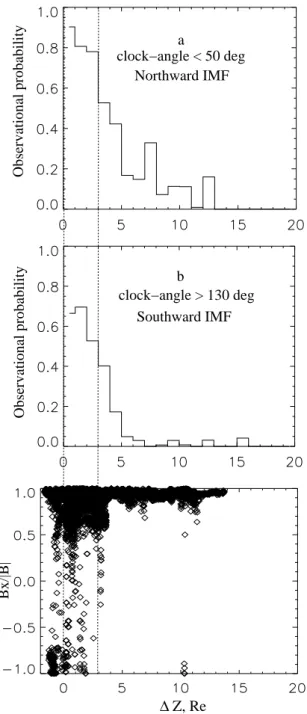
The spatial distribution of PS-like structures with a duration of more than 2 min is shown in Fig. 9. The observation prob-ability of such structures versus the distance from NS 1Z for two external IMF clock-angles is presented in panels (a) and (b), respectively. The bottom panel shows the scatter plot of BX/|B| versus 1Z, to indicate the transition from
the CPS to the lobe region. The observation probability was calculated as a ratio of total duration of PS-like plasma ob-servations when the satellite was in a particular 1Z bin of
0 1 2 3 456 7 8 9 10 11 0 2 4 6 8 10 12 0.8 1.0 0.6 0.4 0.0 0.2 0 10 x 5.0 3 1.0x10⁴ 104 1.5x
Beamlet Occurrence Frequency
∆Z,Re
Beamlet Energy, eV
∆Z,Re
NORTHWARD IMF, QUIET MAGNETOSPHERIC CONDITIONS
Fig. 8. The same as Fig. 6 obtained during quiet northward IMF time intervals.
1 RE width to the total time which the satellite spent inside
this 1Z bin. Contrary to beamlets, the probability profile of PS-like plasma structures has no clear maximum but de-creases gradually with 1Z. When the IMF is northward, the spatial distribution of PS-like plasma structures observed in the lobe region looks like the PS extension filling the lobes with decreasing probabilities. But when the IMF is south-ward, the distribution has a long, weak but almost constant tail observed in the 7–17 RE 1Zinterval.
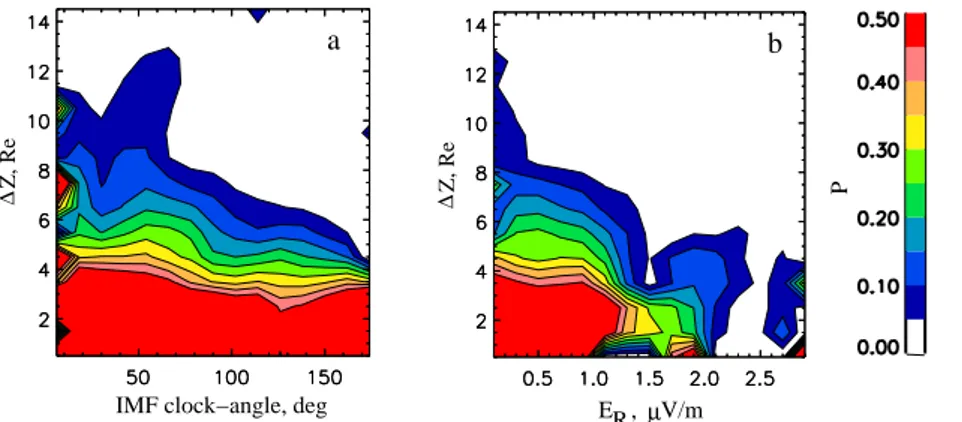
The general pattern of the distribution of probability to ob-serve PS-like structures in the 1Z – clock-angle plane is shown in Fig. 10a. Since the electric potential drop across the polar cap is a fundamental measure of the coupling be-tween the solar wind and the Earth’s magnetosphere, it would be useful to display the PS-like structures distribution versus some empirical value, which correlates with the polar cap potential drop. Such an empirical value is the “reconnection electric field”, ER= |Vsw×BIMF| ·sin4(22)(Eriksson et al.,
2000; Wygant et al., 1983). Here, 2 is the IMF clock-angle, and Vsw is the solar wind velocity. The 2D distribution of
the probability of observing plasma filaments versus 1Z and
ERis displayed in Fig. 10b.
The region occupied by PS-like plasma structures expands while the IMF clock-angle is decreasing. When the IMF is exactly northward (clock-angle = 0), PS-like structures fill almost the entire lobe region up to 1Z = 12. This fea-ture can be associated with 2-aurora (Frank et al., 1986). Figure 10b shows the same properties of the PS and PS-like structures even more clearly. Here, the dramatic expansion of the PS is seen at ER <100 µV/m. If ER>600 µV/m, then
the probability of observing PS is very low even at 1Z = 0. It looks like thinning of the PS or a fragmentation of the PS due to substorm activity. Note that the weak constant tail of PS-like structures seen in Fig. 9b is under the low colour limit in Fig. 10. We will discuss the nature of PS-like structures in the next section.
∆Z, Re a Observational probability b Bx/|B| Observational probability clock−angle < 50 deg Southward IMF clock−angle > 130 deg Northward IMF
Fig. 9. Probability to observe PS-like structures versus 1Z for northward IMF (a) and for southward IMF (b). The lower panel shows the scatterplot of BX/|B| to demarcate the PSt boundary
which is shown by dashed vertical line.
6 Discussion
Since an appearance of beamlets and other transient struc-tures reflects very deep properties of the nonlinear self-consistent plasma configuration of the Earth’s magnetotail, numerous theoretical efforts have been made to explain the plasma structuring in velocity and/or configurational space. The idea of explaining such plasma structures in the course of non-adiabatic particle acceleration in the distant
magne-totail (Lyons and Speiser, 1982) originates from the revisit-ing of Speiser model of particle motion at the end of 1980’s (Chen and Palmadesso, 1986; B¨uchner and Zelenyi, 1989). Later, the resonance nature of the non-adiabatic interaction has been revealed (Burkhart and Chen, 1991; B¨uchner, 1991; Ashour-Abdalla et al., 1993). Independence of the so-called parameter of adiabaticity κ = Bn B0 s L ρ0 , (1)
(where ρ is a particle’s Larmor radius, L is the current sheet thickness, B0is the value of the magnetic field in the lobe,
Bnis the normal component of the magnetic field at the site
of particle interaction with the current sheet), particle mo-tion in a prescribed field (used in all these models) could experience either strong scattering or follow the almost un-perturbed classical Speiser orbit. This dependence is very nonmonotonous and could, therefore, result in a phase space structuring. Independently from different grounds, Moses et al. (1993) also considered peculiarities of non-adiabatic particle motion in a vicinity of X-line (also in a prescribed field) and found a partitioning (even fractalization) of the phase space of accelerated population. Although Moses et al. (1993) did not explicitly invoke κ – resonance arguments, the physics under consideration was essentially the same. A 2-D test particle model by Ashour-Abdalla et al. (1993), as-suming the weak gradient in BZ(X)(i.e. κ(X) dependence)
and a uniform cross-tail electric field, predicts the formation of resonance regions at a number of locations in the distant magnetotail and produces a spatially fragmented pattern of the PS plasma.
On the other hand, Harold et al. (1998) recently found that beamlets disappear if instead of the uniform dawn-dusk elec-tric field, the elecelec-tric field taken from the MHD model is used for the trajectory calculations. However, the formation of spatial structure of any given beamlet is a local process and if the profile of Eyis nonuniform (and even strongly
nonuni-form), it might influence the energy of beamlets and their spatial distribution, but not the fact of their existence. An-other point of Harold et al. (1998) is that beamlets also dis-appear if in their (nonself-consistent) calculations, the thick-ness of the current sheet was taken close to ρi0– ion Larmor
radius in a lobe field B0. From our point of view, the ions
which form beamlets carry the main portion of the cross-tail current at the location of their acceleration and, therefore, their dynamics in the course of acceleration (strong or weak scattering) determines the overall self-consistent structure of the magnetotail configuration, as was recently shown by Sit-nov et al. (2000) and Zelenyi et al. (2000). So the processes of beamlet generation could adequately be described only by the self-consistent approach. The first analytical attempt to formulate the self-consistent theory of forced current sheets, taking into account the jumps of quasi-adiabatic invariant, was made only recently by Zelenyi et al. (2001).
Another approach, advocated in papers by Burkhart and Chen (1991), Chen et al. (1990), Holland et al. (1999)
as-µ Z, Re ∆ Z, Re ∆ R E , V/m a b
IMF clock−angle, deg
P
Fig. 10. (a) Color-coded distribution of probability P to observe PS-like struc-tures versus 1Z and IMF clock-angle. (b) The same versus 1Z and reconnec-tion electric field ER= |Vsw×BIMF| ·
sin4(22); here, Vsw is the solar wind
velocity, BI MF is the IMF, and 2 is the IMF clock-angle. The ERis marked in
microvolts per meter.
sumed that the resonances are produced locally at a given
X and due to κ(v) dependence. The authors also declared the finding of some experimental manifestations of such res-onances in the velocity space, i.e. isolated multiple velocity peaks (Chen et al., 1990; Holland et al., 1999). But this ap-proach completely neglects the velocity filter effect whose importance has been thoroughly investigated in a series of papers by Green and Horwitz (1986); Onsager et al. (1990, 1991). The point is that the phase space structures with dif-ferent velocities formed locally will be subjected to velocity dispersion in the course of their propagation from the forma-tion site to the observaforma-tion site. As a result, in a given region where our observations are made, we will never see the ve-locity peaks formed in the one certain location downstream in the magnetotail, but rather a combination of velocity struc-tures formed at different locations near the tail mid-plane (see below).
Although in papers by Onsager et al. (1990, 1991) the mechanism of beam formation has not been discussed, they clearly demonstrated the importance of the velocity filter mechanism in forming the PSBL plasma distributions even in a simple 1-D model with Bn(X) =const. Results of
Ashour-Abdalla et al. (1993) incorporated both the velocity filter ef-fect and another so-called “place of birth” efef-fect, taking into account that an additional cause of dispersion is related to the dependence of the energy 1W acquired in the course of non-adiabatic energization on the position of the acceleration site
1W (X) =2M cE
BZ(X)
!2
. (2)
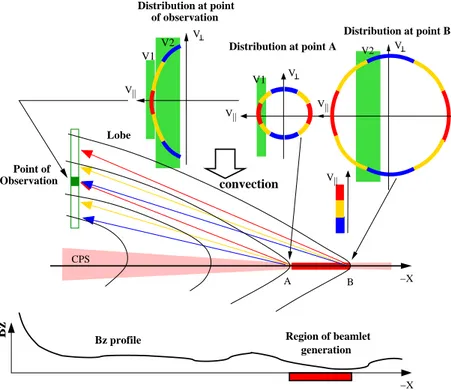
As it has already been reported, beamlets have a typical “lima-bean” shape of the velocity distribution function. The sketch of the formation of such a distribution is presented in Fig. 11. Due to the velocity filter effect produced by the global magnetotail convection in the Z direction, different parts of the distribution function measured at the given point should be generated at the different sites of the magnetotail (points A and B in Fig. 11).
If the convection is directed downward (as in Fig. 11), then ions with smaller field-aligned velocities should be generated
in the site far enough (in point B, for instance) to be regis-tered at the same point as the ions with higher parallel ve-locities (emitted from the point A). So the resulting beamlet distribution function measured at the given point of observa-tion is the sum of the pieces cut out from the beamlet distri-butions generated at the different distances from the Earth. Figure 11 presents the particular case when the BZ
com-ponent of the magnetic field decreases monotonously with the distance from the Earth. Hence, particles with a large pitch-angle and low V|| (generated farther in the tail from
the point of observation) will have larger energy, creating “lima-bean” distribution at the observation site. Note that any BZprofile in the region of beamlet generation causes
arc-shaped ion distribution with various V||/V⊥ratio. Although
our sketch in Fig. 11 resembles the one in Fig. 3 of Onsager et al. (1991), the physics involved in the explanation of the lima-bean shape is somewhat different. While Onsager et al. (1991) considered the formation of such distributions from the “bursty-like” local source (“all particles that travel from point A must do so in the same time”, according to their argu-mentation), we consider that the distributed quasi-permanent source and particles with different energies registered at the observer location are coming from the different sites in the magnetotail.
Our assumption about the importance of both velocity-filter and “place of birth” effects is supported by our anal-ysis of statistical spatial beamlet distributions. The results shown in Fig. 6 already suggest that (at least for southward IMF and relatively quiet conditions) due to the clear depen-dence of beamlet energy on 1Z, there should exist a well pronounced statistical decrease in BZ(x)with distance from
the Earth (see Eq. 2).
For further discussion we present our results as a 2D-histogram showing spatial beamlet energy distribution as a function of IMF clock-angle (Fig. 12). The clock-angle was 1.5 h averaged before the encounter with the beamlet. We divided the total interval of IMF clock-angles into 3 groups marked by the letters “C”, “D”, and “N” in Fig. 12. The cases lying inside each of these sub-intervals (“C”, “D”, or “N”) are exactly the same ones as included in our statistics shown in Figs. 6–8.
Distribution at point convection V1 V2 Bz profile generation Region of beamlet Distribution at point A Distribution at point B of observation V2 V1 || V|| V|| V V V || V V Lobe −X −X B A CPS Bz Point of Observation
Fig. 11. The sketch showing the forma-tion of the beamlet. The horizontal red bar shows the possible beamlet gener-ation region. Each point of this region generates a ring-like distribution. Due to the convection filter, only specific
V|| can reach the point of observation
(green rectangular). Different color arcs in the distributions show different V||.
Color arrows show the appropriate tra-jectories of varying V||. The observed
distribution function is the collection of particles accelerated at the point A with the V||in the “V1” band, and particles
accelerated in the point B with V||in the
“V 2” band.
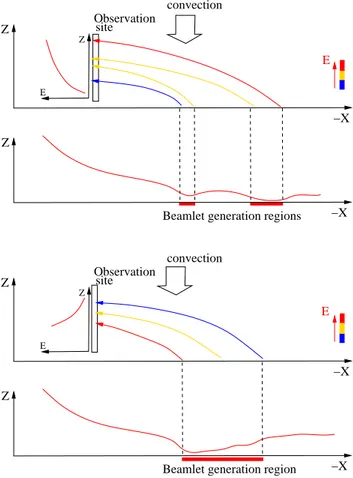
1. The “normal” beamlet energy dispersion is observed within clock-angle interval of 90◦ −110◦ that
corre-sponds to the moderate values of the dawn-dusk cross-tail electric field (i.e. low substorm probability). In this case, BZ should statistically decrease tailward
practi-cally monotonously, and beamlets with higher energies are generated farther from the Earth and observed at higher 1Z (see Fig. 13, top panel) that corresponds to their acceleration in the vicinity of the distant X-line; 2. When the clock-angle is in the range of 110◦−130◦,
beamlet energy increases, but at the same time, one can begin to observe beamlets at the lower 1Z. This can be associated with the BZ(x)decrease over a wide
magnetotail region (increase in the cross tail current). Thus, the beamlet generation site becomes wider and approaches the Earth;
3. When the IMF is primarily southward (that corresponds to clock-angles in the 130◦−180◦interval), beamlets
with the highest energies are registered at the lowest
1Z. The inverse energy dispersion is seen in the 4– 8 RE 1Z range. (Compare with the green points in
Fig. 7). Such distribution may be the result of substorm activity and may be explained by the new X-line for-mation closer to the Earth. In this case, the negative
dBZ/dZ profile can be formed behind the new X-line
(Zelenyi et al., 1990), and the inverse beamlet disper-sion can be generated according to the scenario shown in the lower panel of Fig. 13;
4. The inverse energy dispersion is observed also when the IMF is generally northward (clock-angle is 0◦−90◦(see
Figs. 8 and 12). In this case, beamlets are registered up to very high distances from the NS (up to 1Z ∼11 RE)
and have relatively small energies (≤8 keV).
The reverse convection (Ogino et al., 1994) directed from the NS toward the magnetopause is expected when IMF is exactly northward. This process leads to the inverse beamlet velocity dispersion. Also, although less probable, is that neg-ative dispersion can be related to the formation of a negneg-ative
dBZ/dXgradient under northward IMF.
We see that both the lima-bean shapes of the individual beamlet distribution functions and statistical spatial beamlet distributions could be explained in terms of the model tak-ing into account both velocity filter effects and peculiarities of non-adiabatic (Speiser) acceleration (Eq. 2). It is more difficult to explain the “bursty” appearance of beamlets. It may indicate that the resonance conditions for beamlet ac-celeration are fulfilled at the given site only for a short time. Alternative explanations invokes the flapping motions of the spatially structured magnetotail. Time scales estimated by Ashour-Abdalla et al. (1995) from the latter assumption are of the order of 1–2 min which conforms with our observa-tions. In reality, spatial structuring could be accompanied by the transient effects considered in the self-consistent gener-alization of the above mentioned model to the dynamic case (Peroomian et al., 2000). From our single-point observa-tions, it is very complicated to distinguish in each case the spatial or temporal origin of the bursty beamlet manifesta-tions. Hopefully, 4-point Cluster-II observations will clarify this very important issue.
The mechanism of the formation of the PS-like plasma structures is even more poorly understood. When the IMF
∆Z, Re
C
Clock Angle, deg
Energy, eV
N
D
Fig. 12. Color-coded beamlet energy histogram displayed in the IMF angle – 1Z plane. Two vertical lines divide the clock-angle range into three zones: D - disturbed conditions in the magne-tosphere, C - quiet conditions, and N - the northward IMF direction.
turns northward, the change in the direction of plasma con-vection (Ogino et al., 1994; Walker et al., 1999) can result in the PS expansion to the magnetotail lobes. The weak wings of the distribution seen in Figs. 9 and 10 could be explained by the flapping motions of the PS or by plasma structures (fillaments) detached from the main body of PS. To clarify the problem, it is necessary to study the temporal features of PS-like plasma structures.
In Fig. 14, the probability of observing a PS-like plasma structure is presented as a function of 1Z and the event du-ration. The distributions show that:
1. For the northward IMF, the observed spectrum of PS-like structure durations is distributed almost uniformly over various 1Z. This may be explained as a result of the PS motion as a whole entity;
2. For the southward IMF, only PS-like structures with the durations < 500 s are registered with the equal probabil-ity over the entire 1Z range. The events with the longer durations are observed only within 1Z <4 RE. Hence,
we can conclude that the appearance of the short PS-like plasma structures is caused by the physical mech-anism, different from the ones operated for northward IMF. Standard reconnection models, which provide the plasma jetting along the separatrix between open and closed field lines (i.e. along PSBL edge), could not ex-plain such observations.
One possible explanation may be the decays of the PS ex-tensions to the lobes (formed by the upward convection dur-ing intervals of northward IMF) onto plasma fragments when IMF turns southward and the direction of convection veloc-ity changes its sign. The other possible scenario responsi-ble for such short-time PS-plasma structure occurrences was proposed recently by Milovanov et al. (2000). The model extends the earlier one developed for the steady state of the distant magnetotail to the active periods prior to substorm
site Observation
Observation site
Beamlet generation region E Beamlet generation regions
E Z E Z Z convection convection −X −X Z E Z Z −X −X
Fig. 13. Two scenario of beamlet energy dispersion. Top panel shows the formation of “normal dispersion” due to both a generally positive dBZ/dXprofile and dawn-dusk electric field. The lower
panel shows the formation of “inverse dispersion” due to negative
dBZ/dX. Such a configuration can be the consequence of new
near-Earth X-line generation.
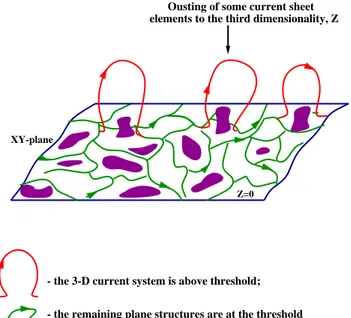
onset (i.e. when the IMF is predominantly southward). A highly branched network of the cross-tail currents, initially confined to the vicinity of magnetotail field reversal, might become structurally unstable in the course of the energy ac-cumulation in the magnetotail (which should be accompa-nied by the growth of the average cross-tail current). In this case, some elements of the current network become energet-ically favourable to bypass the region of the strong magnetic turbulence in the vicinity of the current sheet. At the nonlin-ear stage of this structural instability, current filaments could emerge from the mid-plane into the regions well outside the PS (see Fig. 15). The sporadic appearance of the current loops in the lobes should be manifested in the observations of the localized regions of PS-like plasma with bulk veloci-ties predominantly directed out of the mid-tail plane. As was argued in Sect. 5, this is just the case for the Interball-1 obser-vations of PS-like plasma structures, reported in this paper.
Probability ∆ Z, Re ∆ clock−angle < 50o clock−angle > 150 Z, Re Duration, sec o A B
Fig. 14. The duration of PS-like events versus 1Z. The color-coded histogram shows the probability of observing the event of a partic-ular duration at the particpartic-ular 1Z. Panel (a) shows distribution for southward IMF and panel (b) shows the same for northward IMF. Probability is normalized to maximum value.
7 Summary
We have studied two types of transient plasma structures ob-served by Interball-1 spacecraft in the interface between the magnetotail lobe region and PS: beamlets and quasi-isotropic PS-like plasma structures. Beamlets, non-adiabatically ac-celerated in the distant localized parts of the magnetotail, are ejected towards the Earth along the outer region of the closed magnetic field lines. Therefore, the occurrence of this struc-ture could serve as an exellent indicator of the boundary be-tween closed and opened magnetic field lines, i.e. the PSBL location. Moreover, as it was shown in the previous section, the dynamics of the beamlet spatial distribution reflects well the magnetospheric conditions and the changes in the recon-nection site location in the magnetotail for the various levels of magnetospheric activity.
The distribution of the very small BZ component of
the magnetic field in the distant magnetotail (where non-adiabatic beamlet acceleration occurs) strongly controls the ion energy gains. BZ(X)-profile, together with E × B ion
velocity filter effect, produces the beamlet energy dispersion in the Z-direction observed near the Earth. The form of this dispersion for given magnetospheric and interplanetary con-ditions allows us to make a suggestion about the character of the BZ(X)-profile. We have revealed that the normal energy
dispersion and corresponding BZ monotonously decreasing
tailward are observed primarily during the quiet periods and when convection in the lobes is directed towards the tail mid-plane. During the active periods, both normal and inverse beamlet energy dispersions are registered. This fact can be explained by the nonmonotonic profiles of BZ(X)in the
re-gion of non-adiabatic beamlet generation. Bursty appearance of beamlets still remains to be explored experimentally (mul-tipoint observations) and theoretically (self-consistent mod-els of non-adiabatic acceleration).
Another indicator of the changes occurring in the mag-netotail when IMF turns from the northward to southward direction may be the distribution of the short-time PS-like plasma structures over the tail lobes. During the intervals of the northward IMF, PS-like plasma fills the lobe region
- the remaining plane structures are at the threshold
XY-plane
Z=0
elements to the third dimensionality, Z Ousting of some current sheet
- the 3-D current system is above threshold;
Fig. 15. Scenario of PS filaments formation.
almost entirely and registration of various plasma structures is mainly related to the motions of the PS as the whole en-tity. But when the IMF turns southward, the observations of plasma structures with long-duration quickly decays with the growth of the distance from NS, while the short-time struc-tures are observed almost uniformly up to the relatively high altitudes over the NS. Registration of such type of structures could hardly be explained by the flapping motions of the PS. It is more probable that the appearance of such structures could be caused by another physical mechanism. It could be the decay of the PS extensions to the lobes (formed by the upward convection during the episodes of the northward IMF) onto plasma fragments (filaments) when the IMF turns southward and the direction of convection changes its sign. As a possible candidate, one could also consider the spatial reconfiguration of the cross-tail current system when average cross-tail current begins to grow before substorm onset. It results in the formation of current loops which are stretched out of the CPS into the lobe region and observed as localised PS-like plasma structures with bulk velocity directed mainly upward.
A further detailed investigation of temporal and spatial features of such plasma structures is required to answer more definitely what are the physical mechanisms responsible for their formation.
Acknowledgement. Authors are grateful to V. Peroomian and M.
Ashour-Abdalla for the stimulation discussions of the origin of the beamlets, to L. Avanov, O. Vaisberg and E. Budnik for important comments and help in preparation of the manuscript. This work was supported by the INTAS grants 99-0078 and grants of RFBR NN 00–15–96631 and 01–02–16367.
Topical Editor G. Chanteur thanks two referees for their help in evaluating this paper.
References
Ashour-Abdalla, M., Berchem, J. P., B¨uchner, J., and Zelenyi, L. M.: Shaping of the magnetotail from the mantle: global and local structuring, J. Geophys. Res., 98, 5651–5676, 1993.
Ashour-Abdalla, M., Zelenyi, L. M., Peroomian, V., Richard, R. L., and Bosqued, J. M.: The mosaic structure of plasma bulk flows in the Earth’s magnetotail, J. Geophys. Res., 100, 19 191–19 209, 1995.
Ashour-Abdalla, M., Frank, L. A., Paterson, W. R., Peroomian, V., and Zelenyi, L. M.: Proton velocity distributions in the magne-totail: theory and observations, J. Geophys. Res., 101, 2587– 2598, 1996.
Baumjohann, W., Paschmann, G., Sckopke, N., Cattel, C. A., and Carlson, C. W.: Average ion moments in the PSBL, J. Geophys. Res., 93, 11 507–11 520, 1988.
Baumjohann, W., Paschmann, G., and L¨uhr, H.: Characteristics of high-speed ion flows in the plasma sheet, J. Geophys. Res., 95, 3801–3809, 1990.
Belova, E. V., Vaisberg, O. L., Zelenyi, L. M., and Himenes, R. A.: Formation of plasma clouds in high-latitude magnetotail regions, Cosmic Research, 26, 4, 606–619, 1987.
B¨uchner, J. and Zelenyi L. M.: Deterministic chaos in the dynam-ics of charged particles near a magnetic field reversal, Physdynam-ics Letters A, 118, 395–399, 1986.
B¨uchner, J. and Zelenyi, L. M.: Regular and chaotic charged par-ticle motion in magnetotaillike field reversals 1. Basic theory of trapped motion, J. Geophys. Res., 94, 11 821–11 842, 1989. B¨uchner, J. and Zelenyi, L. M.: The separatrix tentacle effect on the
ion acceleration in the PSBL, J. Geophys. Res. Lett., 17, 127– 130, 1990.
B¨uchner, J.: Correlation-modulated chaotic scattering in the Earth’s magnetotail, Geophys. Res. Lett., 18, 1595–1598, 1991. Burkhart, G. R. and Chen, J.: Differential memory in the Earth’s
magnetotail, J. Geophys. Res., 96, 14 033–14 049, 1991. Chen, J. and Palmadesso, P. J.: Chaos and nonlinear dynamics of
single-particle orbits in a magnetotaillike magnetic field, J. Geo-phys. Res., 91, 1499–1508, 1986.
Chen, J., Burkhardt, G. R., and Huang, C. Y.: Observational sig-natures of NL magnetotail particle dynamics, J. Geophys. Res. Lett., 17, 2237–2240, 1990.
DeCoster, R. J. and Frank, L. A.: Observations pertaining to the dynamics of the plasma sheet, J. Geophys. Res., 84, 5099–5121, 1979.
Eastman, T. E., Frank, L. A., Peterson, W. K., and Lennartsson, W.: The plasma sheet boundary layer, J. Geophys. Res., 89, 1553– 1572, 1984.
Eastman, T. E., Frank, L. A., and Huang, C. Y.: The boundary layers as the primary transport regions of the Earth’s magnetotail, J. Geophys. Res., 90, 9541–9560, 1985.
Eriksson, S., Ergun, R. E., Carlson, C. W., and Peria, W.: The cross-polar potential drop and its correlation to the solar wind, J. Geo-phys. Res., 105, 18 639–18 654, 2000.
Frank, L. A., Craven, J. D., Gurnett, D. A., Shawhan, S. D., Weimer, D. R., Burch, J. L., Winningham, J. D., Chappell, C. R., Waite, J. H., Heelis, R. A., Maynard, N. C., Sugiura, M., Peterson, W. K., and Shelley, E. G.: The theta aurora, J. Geophys. Res., 91, 3177–3224, 1986.
Frank, L. A., Paterson, W. K., and Kivelson, M.: Observations of nonadiabatic acceleration of ions in Earth’s magnetotail, J. Geo-phys. Res., 99, 14 877–14 890, 1994.
Green, J. L. and Horwitz, J. L.: Destiny of earthward streaming
plasma in the plasma sheet boundary layer, Geophys. Res. Lett., 13, 76–79, 1986.
Grigorenko, E. E., Fedorov, A. O., Avanov, L. A., and Zelenyi, L. M.: Transient intermittent structures in the plasma sheet-lobes interface, Proceedings of ICS-5, 493–498, 2000.
Harold, J. B., Chen, J., and Joyce, G.: Resonance-generated particle distributions in magnetotail X line configurations, J. Geophys. Res., 103, 11 887–11 906, 1998.
Himenez, R. A., Romanov, S. A., Vaisberg, O. L., and Balebanov, V. M.: Plasma flux properties in the magnetotail according to the “Prognoz-8” data, Preprint-930, IKI AN USSR, 1984.
Holland, D. L., Paterson, W. R., Frank, L. A., Kokubun, S., and Yamamoto, Y.: Signatures of nonlinear charged particle dynam-ics in Geotail comprehensive plasma instrument observations, J. Geophys. Res., 104, 2479–2485, 1999.
Klimov, S., Romanov S., Amata E., Blecki J., and B¨uchner J., et al.: ASPI experiment: measurements of fields and waves onboard the Interball-1 spacecraft, Ann. Geophysicae, 15, 514–527, 1997. Lui, A. T. Y., Williams, D. J., Eastman, T. E., and Frank, L. A.:
Observation of ion streaming during substorm, J. Geophys. Res., 87, 7753–7764, 1983.
Lyons, L. R. and Speiser, T. W.: Evidence for current-sheet acceler-ation in the geomagnetic tail, J. Geophys. Res., 87, 2276–2286, 1982.
Milovanov, A., Zelenyi, L. M., and Zimbardo, G.: Topological model for the magnetospheric substorm onset: structural catas-trophe of the self-organized critical state, Proceedings of ICS-5, 183–188, 2000.
Moses, R. W., Finn, J. M., and Ling, K. M.: Plasma heating by collisionless magnetic reconnection: analysis and computation, J. Geophys. Res., 98, 4013–4040, 1993.
Ogino, T., Walker, R. J., and Ashour-Abdalla, M.: A global mag-netohydrodynamic simulation of the response of the magneto-sphere to a northward turning of the interplanetary magnetic field, J. Geophys. Res., 99, 11 027–11 042, 1994.
Onsager T. G., Thomsen, M. F., Gosling, J. T., and Bame, S. J.: Electron distributions in the plasma sheet boundary layer: time-of-flight effects, Geophys. Res. Lett., 17, 1837–1840, 1990. Onsager, T. G., Thomsen, M. F., Elphig, R. C., and Gosling, J.
T.: Models of electron and ion distributions in the plasma sheet boundary layer, J. Geophys. Res., 96, 2099–2101, 1991. Orsini, S., Candidi, M., and Balsiger, H.: Composition and velocity
of ions streaming in the plasma mantle and in the lobe, in: Mag-netotail Physics, (Ed) Lui, A. T. Y., 239, John Hopkins University Press, Baltimore, MD, 1987.
Parks, G. K., McCarthy, M., Fitzenreiter, R. J., and Etcheto, J., et al.: Particle and field characteristics of the high-latitude plasma sheet boundary layer, J. Geophys. Res., 89, 8885–8906, 1984. Parks, G. K., Chen, L. J., McCarthy, M., Larson, D., Lui, R. P.,
Phan, T., Reme, H., and Sanderson, T.: New observations of ion beams in the plasma sheet boundary layer, Geophys. Res. Lett., 25, 3285–3288, 1998.
Peroomian, V., Ashour-Abdalla, M., and Zelenyi, L. M.: Intrinsic Variability in the quiet-time magnetotail, in: Magnetospheric Current Systems, Geophysical Monograph 118, (Ed) the Ameri-can Geophysical Union, 305–312, 2000.
Sitnov, M. I., Zelenyi, L. M., Malova, H. V., and Sharma, A. S.: Thin current sheet embedded within a thicker plasma sheet: self-consistent kinetic theory, J. Geophys. Res., 105, 13 029–13 043, 2000.
Takahashi, K. and Hones, E. W.: ISEE 1 and 2 observations of ion distributions at the plasma sheet-tail lobe boundary, J. Geophys.
Res., 93, 8558–8582, 1988.
Walker R. J., Richard R. L., Ogino, T., and Ashour-Abdalla, M.: The response of the magnetotail to changes in the IMF orienta-tion: The magnetotail’s long memory, Physics and Chemistry of the Earth, 24, 221–227, 1999.
Winningham, J. D., Yasuhara, F., Akasofu, S.-I., and Heikkila, W. J.: The latitudinal morphology of 10-eV to 10-keV elec-tron fluxes during magnetically quiet and disturbed times in the 21:00–03:00 MLT sector, J. Geophys. Res., 80, 3148–3171, 1975.
Wygant, J. R., Torbert, R. B., and Mozer, F. S.: Comparison of S3-3 polar cap potential drops with the interplanetary magnetic field and models of magnetopause reconnection, J. Geophys. Res., 88, 5727–5735, 1983.
Yermolaev, Yu. I., Fedorov, A. O., Vaisberg, O. L., Balebanov, V. M., and Obod, Y. A., et al.: Ion distribution dynamics near the Earth’sbow shock: first measurements with the 2D ion energy
spectrometer CORALL on the Interball-Tail satellite, Ann. Geo-physicae, 15, 533–541, 1997.
Zelenyi L. M., Delcourt, D., Malova, H. V., and Sharma, A. S., et al.: Forced current sheets in the Earth’s magnetotail: its role and evolution due to nonadiabatic particle scattering, in: Proc. of COSPAR colloquia, Advances Space Res., in press, 2001. Zelenyi, L. M., Kovrazkhin, R. A., and Bosqued, J. M.:
Velocity-dispersed ion beams in the nightside auroral zone: AUREOL-3 observations, J. Geophys. Res., 95, 12 119–12 139, 1990. Zelenyi, L. M., Taktakishvili, A. L., Dubinin, E. M., Budnik, E. Yu.,
and Sandahl, I.: Ion beam velocity distributions in plasma sheet boundary layer, Proceedings of the 9th COSPAR Colloquium “Magnetospheric Research with Advanced Techniques”, Beijing, China, 125–132, 1996.
Zelenyi, L. M., Sitnov, M. I., Malova, H. V., and Sharma, A. S.: Thin and superthin ion current sheets. Quasi-adiabatic and nona-diabatic models, Non. Proc. Geophys., 7, 127–139, 2000.