HAL Id: insu-01119438
https://hal-insu.archives-ouvertes.fr/insu-01119438
Submitted on 23 Feb 2015
HAL is a multi-disciplinary open access
archive for the deposit and dissemination of
sci-entific research documents, whether they are
pub-lished or not. The documents may come from
teaching and research institutions in France or
abroad, or from public or private research centers.
L’archive ouverte pluridisciplinaire HAL, est
destinée au dépôt et à la diffusion de documents
scientifiques de niveau recherche, publiés ou non,
émanant des établissements d’enseignement et de
recherche français ou étrangers, des laboratoires
publics ou privés.
insights from a paleomagnetic and anisotropy of
magnetic susceptibility study
F Poblete, Pierrick Roperch, F Hervé, M Diraison, M Espinoza, C Arriagada
To cite this version:
F Poblete, Pierrick Roperch, F Hervé, M Diraison, M Espinoza, et al.. The curved Magallanes
fold and thrust belt: Tectonic insights from a paleomagnetic and anisotropy of magnetic
sus-ceptibility study.
Tectonics, American Geophysical Union (AGU), 2014, 33 (12), pp.2526-2551.
The curved Magallanes fold and thrust belt: Tectonic
insights from a paleomagnetic and anisotropy
of magnetic susceptibility study
F. Poblete1,2, P. Roperch2, F. Hervé1,3, M. Diraison4, M. Espinoza1, and C. Arriagada1 1
Departamento de Geología, Universidad de Chile, Santiago, Chile,2Géosciences Rennes, Université de Rennes 1, Rennes, France,3Carrera de Geología, Universidad Andrés Bello, Santiago, Chile,4Ecole et Observatoire des Sciences de la Terre,
EOST, Université de Strasbourg, Strasbourg, France
Abstract
The Magallanes fold and thrust belt (FTB) presents a large-scale curvature from N-S oriented structures north of 52°S to nearly E-W in Tierra del Fuego Island. We present a paleomagnetic and anisotropy of magnetic susceptibility (AMS) study from 85 sites sampled in Cretaceous to Miocene marine sediments. Magnetic susceptibility is lower than 0.0005 SI for 76 sites and mainly controlled by paramagnetic minerals. AMS results indicate that the sedimentary fabric is preserved in the undeformed areas of Tierra del Fuego and the more external thrust sheets units, where an incipient lineation due to layer parallel shortening is recorded. Prolate AMS ellipsoids, indicating a significant tectonic imprint in the AMS fabric, are observed in the internal units of the belt. AMS results show a good correlation between the orientation of the magnetic lineation and the fold axes. However, in Península Brunswick, the AMS lineations are at ~20° counterclockwise to the strike of the fold axes. Pretectonic stable characteristic remanent magnetizations (ChRM) were determined in seven sites. A counterclockwise rotation (21.2° ± 9.2°) is documented by ChRM data from four sites near the hinge of the belt in Península Brunswick and near Canal Whiteside while there is no evidence of rotation near the nearly E-W oriented Vicuña thrust within Tierra del Fuego. The curved shape of the Cenozoic Magallanes FTB is not related to vertical axis rotation, and thus, the Magallanes FTB can be considered as a primary arc.1. Introduction
The Andes Cordillera, a subduction-related orogen, spanning from the Caribbean Sea in the north to Tierra del Fuego in the south, is one of the longest mountain chains on Earth, with summits above 6.500 m above sea level [Ramos, 2009]. One of the most noteworthy features of the Andes is its southern bend, where the trend of the mountain chain and the main fold and thrust axes change from typical Andean N-S oriented structures north of 52°S to a west-east direction at 55°S (Figure 1a). This bend is known as the Patagonian Orocline after Carey [1958].
Marshak [1988, 2004] suggested that the curvatures of many fold and thrust belts are“basin-controlled” primary features and reflect the characteristics of the predeformational sedimentary basins. However, curvatures can also involve oroclinal bending of an original rectilinear orogen. Later, Weil and Sussman [2004] proposed a new classification of bent orogens based on the temporal relation between the structural trend lines and vertical axis rotation. The term orocline, proposed initially by Carey [1955], is redefined by Weil and Sussman [2004] as an originally linear orogenic system that has been bent in a second phase of deformation, implying rotation of the structures around a vertical axis. Primary arcs are defined as orogens in which the curvature is due to inherited structures (curved indenter and basin configuration, for example) and not related to vertical axis rotation. Finally, a progressive arc is defined as an orogenic belt with a curvature acquired during the building of the orogen. The Bolivian orocline in the Central Andes is one of the best examples of the bending of continental margin by differential shortening along strike and block rotations [Kley, 1999; Arriagada et al., 2008].
The Patagonian bend (to avoid misunderstanding with the genetic term“orocline”) is mainly defined by the shape of the southern tip of the margin of South America and the curved Magallanes fold and thrust belt (FTB). The Magallanes FTB is related to compressive deformation following the closure of the Rocas Verdes basin and the formation of Cordillera Darwin Metamorphic Complex (Figure 1b) [Dalziel, 1981; Klepeis, 1994a, 1994b]. Counterclockwise (CCW) tectonic rotations recorded by the southernmost units, to the south of Cordillera Darwin, were interpreted as evidence for an oroclinal origin of the Patagonian bend related to the
Tectonics
RESEARCH ARTICLE
10.1002/2014TC003555
Key Points:
• Sediments from the Magallanes fold and thrust belt have low magnetite content
• CCW rotations of about 20° are recorded near the hinge of the belt • The curved Magallanes fold and thrust
belt is mainly a primary arc
Supporting Information: • Readme • Table S1 • Table S2 • Table S3 • Table S4 • Figure S1 • Figure S2 • Figure S3 • Figure S4 • Figure S5 • Figure S6 Correspondence to: F. Poblete, ferpoble2@gmail.com Citation:
Poblete, F., P. Roperch, F. Hervé, M. Diraison, M. Espinoza, and C. Arriagada (2014), The curved Magallanes fold and thrust belt: Tectonic insights from a paleomagnetic and anisotropy of magnetic susceptibility study, Tectonics, 33, doi:10.1002/2014TC003555. Received 13 FEB 2014 Accepted 24 NOV 2014
closure of the Rocas Verdes basin [Dalziel et al., 1973; Burns et al., 1980; Cunningham et al., 1991; Rapalini, 2007]. However, analog sandbox experiments [Ghiglione and Cristallini, 2007] suggest that the curvature of the Magallanes FTB was mainly controlled by the shape of a rigid, concave to foreland indenter. Thus, the curved Magallanes FTB can be regarded as a primary bend.
Despite their importance to better understand the tectonic evolution of fold and thrust belts, paleomagnetic studies are scarce in number of sites and areal coverage in Patagonia (Figure 1b). We have done an extensive paleomagnetic study in the Magallanes FTB applying both paleomagnetic and anisotropy of magnetic susceptibility (AMS) methods to better understand the kinematic evolution of the area. AMS is a powerful nondestructive petrofabric tool. The AMS is controlled by individual grains in which the crystallographic orientation or grain shape orientation creates a preferred direction of magnetization [Martin-Hernandez et al., 2004; Parés et al., 1999, for a review]. The application of AMS methods in sediments deposited in compressional tectonic settings has proved to be a reliable paleostress indicator, and AMS can be a very useful tool to unveil complex tectonic histories [Kligfield et al., 1981; Borradaile and Henry, 1997; Parés et al., 1999; Robion et al., 2007; Soto et al., 2009; Roperch et al., 2010]. In undeformed rocks, the minimum axes of the AMS ellipsoid are well grouped and correspond to the bedding pole of the strata while maximum axes are dispersed within the bedding plane [Borradaile and Henry, 1997]. With increasing compressive deformation, maximum axes become more clustered perpendicular to the shortening direction [Borradaile and Henry, 1997]. In slightly deformed rocks, a sedimentary AMS fabric can still be observed, but when the deformation is more intense, the tectonic AMS fabric can totally obliterate the sedimentary fabric [Borradaile and Henry, 1997; Kligfield et al., 1981; Parés et al., 1999; Robion et al., 2007; Soto et al., 2009]. AMS lineations are usually contained in the bedding plane, subhorizontal in in situ coordinates and parallels to fold axes. Tilted AMS lineations may indicate complex
Figure 1. (a) General tectonic setting of southern Patagonia. Contour lines are thickness of the sedimentaryfill in the Magallanes basin (modified from Biddle et al. [1986], Klepeis [1994a], Lodolo et al. [2003], Ghiglione et al. [2009], Klepeis et al. [2010], and Fosdick et al. [2011]). MFFZ = Magallanes-Fagnano fault zone, CBFZ = Canal Beagle fault zone, SFZ = Shackleton Fracture Zone. Inset locates thisfigure in South America. Right: Main morphotectonic units of the region (modified from Klepeis [1994a] and Klepeis et al. [2010]). White squares and red dots show, respectively, the sites sampled by Maffione et al. [2010] and in the present study. Red lines show selected published structural profiles in the region; (1) Ghiglione et al. [2009], (2) Fosdick et al. [2011], (3) Alvarez-Marrón et al. [1993], (4) Klepeis [1994a], (5) Klepeis et al. [2010], and (6) Kraemer [2003]. Rectangles A–C are the locations of the detailed geological maps shown in Figure 3 for, respectively, the Última Esperanza, Magallanes, and Tierra del Fuego provinces. Data supporting Figure 1 is available in Table S1 in the supporting information.
folding, often very difficult to discriminate in the field and can sometimes be used to correct paleomagnetic data in such troublesome cases [Roperch et al., 2010].
In this contribution we present AMS and paleomagnetic results from 85 sites sampled in Cretaceous to Miocene sediments from the provinces of Última Esperanza (32 sites) in the NW, Magallanes (16 sites) in the center, and Tierra del Fuego (37 sites) in the SE.
2. Geological Setting and Rocas Verdes-Magallanes Basin Evolution
2.1. Geodynamic Setting
Rifting and thermal subsidence, associated to the Gondwana breakup, marked the early evolution of the Rocas Verdes basin [Calderón et al., 2007; Pankhurst et al., 2000] (Figure 2). The Late Jurassic extensional phase led to the formation of an oceanic crust and to the infill of the Rocas Verdes basin during its thermal subsidence [Klepeis et al., 2010; Mpodozis et al., 2011]. During the Late Cretaceous, the westward motion of South America, induced by the opening of the South Atlantic Ocean [Seton et al., 2012], triggered the closure of the Rocas Verdes basin [Dalziel et al., 2013; Cunningham, 1995].
The closure of the Rocas Verdes basin likely resulted in obduction, continental underthrusting, and recently uplift and exhumation of Cordillera Darwin [Klepeis et al., 2010] (Figure 1b). Theflexural loading associated with the early stages of compression marked the onset of the Magallanes retroarc foreland basin and the related Magallanes FTB [Fildani and Hessler, 2005; Fosdick et al., 2011]. The deformation front migrated toward the foreland resulting in the formation of the early Cenozoic foreland basin [Alvarez-Marrón et al., 1993; Mpodozis et al., 2011]. Shortening and migration of the deformation front toward the foreland continued until the Neogene with uplift occurring since the Miocene [Fosdick et al., 2011; Ghiglione et al., 2009; Torres-Carbonell et al., 2014].
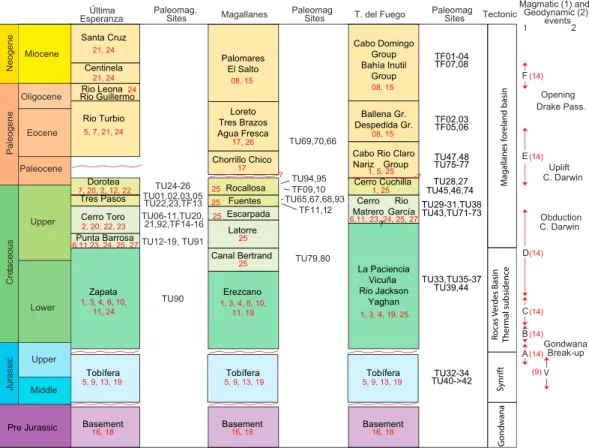
Figure 2. Simplified stratigraphy of the Rocas Verdes and Magallanes basin for each province and summary diagram of the main tectonic, magmatic, and geodynamic events (modified from Mpodozis et al. [2011]). Paleomagnetic site numbers are shown in front of the corresponding sampled stratigraphic unit. Data supporting Figure 2 are available in the supporting information Table S1. Numbers in red correspond to references listed in the supporting information Table S1. V: Jurassic silicic magmatism; A–D: Timing of emplacement of the South Patagonian batholith.
In Tierra del Fuego, a strike-slip component mainly along the Magallanes-Fagnano fault zone [Cunningham, 1993; Diraison et al., 2000; Klepeis et al., 2010; Menichetti et al., 2008] was induced by spreading in the proto-Scotia Sea after 50 Ma [Eagles et al., 2006; Lagabrielle et al., 2009].
The Magallanes-Fagnano fault zone (Figure 1a) is currently a left lateral strike-slip fault that cuts across Tierra del Fuego, forming at the present the plate boundary between the South American and the Scotia plates [Smalley et al., 2003, 2007]. The Magallanes-Fagnano fault zone intersects the Chilean trench approximately at 51.5°S (Figure 1a) with the Antarctic Plate subducting beneath the South American plate to the north, while to the south, and until 58°S, subduction of the Antarctic plate occurs beneath the Scotia Plate. South of 58°S the contact between the Antarctic and the Scotia plates is a sinistral transform plate boundary [Klepeis and Lawver, 1996], the Shackleton Fracture Zone (Figure 1a). The Magallanes-Fagnano fault zone is the continuation on land of the North Scotia Ridge, and it is supposed to accommodate more than 200 km of left lateral strike-slip displacement [Klepeis, 1994b] even though no more than 25 km has been reported [Klepeis, 1994b; Lodolo et al., 2003; Rossello, 2005; Smalley et al., 2003]. The kinematic evolution of the Scotia Plate proposed by Eagles and Jokat [2014] implies an even more complex tectonic history of extension and compression along the sinistral Magallanes fault system.
2.2. A Tectonostratigraphic Synthesis of the Rocas Verdes-Magallanes Basin System
The southern tip of South America can be broadly divided in four tectonic provinces. They are, from west to east (Figure 1b): (1) the South Patagonian batholith, (2) the Rocas Verdes basin, (3) the Magallanes FTB, and (4) the Cenozoic Magallanes foreland basin [Klepeis, 1994a]. The Cordillera Darwin Metamorphic core, located in the Cordillera Darwin range, is unique in having the highest metamorphic grade (upper amphibolite facies) in South America [Klepeis, 1994a].
Early Jurassic-Early Cretaceous silicic volcanism in Patagonia represents the early stages of the Gondwana breakup [Féraud et al., 1999; Pankhurst and Rapela, 1995; Pankhurst et al., 2000]. In the study area, this volcanism is represented by the Tobifera Formation, a volcano-sedimentary succession that was deformed during the closure of the Rocas Verdes basin but also during multiple deformation events in the Cenozoic [Bruhn et al., 1978; Fosdick et al., 2011; Klepeis et al., 2010]. During Late Jurassic-Early Cretaceous times and coeval with the late stages of the silicic volcanism of the Tobifera Formation, extension led to the development of the Rocas Verdes basin, which wasfloored by an oceanic crust preserved today in the pseudo-ophiolitic Tortuga and Sarmiento complexes made of pillow lavas, breccias, sheeted dykes, and gabbros [Calderón et al., 2007; Stern and De Wit, 2003]. The Early Cretaceous Yaghan Formation is the sedimentary infill of the basin, which unconformably overlies the Tobifera Formation [Olivero and Malumián, 2008].
The onset of the contractional phase occurred during the Albian-Cenomanian [Fosdick et al., 2011]. In the Última Esperanza province, the change in the tectonic regime is marked by the appearance of medium-grained turbidites from the Punta Barrosa Formation [Fildani and Hessler, 2005; Wilson, 1991] which conformably cap the Zapata Formation via a gradational contact [Fildani and Hessler, 2005] (Figure 2). To the south, in Peninsula Brunswick, the Punta Barrosa Formation can be correlated with the Latorre Formation [Mpodozis et al., 2007]. A U/Pb detrital zircon age of 96 Ma, at the base of Latorre Formation [McAtamney et al., 2011], and a statistically significant group of 89 Ma (early Coniacian) zircons [Mpodozis et al., 2007] suggest that the initial stage of deformation begun, as in Última Esperanza, during the Coniacian. In Tierra del Fuego, the change of the tectonic regime is marked by the limit between the Albian-Turonian La Paciencia Formation and the Santonian-Maastrichtian Cerro Matrero Formation, a succession of dark-greenish shales and lenticular packs offine-medium size conglomerates and sandstones [Cortés and Valenzuela, 1960; Mpodozis et al., 2011]. U/Pb detrital zircon ages of 82 Ma for the base of Cerro Matrero Formation indicates that transition to foreland basin sedimentation in Tierra del Fuego began several Myr after that in the Última Esperanza-Magallanes Province [McAtamney et al., 2011]. Deep water deposition continued without interruption in the whole area until early Maastrichtian [Bernhardt et al., 2011, 2012; Romans et al., 2010]. In Última Esperanza, the sequence includes mudstones and sandstones of the Cerro Toro Formation and the Campanian-Maastrichtian turbiditic deposits of the Tres Pasos Formation [Bernhardt et al., 2012; Shultz et al., 2005]. The Cerro Toro Formation can be correlated to the south with the Latorre Formation in the Magallanes province and with the Cerro Matrero Formation in Tierra del Fuego Province [Cortés and Valenzuela, 1960; McAtamney et al., 2011; Mpodozis et al., 2007]. The Tres Pasos Formation can be correlated
with the Fuentes/Rocallosa Formation in Magallanes province and the late Campanian-Danian Cerro Cuchilla Formation in the Tierra del Fuego province [Sanchez et al., 2010].
Shallow water sedimentation dominated during late Maastrichtian-Danian [Mpodozis et al., 2011]. In Última Esperanza Province, the Tres Pasos and Dorotea formations mark the shift from deep to shallow water sedimentation. The Dorotea Formation consists offine- to medium-grained sandstone, deposited in a shallow marine and deltaic environment, and intercalated with some megafauna-bearing beds [Malumián and Caramés, 1997]. Fossiliferous sediments of the Dorotea Formation can be correlated to the Rocallosa Formation in the Magallanes Province [Mpodozis et al., 2011], and with the sediments of Cerro Cuchilla Formation in Tierra del Fuego [Cortés and Valenzuela, 1960; Mpodozis et al., 2011; Sanchez et al., 2010]. A hiatus in sedimentation during the late Paleocene-early Eocene was followed by a late Middle Eocene transgression in Última Esperanza [Biddle et al., 1986; Fosdick et al., 2011; Malumián and Caramés, 1997; Quattrocchio, 2009; Malumián and Nañez, 2011]. In Magallanes province, sandstones and mudstones from the Chorrillo Chico Formation are thefirst Paleocene deposits [Mpodozis et al., 2011]. Quattrocchio [2009] assigned a late Danian age for the Chorrillo Chico Formation; however, U/Pb detrital zircon ages around 58 Ma suggest a younger age for this formation and thus a hiatus in sedimentation during the early Paleocene likely occurred [Mpodozis et al., 2011]. Sedimentation continued with deposition of the middle Eocene microfossiliferous sandstones and mudstone from the Agua Fresca Formation [Otero et al., 2012; Quattrocchio, 2009]. In Tierra del Fuego, the Cabo Nariz bed and Rio Claro group were deposited during the early Paleocene [Mpodozis et al., 2011; Olivero and Malumián, 2008; Sanchez et al., 2010]. They are capped by a succession of bioturbated glauconitic sandstones, andfluvial and marine conglomerates and sandstones from the La Despedida group, Ballena Group, and equivalents [Olivero and Malumián, 2008]. In the region, deposition continued until the Miocene (Cabo Domingo Group and equivalents) [Fosdick et al., 2011; Olivero and Malumián, 2008].
3. Previous Structural and Paleomagnetic Studies
Several structural and a few paleomagnetic studies have been carried out in order to characterize the amount of shortening and possible rotation in the southernmost Andes (Figure 1b). Structural studies estimated 19% to 23% (29–40 km) of shortening in the Torres del Paine region [Fosdick et al., 2011; Ghiglione et al., 2014]. More than 50% of the total shortening was achieved during the Late Cretaceous [Fosdick et al., 2011]. In Tierra del Fuego, north of the Colo-Colo thrust (external part of the Magallanes FTB), Alvarez-Marrón et al. [1993] estimated 30 km of shortening for a short section west of Lago Blanco with more than 50% of shortening based on seismic profiles. Rojas and Mpodozis [2006] estimated a minimum of 50 km of shortening between Cordillera Darwin and the frontal thrusts in the Tertiary foreland basin. Klepeis et al. [2010] reported 50 km of shortening within Cordillera Darwin. Thus, a shortening of ~100 km can be estimated between the Beagle Channel and Estancia Vicuña (Figure 3c). However, the total amount of shortening is impossible to determine [Rojas and Mpodozis, 2006].
Previous paleomagnetic and AMS studies in the Magallanes FTB and Magallanes basin are very scarce. Most of the relevant paleomagnetic results have been obtained in the area of the Rocas Verdes basin and the Fuegian Batholith and are related to the closure of the Rocas Verdes basin and not to the curvature of the Magallanes FTB [Burns et al., 1980; Cunningham et al., 1991; Dalziel et al., 1973; Rapalini et al., 2001, 2008]. Maffione et al. [2010] presented paleomagnetic and AMS results from 22 sites drilled in Eocene marine sediments mainly on the Atlantic coast of Tierra del Fuego.
Structural studies show that the amount of shortening increases from north to south in the Austral Andes [Alvarez-Marrón et al., 1993; Betka, 2013; Fosdick et al., 2011; Ghiglione et al., 2014; Klepeis, 1994a]. The along-strike variation in tectonic shortening has been associated with the development of the Patagonian bend [Cunningham, 1995; Diraison et al., 2000; Kraemer, 2003]. However, Sussman et al. [2012] emphasize how important the impact of vertical axis rotation is for shortening estimates (up to 50% of error for a 60° of rotation) and the importance of integrating paleomagnetic analyses and structural studies to measure accurately the tectonic shortening. In the austral Andes, the lack of paleomagnetic data and the poor quality of surface and subsurface data obscures an accurate tectonic model for the development of the Patagonian bend and its possible relation to differential shortening.
Figure 3. Simplified geological maps from (a) Última Esperanza province, (b) Magallanes province, and (c) Tierra del Fuego province. Modified from Fosdick et al. [2011], Sanchez et al. [2010], McAtamney et al. [2011], SERNAGEOMIN [2003], Olivero and Malumián [2008], Ghiglione et al. [2009], Klepeis [1994a], and Alvarez-Marrón et al. [1993]. White circles/squares are sites labeled as TU/TF, respectively. Red circles/squares are sites with reliable characteristic remanent magnetizations. The color pink, purple, light green, and white of the rectangles underlying the site numbers in Tierra del Fuego corresponds, respectively, to sites in the Lago Fagnano domain, Cordon de la Paciencia domain, and intermediate and external domains of the Magallanes FTB. Data supporting Figure 3 is available in the supporting information Table S1.
4. Paleomagnetic Sampling and Methodology
4.1. Sampling
We sampled 85 paleomagnetic sites (Figures 1b, 2, 3a–3c, and supporting information Table S1) from (1) the Última Esperanza province (north) at ~51°S (32 sites, Figures 2 and 3a), (2) Magallanes province (center) at ~53°S (16 sites, Figures 2 and 3b), and (3) Tierra del Fuego province (south-east), north of Lago Fagnano (37 sites, Figures 2 and 3c). Sites with code TF were sampled in 1997 during a preliminary study while sites with codes TU were sampled in 2011 and 2012. Age control is based on previously published data (Figure 2 and supporting information Table S1). Samples were collected mainly from Cretaceous to Paleogene marine mudstones and sandstones of the Magallanes FTB. Five sites were drilled in Jurassic volcaniclastic rocks near Lago Fagnano, and intrusive rocks were sampled at three sites.
Samples were cored with a portable drill and orientated with a magnetic compass and a Sun compass whenever possible. When Sun orientation was not possible, the magnetic orientation was corrected automatically using the declination calculated from the International Geomagnetic Reference Field at each site.
In the area of Última Esperanza (Figure 3a), the oldest sampled unit is the Lower Cretaceous Zapata Formation drilled at site TU90. The outcrop consists of a sequence of black shales with a penetrative cleavage. Nine sites (TU12 to TU19 and TU91) were drilled in mudstones and sandstones from the Turonian Punta Barrosa Formation. We drilled 14 sites from the Upper Cretaceous Cerro Toro Formation (TU06 to TU11; TU20, TU21, TU92; TF14 to TF16) and seven sites in the Tres Pasos Formation (TU01, TU02, TU03, TU05, TU22, TU23; TF13). Outcrops consist of intercalations of sandstones and minor mudstones. Sites TU05 and TU07 have characteristic sandstone layers that display very well rounded decimeter-diameter concretions. At site TF13, a cleavage mainly affects thefine-grained mudstone layers. Finally, we drilled three sites (TU24, TU25, and TU26) in sandstones from the Dorotea Formation.
In the area of Magallanes province (Figure 3b), we drilled dykes and their host sedimentary rocks from the Canal Bertrand Formation at sites TU79 and TU80. A penetrative cleavage is observed in the sedimentary rocks at this location. We have no good constraints on the age of the dykes, which do not display evidence of deformation. We drilled six sites (TU65, TU67, TU68, TU93, TF11, and TF12) from the Fuentes Formation and four sites from the Rocallosa Formation (TU94, TU95, TF09, and TF10). Finally we drilled three sites (TU66, TU69, and TU70) from the Eocene Agua Fresca Formation. Samples in this region were drilled mainly from fine-grained sandstones and mudstones or in concretions when they were present.
In Tierra del Fuego (Figure 3c), all sites were drilled north of the Magallanes-Fagnano fault zone and are grouped into four domains (Figure 3c): (1) the external domain, consisting of sediments located north of the Miraflores anticline [Alvarez-Marrón et al., 1993], (2) the intermediate domain between Lago Deseado and the Estancia Vicuña (LD and EV in Figure 3c), (3) the Cordon de la Paciencia (CP in Figure 3c) domain in which several back thrusts have been described by Klepeis [1994a], and (4) the Lago Fagnano domain, located at the western tip of the Lago Fagnano.
In the external domain, three sites (TF01, TF04, and TF07) were drilled from the Oligo-Miocene Cabo Domingo group. Site TF08 was drilled in the Oligocene Bahía Inútil Formation. Sites TF05 and TF06 were sampled in the Eocene Ballena Group. In the intermediate domain, 11 sites were drilled along the intertidal zone of the west coast of Tierra del Fuego (Figure 3c): three sites (TU71–TU73) in sandstones and mudstones from the Campanian Cerro Matrero Formation, three sites (TU45, TU46, and TU74) in the Maastrichtian-Danian mudstones of Cerro Cuchilla Formation, andfive sites (TU47, TU48, and TU75–TU77) in sandstones of the Paleocene Cabo Nariz Beds. In the inner part of Tierra del Fuego,five sites (TU29, TU30, TU31, TU38, and TU43) were drilled in the Upper Cretaceousfine sandstones and mudstones of Cerro Matrero Formation (north of Deseado Lake). These sites present some degree of cleavage, developed mainly in thefine-grained rocks. Sites TU27 and TU28 were drilled from marine sedimentary rocks of the Cerro Cuchilla Formation,
immediately north of the Vicuña thrust according to the geological map of Alvarez-Marrón et al. [1993]. Veins, suggestingfluid circulation, were observed at site TU27. Near the Atlantic coast, we sampled two sites (TF02 and TF03) in sediments from the Eocene La Despedida group. In the Cordon de la Paciencia domain, four sites (TU35–TU37 and TU39) were drilled from La Paciencia Formation, near the western tip of the Lago Fagnano. Finally, in the Lago Fagnano domain, we drilledfive sites (TU32, TU34, and TU40–TU42) from the Upper Jurassic Tobifera Formation and one site (TU33) from the Lower Cretaceous Rio Jackson Formation. Sites TU32 and
TU34 were taken from the volcanoclastic succession while sites TU40 and TU42 were drilled from an intercalation of medium- tofine-grained sandstones. Site TU41 was drilled near a fault zone. Site TU33, drilled in shales from the Rio Jackson Formation, presents afine subhorizontal cleavage subparallel to bedding.
4.2. Paleomagnetic Methodology
Natural remanent magnetization (NRM) was measured with a 2G cryogenic magnetometer (Rennes). Stepwise alternatingfield (AF) demagnetizations were made using the three axis AF degausser online with the 2G magnetometer. In order to mitigate the effects of gyroremanent magnetization, the remanent magnetization was measured after each axis of AF demagnetization according to the procedure described by Dankers and Zijderveld [1981] and Roperch and Taylor [1986]. From 655 samples, 405 specimens were progressively demagnetized using stepwise thermal techniques with a MMTD furnace where the residual field was less than 10 nT. The 2G cryogenic magnetometer and the MMTD furnace are located inside a shielded room with a residualfield of about 500 nT, and the samples were stored in mumetal shields with residualfields of less than 20 nT prior to the measurements with the 2G magnetometer. Magnetic susceptibility was measured after each or every second thermal demagnetization step, in order to monitor magnetic mineralogical changes upon heating. In samples for which a large susceptibility increase was observed during thermal demagnetization, the demagnetization procedure was in some cases followed by AF methods. Characteristic remanent magnetization (ChRM) component directions were determined using principal component analysis [Kirschvink, 1980]. Site mean directions were defined using classical Fisher statistics or a combination of bestfit lines and remagnetization circles when necessary [McFadden and McElhinny, 1988]. The magnetic carriers of the ChRM were investigated further by means of isothermal remanent magnetization (IRM) acquisition curves, thermal demagnetization of three axis-orthogonal IRMs, variation of low-field magnetic susceptibility versus temperature (K-T experiments), and Hysteresis cycles. IRM were given with an ASC Scientific pulse electromagnet, and K-T experiments were done with the AGICO KLY3-CS3 instrument. Hysteresis curves were obtained with the AGM2900 from Princeton Measurements Corporation at LSCE, Gif/Yvette, France. Additionally, polished thin sections of the studied rocks were observed in transmitted and reflected light and analyzed with a scanning electron microscope (SEM) with energy dispersive X-ray spectroscopy to identify the magnetic carriers and the amount of diagenesis/alteration processes that could affect the rock magnetic record.
AMS of one or two specimens per core was measured with the KLY3 Agico spinner kappabridge. Anisotropy of anhysteretic remanent magnetization in six positions (X, X, Y, Y, Z, and Z) was acquired with the 2G degausseur system for three samples with anomalous AMS fabric to test the nature of the magnetic carriers of AMS.
5. Paleomagnetic Results
5.1. Rock Magnetic Studies: Magnetic Properties and Optical Descriptions
Most samples from sedimentary rocks have the same range of magnetic susceptibility (1 to 5 × 10 4SI) regardless of the geological formation or location within the Magallanes FTB (supporting information Figure S1). The range of variation of the NRM intensity is large, but most mean site NRM values are in between 5 × 10 5and 10 3A m 1.
K-T experiments show, in general, irreversible heating and cooling curves (supporting information Figure S2). Most samples displayflat heating curves in which susceptibility diminishes gradually up to ~380°C. After this, magnetic susceptibility increases with a peak at ~500–550°C indicating the formation of magnetite upon heating. Upon cooling, there is a major increase in magnetic susceptibility with some samples exhibiting a secondary magnetic Curie point around 350°C. The sample from site TU28 (supporting information Figure S2) has a different magnetic behavior with an almost reversible heating and cooling curve and Ti-poor titanomagnetite as the main magnetic carrier.
The heating and cooling curve from specimen TU2608 shows a small inflexion at ~300°C that is not observed in the other samples. This peak may correspond to the presence of pyrrhotite in the sample. One K-T experiment (sample TU7901, supporting information Figure S2) in one sample from a dyke intruding sediments at site TU79 shows a characteristic maghemite phase that is not observed in the cooling curve. There is no evidence of maghemite or goethite in the sediments.
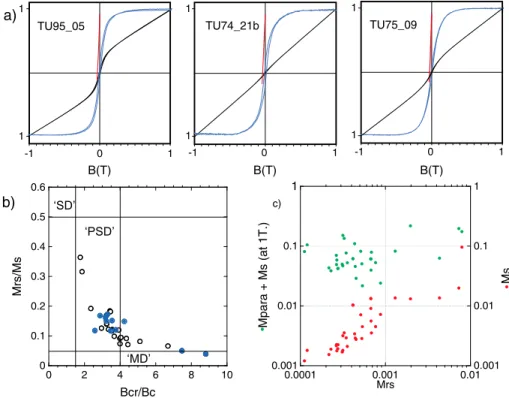
Several hysteresis experiments were performed at room temperature in afield of up to 1 T. Typical hysteresis plots are shown in Figure 4a (supporting information Table S2). The saturation remanent magnetization (Mrs), the saturation magnetization (Ms), and the coercive force (Hc) were calculated after correction for the paramagnetic contribution. The paramagnetic phase is clearly observed in hysteresis loops uncorrected for paramagnetism (Figure 4a) and represents more than 90% of the total magnetization at 1 T (Figure 4c). Mrs is only 1% of the total magnetization in some samples (sample TU74_21b, for example). In a Day plot [Day et al., 1977] (Figure 4b), most of the samples have Mrs/Ms ratios between 0.1 and 0.2 and fall in the Pseudo Single Domain range.
In order to gain a better understanding of the remanent magnetic carriers, thermal demagnetization of orthogonal IRMs was performed on 29 samples [Lowrie, 1990] (supporting information Figure S2). Samples were saturated along the Z axis at 2500 mT, then at 250 mT along Y, and at 50 mT along X. The largest component is the low-coercivity fraction along the X axis. The magnetization carried by the high-coercivity fraction is on average 12% of the sum of the magnetization carried by the low- and medium-coercivity fractions (values are normalized to the initial soft magnetization value). During the thermal demagnetization (150°C to ~400/570°C), the low- and medium-coercivity fractions reveal unblocking temperatures typical of magnetite in sediments (maximum unblocking temperature of about 580°C [Lowrie, 1990, and references therein]). The high-coercivity fraction has slightly lower unblocking temperatures, possibly associated with a small amount of pyrrhotite (unblocking temperature of 325°C [Lowrie, 1990, and references therein]), but there is no evidence of goethite or hematite in these rocks (unblocking temperatures of, respectively, 80–120°C and 675°C [Lowrie, 1990, and references therein]). IRM acquisition and subsequent thermal demagnetization of the IRM at 1 T were done for one sample of each site of the 17 sites with code TF. Again, magnetite appears to be the main remanent magnetic carrier in the sediments (supporting information Figure S2). The situation is different for the sites located near Lago Fagnano (supporting information Figure S2). In these samples unblocking of the high-, medium-, and low-coercivity fractions is observed mainly in the temperature range 150–350°C. Maghemite, produced by low-temperature oxidation of magnetite, is usually destroyed upon heating with a
0 0.1 0.2 0.3 0.4 0.5 0.6 0 2 4 6 8 10 Bcr/Bc Mrs/Ms 0.001 0.01 0.1 1 0.001 0.01 0.1 1 0.0001 0.001 0.01 Mrs a) b) c) TU95_05 -1 0 1 1 B(T) 1 1 TU74_21b -1 0 1 B(T) 1 1 TU75_09 -1 0 1 B(T) 1 Mpara + Ms (at 1T.) Ms
Figure 4. (a) Selected hysteresis plots from representative samples with the magnetization normalized to the maximum value. Black/blue curves represent hysteresis loops before/after paramagnetic corrections. The red curve is the remanent magnetization curve. (b) Day plot [Day et al., 1977]; blue dots correspond to samples from sites with well-defined ChRM. (c) Plot of the total magnetization at 1 T (green dots) and the magnetization at saturation (Ms) after correction for paramagnetism (red dots) versus the saturation remanent magnetization (Mrs) (magnetization in Am2kg 1). Data supporting Figure 4 is available in the supporting information Table S2.
marked decrease in magnetic susceptibility at ~350°C. In one sample, the high-coercivity fraction above 250 mT is about 50% of the total IRM, while magnetic saturation for maghemite is around 250 mT. Pyrrhotite could be one of the magnetic carriers in these rocks, but more magnetic data are needed to confirm this interpretation. Microscopic observations of samples from sites TU27 and TU45 reveal the presence of pyrite and pyrite framboids in these sites (Figure 5). In particular, in site TU27, microscopic observations show clasts of plagioclase altered to sericite immersed in afine-grained size matrix. The matrix has veinlets of opaque minerals growing parallel to stratification. For site TU45, SEM observations in one sample show very well
Figure 5. Microphotographs of selected samples. (a–c) Images from optical observations in reflected light, (d) calcite veinlet in transmitted light, and (e–h) SEM observations.
developed pyrite framboids or pyrite growing inside plagioclase interstices (Figure 5). Magnetite was not observed with the optical microscope or SEM despite indications from the IRM and thermomagnetic curves that it is the main magnetic carrier in these rocks.
Thin and polished sections from site TU28 display bioclastic material with calcite ooids immersed in a fine-grained groundmass. Opaque minerals are grown around the bioclasts and in veinlets aligned parallel to the bedding plane or disseminated in the matrix. In contrast to other samples, magnetite grains exceeding 10μm size are also found at site TU28 (Figure 5).
At sites TU68 and TU93, decimeter-thick beds of calcareous sediments form discontinuous tabular lenses of variable length (0.5–5 m) intercalated with shale layers. The compact calcareous rocks contain irregular millimeter size veinlets subparallel to bedding. Optical and SEM observations of samples from site TU68 show that the veinlets are made of calcite growing perpendicular to the wall veinlet (Figure 5). The relationship between these veinlets and an anomalous AMS fabric is discussed below.
5.2. Characteristic Directions
Directions of characteristic remanent magnetization (ChRM) were obtained for 10 out of 85 sites in sedimentary and intrusive rocks (Table 1 and Figure 3). Results were obtained from seven sites in sedimentary rocks (TF07, TF10, TF11, TU28, TU45, TU74, and TU95) and three sites in intrusive rocks (TU78 and dikes from sites TU79 and TU80). Sedimentary rocks with reliable paleomagnetic results are located in the Magallanes province and Tierra del Fuego. Results from intrusive rocks come from sites located in the western part of Brunswick Peninsula, Magallanes province.
5.2.1. Results in Intrusive Rocks
Rock magnetic experiments indicate that magnetite is the main magnetic carrier in samples from the Miocene intrusive rocks (supporting information Figure S3). Samples presented a very well defined normal polarity ChRM going through the origin during demagnetization.
Two components of magnetization were observed in dykes from sites TU79 and TU80 after thermal
demagnetization. A reversed polarity magnetization was isolated at high temperature after removal of a normal polarity component with low unblocking temperatures (supporting information Figure S3). AF demagnetization was not as efficient as the thermal demagnetization to remove the low-temperature component, carried mainly by maghemite (supporting information Figure S3).
Table 1. Paleomagnetic Resulta
In Situ Tilt Corrected
Site Lithology N/n L/P Dec Inc Dec Inc α95 K Type/Age
Última Esperanza Province
TU05 Sandstone 9/10 5/0 0.1 64.2 332.8 46.7 10.2 57.0 B/<0.78
TU06 Sandstone 10/9 4/0 353.1 70.9 329.3 54.5 8.6 116.4 B/<0.78
Magallanes Province
TF11 Sandstone 11/14 14/0 140.1 67.7 192.7 68.9 6.4 40 A/65
TU78 Intrusive 9/12 11/0 332.9 64.9 332.9 64.9 3.5 169 A/~20?
TU79 Dike 6/7 4/3 144.8 44.1 112.6 44.1 2.8 519 A/~80?
TU80 Dike 4/7 3/2 174.3 58.1 110.2 65.8 7.5 120 A/~80?
TF10 Sandstone 12/13 11/0 207.5 27.1 140.2 69.8 6.1 58 A/65
TU95 Sandstone 18/23 17/0 222.9 10.5 143.6 76.2 3.1 135 A/65
Tierra del Fuego Province
TF07 Sandstone 10/13 11/0 191.2 65.4 191.2 65.4 4.3 114 A/~20?
TU28 Sandstone 8/9 9/0 358.7 67.2 6.9 22.7 3.7 198 B/<0.78
TU28 Sandstone 8/9 9/0 223.5 65.7 344.7 63.4 3.9 176 A/65
TU45 Sandstone 15/12 12/0 53.3 48.4 144.6 70.3 3.1 194 A/65
TU74 Sandstone 21/27 22/0 52.0 55.0 151.0 64.7 3.7 69 A/65
aN is the number of cores drilled per site; L/P is the number of lines and planes used to calculate the mean; L + P is the number of specimens with paleomagnetic
results; Dec and Inc are declination and inclination of the ChRM in in situ and after tilt correction;α95 is the semiangle at 95% confidence level; K is the Fisher precision parameter; Type/Age: type is for type of magnetization where A is the high-temperature primary magnetization and B is the low-temperature component for secondary magnetization; Age is the estimated age of magnetization in Ma.
5.2.2. Results in Sediments
Most samples with NRMs of less than 0.1 mA m 1provided scattered demagnetization plots either upon thermal or AF demagnetization. Despite the precautions taken in the laboratory (see paleomagnetic methods section),
spurious magnetizations were observed in many samples. The increase in magnetic susceptibility after heating above 400°C confirms the formation of magnetite as previously observed in the K-T experiment. To prevent further chemical transformation during heating, AF demagnetization was sometimes used after thermal demagnetization up to ~350°C. However, it was also difficult to use the AF demagnetization to further demagnetize these partially thermally demagnetized samples with neo-formed magnetite during heating because large gyroremanent magnetizations were also acquired during subsequent AF demagnetization.
The low-temperature component in in situ coordinates is close to the dipole field at several sites (supporting information Figure S4). For others, despite relative stability of the remanent magnetization upon thermal demagnetization at sample level, the high scatter in directions between samples impeded the calculation of a mean characteristic direction (supporting information Figure S4). We have no good explanation for this type of behavior.
Figure 7. (top) Orthogonal plots of (left) alternatingfield and (right) thermal demagnetization of representative samples of sites TU45 and TU74, respectively. (bottom) Equal area projection of the ChRMs of all samples from two sites TU95 and TU45 with bedding dipping in opposite directions. Blue circles and red squares are, respectively, in situ and tilt-corrected directions. Same legend as in Figure 6.
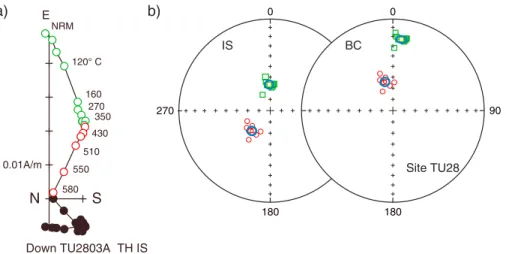
E S N Down TU2803A TH IS E NRM 120° C 160 270 350 430 510 550 580 0.01A/m 0 270 180 IS 0 90 180 BC a) b) Site TU28
Figure 6. (a) Orthogonal plot of a thermal demagnetization of a representative sample of site TU28. Solid/open circles correspond to projection onto the horizontal/vertical plane. Green/red circles highlight the low-/high-temperature component. (b) Equal area projection of the low- and high-temperature components for all samples of site TU28 in in situ and after tilt correction. Solid/open circles correspond to projection onto the lower/upper hemisphere.
Fortunately, six sites from the Magallanes FTB and one from the Magallanes foreland basin provided very reliable results with an angle<7° at 95% of confidence. A characteristic direction, with reverse polarity, was found at site TF07 in undeformed sediments of Miocene age (Figure 6a). The six other sites are in early Paleocene deformed sediments. Samples from site TU28 have a well-defined magnetic behavior upon thermal demagnetization. After removal of a secondary magnetization close to the dipolar direction with unblocking temperature below 350°C (Figure 6), a characteristic direction of normal polarity was observed for all samples above 400°C (Figure 6). For this site, there is no increase in magnetic susceptibility upon heating, and the ChRMs were easily recovered at high temperatures. From thefive other sites (TU45, TU74, TU95, TF10, and TU11), magnetic alteration with changes in magnetic susceptibility impeded complete thermal demagnetization of many samples above 450°C (supporting information Figure S5). The characteristic direction was thus defined by the best fit line anchored to the origin using the measurements in the temperature range 250–450°C. The same characteristic magnetization was recognized during AF demagnetization (Figure 7). In in situ coordinates, characteristic directions are clearly different from the present-dayfield or the dipolefield (Figure 8a). ChRMs are well grouped after bedding correction yielding a positive fold test [Tauxe and Watson, 1994] and with directions close to the expected direction (Figures 8a and 8c). There is no evidence for significant inclination shallowing.
5.3. Anisotropy of Magnetic Susceptibility Results
The shape of the ellipsoids (Figures 9–11) varies from oblate to prolate even between samples from the same site, but the main directions of the ellipsoids are usually well grouped for each site with the magnetic lineations contained in the bedding plane and nearly subhorizontal inclination in in situ coordinates.
Along the Magallanes FTB, the AMS results present a consistent pattern of lineations at site level that shows a good correlation with the main traces of faults and fold axes. The orientation of the AMS lineation changes from N-S in the Última Esperanza province to approximately E-W in the Tierra del Fuego province. Although this correlation is good at large scale, there are some differences at regional scale between the orientations of structures and lineations. The following results are presented according to their geographic location (supporting information Table S3).
b) a) 0 180 TC TU74 TU45 TU95 TF10 TF07 TF11 0 180 270 90 IS TU74 TU45 TU28 TU95 TF10 TF11 TF07
Figure 8. (a) Stereonets of site mean ChRMs from sedimentary sites. IS and TC for in situ and tilt-corrected directions. Filled (open) symbols are for positive (negative) inclinations. Black square is for the present-dayfield direction and diamond is for dipolefield. The expected directions in normal and reverse polarities (red diamonds) correspond to the expected directions for stable South America from the reference curve of Besse and Courtillot [2002]. (b) Fold tests according to Tauxe and Watson [1994] indicating magnetization acquired before tilting. Dashed blue lines are 95% confidence bounds. Solid line is the cumulative distribution of the % untilting required to maximize tau (maximum eigenvalue). Graphics and calculations were done with L. Tauxe’s PmagPy-2.51 software package.
5.3.1. Última Esperanza Province
Samples from sites in mid-Cretaceous sediments have triaxial ellipsoids with the largest degree of anisotropy exceeding 1.05. This degree of anisotropy is observed in rocks older than 90 Ma (Zapata Formation and the lower part of Punta Barrosa Formation), and the lowest anisotropy is found in rocks younger than 70 Ma (Tres Pasos and Dorotea formations).
Kmin axes are well grouped and nearly vertical after bedding correction for all but sites TU01, TU11, TU13, TU17, and TU90. All sites but TU11 and TU90 have subhorizontal Kmax directions with an average orientation around N350-S170 in both in situ and after bedding correction (Figure 9b).
5.3.2. Magallanes Province
Sites drilled in the Magallanes province correspond to the Upper Cretaceous-Eocene part of the FTB, with ages mainly in the range of 70–50 Ma. The shape and degree of AMS ellipsoids have the same range of variation as those observed in similar aged rocks from Última Esperanza province (Figure 10a). Most sites have a magnetic fabric with the magnetic foliation plane parallel to bedding. Sites TU79 and TU80 (Figures 10b–10d), located farther west, in an area where the internal deformation is stronger have the greatest degrees of anisotropy in the area with well-defined and subhorizontal magnetic lineations in in situ coordinate. At site TU80, the magnetic foliation in the shales is parallel to the macroscopic cleavage. Intrusive rocks were also sampled at sites TU79 and TU80. The intrusive rocks have a lower degree of anisotropy than that recorded in the host sediments (Figure 10a). At sites TU67, TU68, and TU93, several samples have strongly prolate magnetic fabrics with T values around 0.9 and P’ values in the range 1.05–1.1 (Figure 10a). The magnetic lineation does not coincide with the trend of the structures and the direction of AMS lineation observed in the area at other sites (supplementary Figure 6). In sites TU68 and TU93, samples contain veinlets with calcitefibers growing perpendicular to the veinlet’s walls. When comparing the orientation of the veinlets with the AMS ellipsoid, we observe that Kmax is nearly perpendicular to the plane of the veinlet. This result agrees with those obtained by Schmidt et al. [2006] in which
TC
0
270
90
180
IS
0
270
90
180
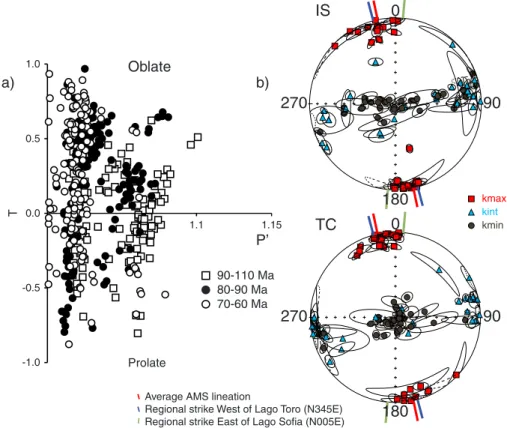
80-90 Ma 90-110 Ma 70-60 Ma P’ 1.1 1.15 -1.0 -0.5 0.0 0.5 1.0 T Prolate Oblate a) b) kmin kint kmaxAverage AMS lineation
Regional strike West of Lago Toro (N345E) Regional strike East of Lago Sofia (N005E)
Figure 9. (a) T-P’ diagram showing the shape of the AMS ellipsoids (all samples with symbols style according to the age of the rock). (b) Equal area projections of the AMS tensorial mean per site [Jelinek, 1978]. IS and TC are data in in situ and tilt-corrected coordinate. Squares, triangles, and circles are, respectively, AMS lineations, intermediate directions, and poles of AMS foliation. The red line indicates the mean orientation of the AMS lineation, while the blue and green lines are the main fold axes or structural lineaments west of Lago Toro and east of Lago Sofia, respectively. Data supporting Figure 9 is available in the supporting information Table S3.
the AMS of impure crystals of calcite shows Kmax subparallel to the calcite c axis. The anisotropy of anhysteretic remanent magnetization does not show such a well-defined magnetic fabric, indicating that the magnetic lineation is not controlled by ferromagnetic minerals but by paramagnetic minerals. We have not been able to identify magnetite or siderite in SEM observation, and only a few framboidal pyrite grains are observed. The veinlets are nearly parallel to bedding, and after bedding correction, the magnetic lineations are steep. The angle between the pole to bedding and the magnetic lineation may indicate that the veins are slightly oblique to bedding, that the AMS lineation is slightly oblique to the veins, or that the calcitefibers are slightly oblique to the pole of the plane of the veinlets.
We have no explanation for the strong anisotropy at site TU69. Samples from this site present a wide variability in the degree of anisotropy with P’ values ranging from 1.013 up to 1.233 (Figure 10a). The scatter in the orientation of the lineations prevents its use for tectonic purposes.
5.3.3. Tierra del Fuego Province
In Tierra del Fuego province, the results are grouped into four domains following the paleomagnetic sampling: (Figure 3c): (1) the external domain, (2) the intermediate domain, (3) the Cordon de la Paciencia domain, and (4) the Lago Fagnano domain.
Within the external domain, almost all samples have oblate AMS ellipsoids (Figure 11a). Sites drilled near the Atlantic coast (TF01, TF04, and TF07) have an oblate magnetic fabric with very well grouped Kmin directions perpendicular to the bedding plane and scattered magnetic lineations (T values close to 1). Sites TF05, TF06, and TF08 drilled north of the Miraflores anticline present a better-defined magnetic lineation (T parameter between 0.78 and 0.24).
In the intermediate domain, samples have both oblate and prolate ellipsoids (Figure 11b). Kmax directions are very well grouped in in situ and bedding correction coordinates, while Kmin directions are scattered in bedding correction coordinates (Figure 11b). Kmax directions are parallel to the average strike of bedding measured in the area (Figure 11b) or reported by Klepeis [1994a]. Site TF03 is the single site in this domain with a sedimentary fabric that lacks a well-defined tectonic overprint; its magnetic lineations are scattered in the bedding plane.
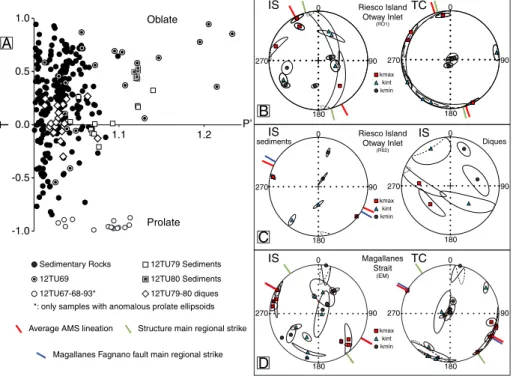
Figure 10. (a) T-P’ diagram showing the shape of the AMS ellipsoids with different symbols for different groups of samples. The asterisks represent samples from sites TU67, TU68, and TU93 with anomalous fabrics due to calcite veinlets. (b–d) Equal area stereonets of the AMS results for three localities. Same legend as in Figure 9 for the AMS plots. Data supporting Figure 10 is available in the supporting information Table S3.
A: External Domain
B: Intermediate Domain
C: Cordon de la Paciencia Domain
D: Fagnano Lake Domain
Figure 11. T-P’ diagram and equal area stereonets of AMS ellipsoids for several localities in Tierra del Fuego. (a) External domain, (b) intermediate domain, (c) Cordon de la Paciencia, and (d) Lago Fagnano domain. Same legend as in Figure 9 for the AMS plots. The grey-shaded path with arrow illustrates the changes in the parameter T and degree of anisotropy for increasing deformation (from Robion et al. [2007], modified from Borradaile and Henry [1997]). Data supporting Figure 11 is available in the supporting information Table S3.
In the Cordon de la Paciencia domain, Kmax axes have similar directions in both in situ and bedding correction coordinates (Figure 11c). These directions are close to the average strike of the S1 cleavage plane obtained by Klepeis [1994a] (Figure 11c), while Kmin directions are scattered. In this domain, P’ values are greater than in the internal domain, with the presence of both prolate and oblate ellipsoids.
The Lago Fagnano domain presents the largest values of P’ observed in the present study (Figure 11d). The increase in the degree of anisotropy in the Lago Fagnano and Cordon de la Paciencia domains is not related to an increased concentration of magnetite because these sites have low magnetic susceptibility values that are similar to those at sites from the other domains (Figure S1 and the supporting information). In the Lago Fagnano domain, it was not possible to measure bedding accurately because of the penetrative deformation in the area. The data are thus presented in in situ coordinates only. The sedimentary fabric is fully overprinted, and the magnetic foliation corresponds to the tectonic cleavage. The magnetic lineations have shallow inclinations except at site TU34 where the magnetic lineation is inclined steeper than 45°.
6. Discussion
6.1. Magnetic Properties
In the Magallanes basin, 76 sedimentary sites show magnetic susceptibilities less than 5 × 10 4SI; their magnetic susceptibility is mainly controlled by paramagnetic minerals. These magnetic properties differ from those expected in sedimentary volcanic-rich continental sediments (highest magnetic susceptibility controlled by magnetite [Roperch et al., 2000]) and suggest no or little contribution from mafic rocks or an active magmatic arc. However, this interpretation of the low magnetite content in most sedimentary units sampled in the present study is not supported by other geological evidence. U/Pb detrital-zircon geochronology of sandstones collected in the Magallanes foreland basin [Barbeau et al., 2009; Sanchez et al., 2010] indicate that, from the Late Cretaceous through most of the middle Eocene, detrital zircons reaching the foreland basin were most likely derived from the Patagonian-Fuegian magmatic arc.
From the 85 studied sites, primary ChRMs were obtained from seven sites in sediments and three sites in intrusive rocks. The ChRMs in sediments are clearly different from the dipolar or present-dayfield directions and yield a positive fold test (Figure 8c) with the Fisher concentration parameter increasing from a value of 3 while in situ to 167 after tilt correction. There is no significant inclination shallowing, suggesting that the ChRMs are postdetrital magnetizations, but the positive fold test demonstrates that the ChRMs are pretectonic magnetizations.
The other sites were rejected mainly because of unstable magnetizations during demagnetization or very scattered directions within a site. Components of magnetizations with low laboratory unblocking
temperatures were also rejected because they correspond mainly to viscous magnetizations as shown in the supporting information Figure S4. There are no obvious differences in magnetic properties between sites with well-defined ChRMs and those sites with poor magnetic behavior. Except for sites TU28 and TF07, where the magnetic susceptibility exceeds 0.001 SI without any major increase in magnetic susceptibility upon heating in the laboratory, sites with well-defined ChRMs present similar mineralogical changes upon heating as most sites with unstable magnetizations.
Thermal demagnetizations of three-component IRM [Lowrie, 1990] show no difference between sites with and without reliable paleomagnetic results (supporting information Figure S2). Similar conclusions can be drawn from thermomagnetic K-T curves (supporting information Figure S2). SEM observations show the presence of pyrite framboids that are observed both in sites with reliable magnetization and magnetically unstable sites. One possible explanation for the low concentration of magnetite is the formation of pyrite from magnetite and magnetite dissolution during diagenesis in a reducing environment [Canfield and Berner, 1987; Florindo et al., 2003]. We have found no evidence in SEM or optical microscopy for the reverse effect in which magnetite replaces pyrite framboids driven byfluids migration [Suk et al., 1990], which would imply a secondary origin for the magnetite.
There are also several geological explanations for the poor magnetic record at most of the sites. Late diagenesis in the petroleum-rich Magallanes basin during subsidence of the 6 km thick sedimentary sequence is one possible explanation for transformation of the magnetic minerals. Calcite veins were observed at some sites; Zanella et al. [2014] report evidence forfluid overpressure during hydrocarbon maturation in the Magallanes
basin with formation of calcite or quartz beef. Veins offibrous calcite form at temperatures from 70°C to 120°C [Cobbold et al., 2013], but quartz veins require higherfluid temperatures. Several polarity reversals of the Earth’s magneticfield have likely occurred during diagenesis of these Late Cretaceous sediments during which chemical magnetizations by the action of orogenicfluids could have overprinted magnetizations with opposite polarities making impossible the determination of a single component [Kars et al., 2012].
All paleomagnetic results in the Late Cretaceous-Paleocene sediments have reverse polarity except for site TU28. This may suggest that deposition and diagenesis occurred mainly during a 10 Myr long period (63–53 Ma) when the Earth’s magnetic field was mainly of reverse polarity [Cande and Kent, 1995].
Most published paleomagnetic studies are on rocks from the Pacific side of the Patagonian orogenic belt or south of Lago Fagnano [Burns et al., 1980; Cunningham et al., 1991; Dalziel et al., 1973; Rapalini et al., 2001, 2008]. There is only one paleomagnetic and AMS study in the Magallanes FTB [Maffione et al., 2010] with 22 sites sampled in sedimentary rocks cropping out near the Atlantic coast of Tierra del Fuego (Figure 1). Characteristic directions were reported for eight of these 22 sites, but some of these were determined with very low laboratory unblocking temperature ranges of 120–210°C and, in some cases, 210–360°C. The paleomagnetic directions have inclinations more than 30° shallower than the expected inclination; at four sites, the inclination shallowing exceeds 50°. Laboratory experiments [Tauxe, 2005] show that compaction processes can account for a maximum of no more than ~20° shallowing in inclination (see also Deamer and Kodama [1990]). Natural examples of inclination shallowing have also been reported [Maffione et al., 2008; Speranza et al., 1997; Cogné et al., 2013, and references therein], and only a few of them exceed 30°. Roperch et al. [2000] report a mean inclination shallowing of 15 to 20° in Oligocene-Miocene sediments from the Central Andes.
Our study confirms the difficulty of recovering well-defined ChRMs in sediments from the Magallanes basin. The absence of inclination shallowing in our study contrasts with the large inclination shallowing reported by Maffione et al. [2010] making a comparison between the two data sets difficult. Further work is needed to understand the cause of the low inclinations reported by Maffione et al. [2010]. From the study of Maffione et al. [2010], we will only consider the two sites with inclination shallowing less than 40° and a Fisher parameter greater than 10 (Table 2).
6.2. Tectonic Rotations
Tectonic rotations were only determined for the seven sedimentary sites (Figure 11a and Table 2). We do not calculate rotations for the results in the intrusive rocks because it was not possible to perform a fold test and because the ages are poorly constrained. Rotations were calculated by comparing our paleomagnetic result with the Apparent Polar Wander Path of stable South America presented by Besse and Courtillot [2002].
Paleocene sites from the eastern shore of Península Brunswick (TU95 and TF10) and from the western shore of Tierra del Fuego (TU45 and TU74) show rotations of 15.4° ± 8.5 to 26.3 ± 15.1 since 60 Ma (Table 2), while no rotation ( 1.6° ± 8.6) is found at site TU28 (Table 2) north of the Vicuña Thrust, in the less deformed area of Tierra del Fuego. Sites with CCW rotations are located near the hinge of the curved belt where deformation is noncoaxial and tectonic rotations should be expected during the Paleogene.
Two sites present a slight clockwise rotation (TF11 and TF07, Table 2). Site TF07 corresponds to undeformed Miocene sediments, making it difficult to explain this result in terms of tectonic rotation. The ChRMs of samples from site TU28 are better defined than those from site TF11, and we feel confident that the result at site TU28 can be used for tectonic interpretation despite its isolation. The apparent clockwise rotation recorded at site TF11 needs to be confirmed by additional data.
6.3. Magnetic Fabric
6.3.1. Origin of the Magnetic Fabric
The transition from a sedimentary to a tectonic magnetic fabric is usually well recognized in AMS data [Borradaile and Henry, 1997]. Robion et al. [2007] defined six types of magnetic fabric that characterize the changes from sedimentary (Type I) to tectonic fabric (Type VI). In our study, most of the samples have intermediate magnetic fabrics of type II with magnetic lineations orthogonal to compression axis and magnetic foliation parallel to bedding, or type III in which the AMS ellipsoids are more prolate than in Type II. The shape and degree of AMS follows the trend proposed by Borradaile and Henry [1997] (Figure 11).
The few sites with an oblate magnetic fabric, as might be expected for rocks with histories dominated by sedimentary processes and compaction (Type I of Robion et al. [2007]) are located in Tierra del Fuego near the Atlantic coast (Figure 11a) (TF01, TF04, and TF07).
In most of the other sites, magnetic lineations are very well grouped and Kmin directions are nearly vertical after bedding correction. Roughly north-south paleocurrent directions have been described in the Late Cretaceous formations from the Magallanes foreland basin in Última Esperanza province [Shultz et al., 2005]. We discard, however, paleocurrents as a source of the magnetic lineations because samples with varying degrees of anisotropy (and age) have very well clustered magnetic lineations, which parallel the main tectonic structures over a wide area. Also, magnetic lineation directions are very well grouped and do not reflects the variability of paleocurrents measured in the region. The AMS fabric is thus likely to be mainly controlled by tectonic processes with a compaction-dominated sedimentary fabric that was not fully overprinted by tectonic compression. This pattern is typical of the layer parallel shortening of Type II according to Robion et al. [2007].
Only sites within the most deformed inner part of the Magallanes FTB have scattered magnetic foliations and magnetic lineations controlled by shortening (Types III to IV in the classification of Robion et al. [2007]). In the Magallanes provinces, at site TU80, the magnetic foliation in the shales is parallel to the macroscopic cleavage and the magnetic fabric is dominated by a tectonic foliation with a high degree of anisotropy. In Tierra del Fuego, Kmin directions from the intermediate and Cordon de la Paciencia domains are scattered after bedding correction, with AMS ellipsoids indicating a tectonic imprint on the magnetic fabric due to layer parallel shortening (type III–IV from Robion et al. [2007]). A tectonic foliation was observed at some sites in the Lago Fagnano domain, and the high values of P’ are in agreement with a magnetic fabric controlled by tectonic strain (type IV or higher from Robion et al. [2007]). Deformation along the Magallanes fault zone is complex, and the scatter in AMS data between sites along it precludes any detailed tectonic interpretation. A complex pattern of AMS data was also obtained in the strongly deformed rocks to the south of Lago Fagnano [Esteban et al., 2011].
Anomalous fabrics with magnetic lineations nearly orthogonal to bedding were found in samples with calcite veinlets at sites TU67, TU68, and TU93 (see Figure S6 from the supporting information). The bulk magnetic susceptibility of the samples is ~15 × 10 5SI, well above the diamagnetic signal of pure calcite, suggesting that the anisotropy (~P = 1.1) is carried by paramagnetic Fe-rich particles associated with the calcitefibers. Zanella et al. [2014] interpret bedding-parallel veins offibrous calcite as evidence for fluid overpressure in petroleum source rocks. Further work is needed to better describe this anomalous magnetic fabric and its possible relation to tectonic processes involving vein development.
6.3.2. Magnetic Fabric Versus Structural Trend
The strike of AMS lineations changes from N-S in Última Esperanza to E-W in Tierra del Fuego (Figure 12). However, a closer inspection of the data indicates a small angle between the AMS lineation and the main regional strike, especially for sites south of Punta Arenas.
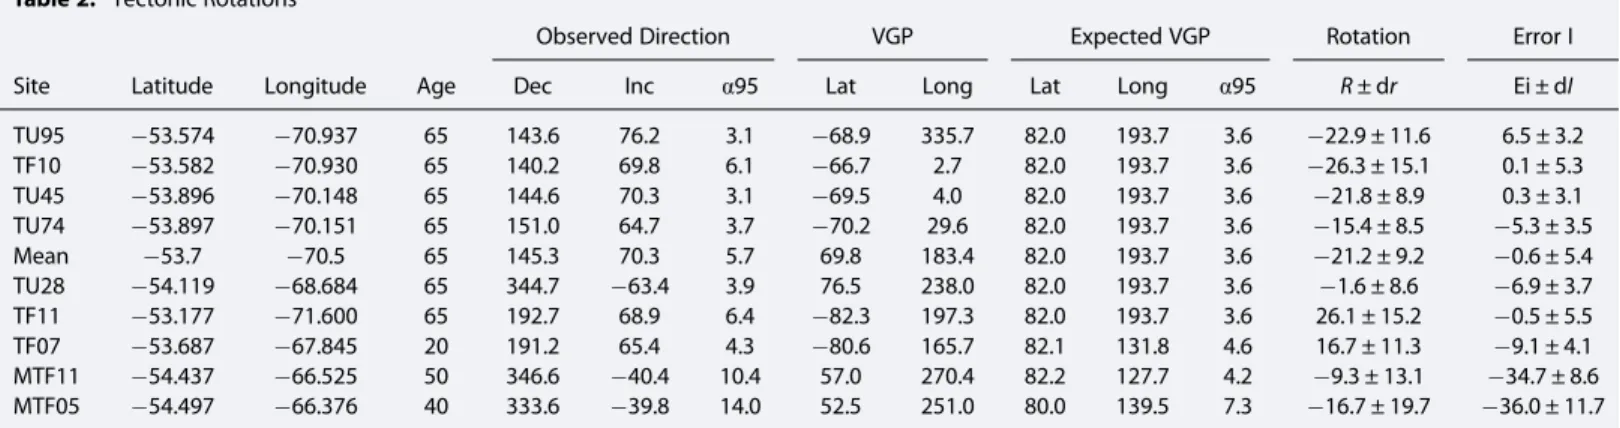
Table 2. Tectonic Rotationsa
Observed Direction VGP Expected VGP Rotation Error I
Site Latitude Longitude Age Dec Inc α95 Lat Long Lat Long α95 R ± dr Ei ± dI
TU95 53.574 70.937 65 143.6 76.2 3.1 68.9 335.7 82.0 193.7 3.6 22.9 ± 11.6 6.5 ± 3.2 TF10 53.582 70.930 65 140.2 69.8 6.1 66.7 2.7 82.0 193.7 3.6 26.3 ± 15.1 0.1 ± 5.3 TU45 53.896 70.148 65 144.6 70.3 3.1 69.5 4.0 82.0 193.7 3.6 21.8 ± 8.9 0.3 ± 3.1 TU74 53.897 70.151 65 151.0 64.7 3.7 70.2 29.6 82.0 193.7 3.6 15.4 ± 8.5 5.3 ± 3.5 Mean 53.7 70.5 65 145.3 70.3 5.7 69.8 183.4 82.0 193.7 3.6 21.2 ± 9.2 0.6 ± 5.4 TU28 54.119 68.684 65 344.7 63.4 3.9 76.5 238.0 82.0 193.7 3.6 1.6 ± 8.6 6.9 ± 3.7 TF11 53.177 71.600 65 192.7 68.9 6.4 82.3 197.3 82.0 193.7 3.6 26.1 ± 15.2 0.5 ± 5.5 TF07 53.687 67.845 20 191.2 65.4 4.3 80.6 165.7 82.1 131.8 4.6 16.7 ± 11.3 9.1 ± 4.1 MTF11 54.437 66.525 50 346.6 40.4 10.4 57.0 270.4 82.2 127.7 4.2 9.3 ± 13.1 34.7 ± 8.6 MTF05 54.497 66.376 40 333.6 39.8 14.0 52.5 251.0 80.0 139.5 7.3 16.7 ± 19.7 36.0 ± 11.7
aLatitude and Longitude are the geographic coordinates of the site; Dec and Inc is for mean declination and inclination;α95/P95 is the semiangle of confidence
at 95%. Lat/Long is for latitude/Longitude of the corresponding Virtual Geomagnetic Pole. R ± dr is the rotation value, and the error at each site. Ei ± dI is the inclination error. The expected VGP for stable South America is from Besse and Courtillot [2002]. Sites MTF11 and MTF05 are from Maffione et al. [2010].
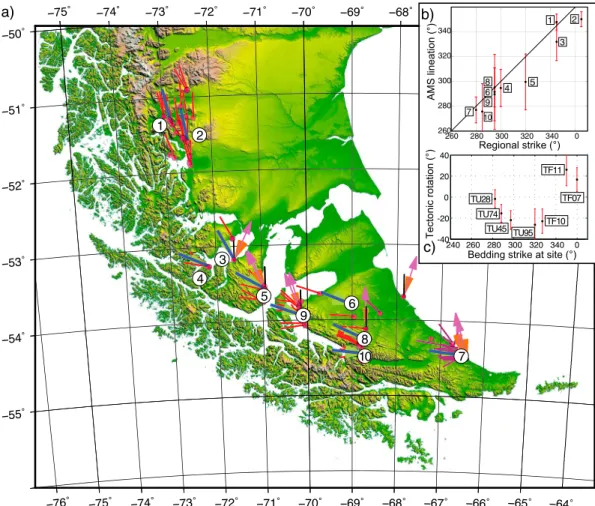
We used satellite images and topography (Shuttle Radar Topography Mission data) to determine the main regional strike at each locality, which we compared to a mean magnetic lineation calculated with Fisher statistics. Sites with confidence ellipses >20° around the tensorial mean magnetic lineation were excluded from this calculation (supporting information Table S3). This allows us to compare the regional trend of the structures with the average AMS lineation at each locality or group of sites.
In Última Esperanza province, we identified two regional structural trends, one with a direction of 345°N to the west of Lago Toro, and another with a strike of 5°N to the east of Lago Sofia (Figures 3a, 9, and 12). AMS lineations are parallel to the regional strike calculated west of Lago Toro. However, east of Lago Sofia, AMS lineations lie at an angle of ~25° CCW to the regional strike of recent structures located on the eastern part of the Magallanes FTB (Figures 3a, 9, and 12). Deformation in the area to the west of Lago Toro took place between 74 and 27 Ma, while folding in the area east of Lago Toro occurred mainly after 27 Ma [Fosdick et al., 2011]. Soto et al. [2009] have shown that tectonic AMS fabric might be acquired during the early stages of deformation. We speculate that AMS lineations were recorded after Late Cretaceous and before late Oligocene times, i.e., during the early stages of shortening in Última Esperenza province. The orientations of the AMS lineations suggest that they are not related to the youngest structures that deformed Lower Cenozoic rocks farther east. This interpretation implies a clockwise rotation in the orientation of the compressive strain during the late stages of the foreland basin evolution. On the other hand, the orientation of folds is also controlled by the orientation and shape of underlying basement blocks, and
a) b)
Figure 12. (a) Plot of AMS lineations at all sites (thin red lines) and the mean value at each locality (thick blue lines). Purple lines are AMS lineations from the study of Maffione et al. [2010]. Purple arrows are tectonic rotations determined from the ChRMs. The rotation angle is the angle between the thin black line and the arrow. (b) Plot of the AMS lineation versus the regional strike of folds and faults; number corresponds to localities plotted in Figure 12a. (c) Plot of the tectonic rotation versus the strike of bedding at the related site. Data supporting Figure 12 is available in Table 2 and supporting information Tables S3 and S4.