for Collaborative Knowledge Graphs —
The Case of Wikidata
Michael Luggen1, Djellel Difallah2, Cristina Sarasua3, Gianluca Demartini4,
and Philippe Cudr´e-Mauroux1 1
University of Fribourg, Fribourg, Switzerland {firstname.lastname}@unifr.ch
2
New York University, New York, USA [email protected]
3
University of Zurich, Zurich, Switzerland [email protected]
4
University of Queensland, Brisbane, Australia [email protected]
Abstract. Collaborative Knowledge Graph platforms allow humans and automated scripts to collaborate in creating, updating and interlinking entities and facts. To ensure both the completeness of the data as well as a uniform coverage of the different topics, it is crucial to identify underrepresented classes in the Knowledge Graph. In this paper, we tackle this problem by developing statistical techniques for class cardinality estimation in collaborative Knowledge Graph platforms. Our method is able to estimate the completeness of a class—as defined by a schema or ontology—hence can be used to answer questions such as “Does the knowledge base have a complete list of all {Beer Brands—Volcanos—Video Game Consoles}?” As a use-case, we focus on Wikidata, which poses unique challenges in terms of the size of its ontology, the number of users actively populating its graph, and its extremely dynamic nature. Our techniques are derived from species estimation and data-management methodologies, and are applied to the case of graphs and collaborative editing. In our empirical evaluation, we observe that i) the number and frequency of unique class instances drastically influence the performance of an estimator, ii) bursts of inserts cause some estimators to overestimate the true size of the class if they are not properly handled, and iii) one can effectively measure the convergence of a class towards its true size by considering the stability of an estimator against the number of available instances.
Keywords: Knowledge Graph · Class Completeness · Class Cardinality · Estimators · Edit History
1
Introduction
Knowledge Graphs (KGs) play a critical role in several tasks including speech recognition, entity linking, relation extraction, semantic search, or fact-checking. Wikidata [20] is a free KG that is collaboratively curated and maintained by a large community of thousands of volunteers. With currently more than 55M data
items and over 5.4K distinct properties that help describe these data items, Wiki-data is the bridge between many Wikimedia projects (e.g., Wikipedia, Wikime-dia Commons, and Wiktionary), as well as the interlinking hub of many other Linked Data sources. Its data is consumed by end-user applications such as Google Search, Siri, and applications to browse scholarly information5.
Being a collaborative, crowdsourced effort, Wikidata’s data is highly dy-namic. Editors can create items individually (e. g. a new instance representing a natural disaster that just happened), or in bulk (e. g. importing data about all the pieces of art in a city) about any topic that satisfies the notability criteria defined by the community6. The open curation process leads to a KG evolving
dynamically and at various speeds. While such a process is beneficial for data diversity and freshness, it does not guarantee the total (or even partial) complete-ness of the data. Given that previous research has shown that data consumers identify completeness as one of the key data quality dimensions [22], together with accuracy and freshness, it is of utmost importance to provide mechanisms to measure and foster data completeness in collaborative KGs.
In that context, the Wikidata community has already endorsed a series of initiatives and tools that encourage efforts towards population completeness [24]. For instance, there are WikiProjects7 that aim at populating Wikidata with
bibliographic references, genes, or notable women.
With such a decentralized approach of independently-run data entry and im-port efforts, it has become very difficult to understand and measure what is still missing in Wikidata. While there is related work that measures the complete-ness of item descriptions in Wikidata (see Section 2), there is (to the best of our knowledge) no systematic approach to measure class completeness other than by manually checking for candidate entities and facts to be inserted in the KG. In this paper, we focus on the specific problem of estimating class com-pleteness in a collaborative KG and experimentally evaluate our methods over Wikidata. We limit our work to the family of finite classes, where the number of instances in such classes is fixed. We take a data-driven approach to that prob-lem by leveraging models from statistics and ecology used to estimate the size of species [4]. We propose methods to calculate the cardinality of classes and build estimates for the class convergence to the true value. We note that while we focus our empirical study on Wikidata, our proposed methodology is applicable to any other collaborative graph dataset with analogous characteristics, where the action log describing its evolution is available. By calculating the expected class cardinality, we are able to measure class completeness given the number of instances currently present in the KG for that class. We evaluate different class size estimation methods against classes whose sizes are known through trustworthy third-party sources (e.g., the number of municipalities in the Czech Republic) and for which a complete ground truth exists. We then apply these
5 Scholia https://tools.wmflabs.org/scholia/
6
Wikidata’s Notability https://www.wikidata.org/wiki/Wikidata:Notability
7
methods to other classes in order to generate completeness estimates for other parts of the KG.
The main contributions of this paper are as follows:
– We show how the edit history of a KG can be used to inform statistical methods adapted from species estimators (Section 3);
– We evaluate the effectiveness of statistical methods to estimate the class size and KG completeness based on repeated sampling (Section 4);
– We provide tools to make Wikidata end-users (both human and applications) aware of the incompleteness of many subparts in Wikidata (Section 4.4).
2
Related Work
Data Completeness In Knowledge Graphs is one of the most important data quality dimensions for Linked Data [24]; it has also been acknowledged as a key data quality indicator by the Wikidata community8. Different data cleaning
methods proposed by the research community have focused on different types of completeness. For example, ReCoin [1] measures the relative completeness that item descriptions have, compared to other items of the same type. It keeps track of used properties and encourages editors to add new statements and foster more homogeneous item descriptions. Gal´arraga et al. [9] investigate different signals to predict the completeness of relations in KGs. The work of Soulet et al. [17] introduces a method to estimate the lower bound of completeness in a KG. The completeness is estimated through the missing facts to reach a distribution according to Benfords Law. Kaffee et al. [12] study label completeness across languages. The work by Wulczyn et al. [23] encourages Wikipedia editors to write different language versions of existing articles. Tanon et al. [18] uses association rules to identify missing statements, while Darari et al. [6] provide means to describe and reason over RDF statement completeness. To complement these methods, in this paper we consider the problem of class completeness in the KG.
Cardinality Estimation In Databases Estimating the cardinality of a table in relational databases is key to query performance optimization. This requires a combination of database technology and statistical methods and allows to com-pute the cost of database operations that are then used for optimization strate-gies (e.g., storage allocation and data distribution) [13]. Similarly, cardinality estimation is key to optimize query execution in RDF triplestores. The key dif-ference with relational databases is the presence of many self-joins in queries over RDF data. This requires custom cardinality estimation techniques for SPARQL queries over RDF data [14]. In distributed databases, cardinality estimation is also a necessary step to optimize query execution. The key aspect is estimating the size of non-materialized views in a way that is accurate and provides statis-tical bounds [15]. Our work addresses the different problem of determining the cardinality of a class in a KG leveraging its edit history.
8
Wikidata Quality RFC https://www.wikidata.org/wiki/Wikidata:Requests_ for_comment/Data_quality_framework_for_Wikidata
Data Completeness in Crowdsourcing The problem of counting items and indi-viduals also arises in a crowdsourcing setting. Previous work [7] developed mod-els to estimate the size of the crowd in Amazon MTurk by taking into account the propensity of a worker to participate in an online survey or micro-tasks, respectively. That work used capture-recapture, a technique based on repeated observations of the same worker participating in tasks. In our class size estima-tion method, we estimate the size of data (not crowds) based on observaestima-tions made through another form of crowdsourcing, i.e., volunteering.
In a similar setting, Trushkowsky et al. [19] tackled the problem of enumer-ating the list of all instances in a specific class through paid crowdsourcing. The crowd workers were explicitly asked to provide a list of distinct items, for ex-ample, “input the list of all ice cream flavors”. Similar to our work, the authors used capture-recapture techniques but also had to deal with aspects unique to a crowdsourcing environment. For instance, they introduced a “pay-as-you-go” method to estimate the cost-benefit ratio of crowdsourcing additional tasks to complement the current list. They looked at both open-world and closed-world assumptions where the cardinality of the set is either known (e.g., “list of US states”) or unknown and possibly unbounded (e.g, “ice cream flavors”). Their methods are based on techniques borrowed from ecology research to count the number of animals of a certain species, which we describe next.
Species Richness Methods In the field of ecology and bio-statistics, several capture-recapture techniques have been proposed to estimate the number of existing species [2, 21]. The idea of capture-recapture is to draw a sample at random from a population and to estimate the number of unobserved items based on the frequency of the observed items. Such approaches work well for closed populations, but different techniques are required when we allow for open populations. Open vs. closed population problems have fundamentally different questions to answer. The former focus on estimating the rates of arrival and departure, the latter is about size and propensity of capture. We restrict our work to the realm of closed classes since it was shown that if a closed population method is utilized when in fact there is a process of arrival/departure, then closed estimators tend to overestimate. For example, the open-world-safe estimator “Chao92” [4] provides more accurate estimations when more evidence is available from a class. We present our results based on this and other estimators in Section 4.
In our work, we look at the problem of estimating the size of a given class (e.g., Volcanos) or composite classes (e.g., Paintings drawn by Vincent van Gogh) in Wikidata. We tap into the edit patterns of Wikidata volunteers [16], and apply capture-recapture techniques to estimate the completeness of a given class.
3
Class Completeness Estimators
In this section, we introduce the family of estimators we leverage to tackle the class estimation problem in collaborative KGs. First, we introduce the problem statement and the assumptions that we make in the context of Wikidata by defining the notion of class in Wikidata. Next, we introduce several statistical estimators ordered by complexity and show how they build upon each other. In this paper, we refer to entities as all the instances of a particular class e.g., “Cathedrals in Mexico”.
3.1 Problem Definition
Given a finite class C of instances IC = {I1, ..., IN}, our goal is to estimate
the number of instances of C i.e., N = |IC|. We note D the current count of
instances of a given class in the knowledge graph. A class is complete once D is equal to the true class size N .
The capture-recapture data collection protocol that we follow is based on n observations recorded during k successive sample periods. Each observation relates to a direct or indirect change made to an instance of a specific class during the sample period (i.e., one month). In practice, we extract mentions from the edits in the knowledge graph. An edit is a change that either adds, modifies or deletes a statement involving one or more entities. Every reference of an entity in the subject or object position of a statement defines a mention for the class that the mentioned entity belongs to. In the end, each mention is composed of an entity (also called instance because it belongs to a class), the class the instance belongs to, and a timestamp.
3.2 Interpreting Edit Activity Related to Classes
Given the edit history of a KG, we extract mentions as described in Listing 1.1: For every edit, we create a mention if one of the entities referenced belongs to a class. This is done on a per class basis.
Listing 1.1. Query on the Wikidata Graph illustrating the relation between edits and mentions on the example of the Single Domain class City (Q515). (The properties referenced with the edit prefix are not available in the public Wikidata endpoint.) S E L E C T ? i n s t a n c e ? t i m e s t a m p W H E R E { ? i n s t a n c e wdt : P31 / wdt : P 2 7 9 * wd : Q 5 1 5 . { ? m e n t i o n e d i t : s u b j e c t ? i n s t a n c e . } U N I O N { ? m e n t i o n e d i t : o b j e c t ? i n s t a n c e . } ? m e n t i o n e d i t : t i m e s t a m p ? t i m e s t a m p . }
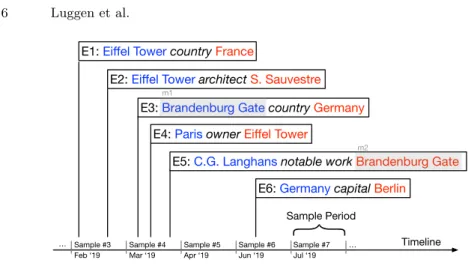
We show in Figure 1 how the mentions get aggregated per sample period on the overall timeline. In a given sample period, we count one observation per instance having at least one mention. With Xi being the frequency of
Timeline
{
Sample Period
E3: Brandenburg Gate country Germany
E1: Eiffel Tower country France
E4: Paris owner Eiffel Tower
E6: Germany capital Berlin
E5: C.G. Langhans notable work Brandenburg Gate
E2: Eiffel Tower architect S. Sauvestre
Sample #3 Feb ‘19 Sample #4 Mar ‘19 Sample #5 Apr ‘19 Sample #6 Jun ‘19 Sample #7 Jul ‘19 … … m1 m2
Fig. 1. The edits (Ei) of the Knowledge Graph (representing new edges) are leveraged
to identify mentions. The source and target of each edge are collected to create a mention from the entity involved. Sample period #4 contains 3 edits, in which we identify 6 mentions, from which we extract 2 observations for class monument (despite the 3 mentions of entities of that class because m1 and m2 are only counted once), 1
observation for class country, 1 observation for class city and 1 observation for class person.
observations relating to instance Ii, we compute the frequency of frequencies
fi =P N
j=11[Xj = i], for 1 ≤ i ≤ k. For example, f1 is the number of instances
observed only once (singletons), f2 is the number of instances observed twice
(doubletons) etc. With this notation, f0represents the number of instances that
we never observed and we seek to estimate. Each instance Ii ∈ IC of a given
class has a unique probability pi of being mentioned, withP pi= 1.
To be able to leverage the statistical techniques described below, the dis-tribution of classes among the observations is supposed to follow a stationary multinomial distribution with unknown parameter p1, ..., pN. This leads to the
following assumptions:
1. The classes of interest are closed and countable as of the beginning of the experiment;
2. The observations are independent events;
3. In a class, the observations are at random and “with replacement”;
4. The probability of observing an instance within a class does not change over time.
First, by assuming that classes are closed, we reduce the scope of the ques-tions we can answer. Tracking the changes (growth and shrinkage) of an open class such as “Events in Paris” or “Sitting Presidents” would require a different approach, data, and assumptions. Second, using a large number of edits made by different volunteers and scripts introduces a number of corner cases that we need to work with. It is for example possible to observe dependant actions, for
example: systematically adding “Name” followed by “Date of Birth” or editors correcting each other. While our assumption is a simplifying one, we have not observed any significant correlations in the edits. This stems from the fact that the volunteers are not restricted on which edits they perform and what entities or classes they need to focus on. The third assumption comes in contrast to the work in [19] where crowd workers were asked to list items that belong to a particular class. Hence, a given crowd worker is answering from a population of possible items (i.e., sampling “without replacement”). In our case, Wikidata editors can create edits which repeatedly mention the same entity in the context of their work. Finally, the fourth assumption is based on the fact that the ob-servations we make are created through indirect references and are not directly related to the classes themselves.
3.3 Non-parametric Estimators
The intuition behind the estimators that we consider is based on the frequency of edits involving entities of a given class. To estimate the true class size we consider non-parametric methods that primarily use the frequencies of observa-tions among instances. Non-parametric methods do not assume any probability distribution of pi among the instances of a given class.
Jackknife Estimators [Jack1] Jackknife (or “leave-one-out”) methods have been used to develop species richness estimators [11]. Similarly to k-fold cross validation, we use observations from k −1 periods by removing observations from one sample period from the data at a time and average the resulting pseudo-estimates made on each sub-fold. We write fi
1to denote the instances observed
only once in period i. We note that the number of distinct elements obtained when dropping period i becomes D−i= D − f1i.
We compute a pseudo estimate for each sub-sample of observations obtained by dropping the i − th period using ˆN−i = kD − (k − 1)D−i, and averaging
across k. A closed form of the first and second order Jackknife estimators is given by Eq. (1) and Eq. (2) respectively [3]. We observe that ˆNjack1 implies that the number of unseen instances is approximately the same as the number of singletons after a large number of sampling periods.
ˆ Njack1= D +k − 1 k f1 (1) ˆ Njack2= D +2k − 3 k f1− (k − 2)2 k(k − 1)f2 (2)
Sample Coverage and the Good-Turing Estimator [N1-UNIF] The fol-lowing methods are based on the concept of sample coverage which is a measure of sample completeness.
S =
N
X
Since the probabilities of observing the instances as well as the population size are unknown, a popular estimate of the sample coverage is given by the Good-Turing Estimator [10] Eq. (4). Effectively, this estimator relies on the comple-ment of the ratio of singletons among the sample data and as an indicator of true sample coverage. For example, if in past sample periods we have seen each instance only once, the probability of observing a new instance by collecting a new sample is 1. Conversely, if all the instances were seen more than once, i.e., f1= 0 the probability of seeing a new instance in a new sample is reduced to 0.
ˆ
S = 1 −f1
n (4)
If all instances have the same probability of being observed, the population size using the Good-Turing sample coverage is given by:
ˆ Nn1-unif=D ˆ S = D 1 − f1 n (5)
We draw the attention of the reader to the trade-off that singletons and popular instances create. Typically, frequency counts will be heavily unbalanced and will tend to over or under-estimate the true population size.
Singleton Outliers Reduction [SOR] To mitigate the effect of the singletons on a class, a popular approach is to threshold the number of singleton elements. Trushkowsky et al. [19] proposed to limit the number of singletons introduced by a given contributor to two standard deviations above the mean of singletons introduces by other workers. We adapt this method to our scenario by limiting the f1count to fall within two standard deviations above the mean. The rationale
behind our choice is to strike a balance between low and high dispersion of f1
frequencies with respect to the set F of all frequencies that we observe.
ˆ NSOR= D 1 − f˜1 n (6) with, ˜ f1= min n f1, 2σ + µ o µ = F X ∀j>1 fj |F | − 1 σ = v u u t F X ∀j>1 (fj− µ)2 |F | − 2 (7)
Abundance-based Coverage Estimator [Chao92] The work by Chao and Shen [4] (hereon chao92 ) uses the concept of sample coverage introduced above and assumes that the probabilities of capture can be summarized by their mean
i.e., ¯p = P pi/N = 1/N and their coefficient of variation (or γ) with γ2 =
[N−1P
i(pi− ¯pi)2]/¯p2.
However, since we do not have access to the probabilities pi and N , the
coefficient of variation is in turn estimated by using ˆNunif(via the Good-Turing estimator of sample coverage), and pi’s with the observed data and corresponding
fi. γ2= maxn ˆNunif k X i=1 i(i − 1)fi [n(n − 1)] − 1, 0 o (8)
The chao92 estimator is given by Eq. (9). We note that if the coefficient of variation is close the zero, the estimator reduces to Eq. (5) indicating an equiprobable scenario. Conversely, as γ grows, signaling more variability in the probabilities of capture, we add a factor proportional to the number of single-tons to the equiprobable estimate. We note that a high estimated coefficient of variation combined with a high number of singletons might result in significant overestimation. ˆ Nchao92=D ˆ S + n(1 − ˆS) ˆ S γ 2=D + f1γ2 ˆ S (9) 3.4 Evaluation Metrics
We evaluate the robustness and convergence of our estimators using the following metrics.
Error Metric To evaluate the performance of the estimators in a controlled setting, we leverage the error metric introduced in [19]. For reference, the φ error metric aims at capturing the bias of the estimates as the absolute distance from the ground truth, if available. The sample order weighs the bias terms, that is, more recent errors get penalized more heavily. Conducting such an evaluation requires the ground truth value of the class size N , as well as the estimates calculated on the time-ordered sample periods.
φ = Pk i=1 ˆ Ni− N i P i = 2Pk i=1| ˆNi− N | k(k + 1) (10)
Convergence Metric Conversely, we introduce a new metric ρ that aims at evaluating the convergence of a given estimate. This metric acts as the main measurement tool in a real scenario where we do not have access to the ground truth, e.g. when performing large-scale analyses of completeness across classes. The metric is derived from φ, as we look for stability and close distance between the estimate and the number D of distinct values. In contrast to the error metric, only the last w observed samples out of the full set of samples are used in the
convergence metric. The closer the metric is to zero, the more confident we are that the class has converged to its complete set.
ρ = Pk i=k−w | ˆNi−Di| Di w (11)
In the following section, we evaluate the presented estimators on a set of eight classes from Wikidata. We report our findings using the error and convergence metrics for the following estimators: Jack1 ( ˆNjack1)9, N1-UNIF ( ˆN
N1-UNIF), SOR
( ˆNSOR) and Chao92 ( ˆNchao92).
4
Experimental Evaluation
We discuss the results of an extensive experimental evaluation of the estimators introduced in Section 3 below, starting with the description of the dataset we used. We obtain the full edit history of the Knowledge Graph and collect the observations for all the classes we found in Wikidata. We then selected a sub-sample of classes for which we have meaningful characteristics regarding the number of observations spread over time. From this set, we randomly selected classes and searched for an independent authoritative source that reports their true cardinality. We set the sample period to 30 days, which results in at least one observation per sample period on most classes we selected. We use the last four samples (w = 4 which equals roughly 4 Months) of our results to calculate the convergence metric. Note that if an instance was not assigned the correct class we are not able to count it and we consider it as missing. This is a desirable effect since a declarative query on Wikidata requesting the full list of a class will not return such instances either.
4.1 Data
To evaluate our class completeness estimation methods, we use two different datasets from Wikidata: First, we use the entity graph, provided by the Wikidata JSON dumps as of Aug 18, 201810. The JSON dump contains the actual node descriptions and the edges between the nodes. Second, we use the edit history as of Oct 1, 2018 provided in the Wikibase XML Dump11. The edit history provides the list of all actions performed on the KG including the creation of new items, the update of labels and other values, as well as reverted edits12. For each action,
the XML dump provides the item changed, the user who made the change, the timestamp, a comment describing the action, and a pointer to the state of the graph before this action.
9 We do not report on Jack2 as it has been shown to over-estimate the population size
when the sample size is large [5], which we have experienced as well.
10JSON Dump: https://doi.org/10.5281/zenodo.3268725
11
Edit History: https://dumps.wikimedia.org/wikidatawiki/latest/
12
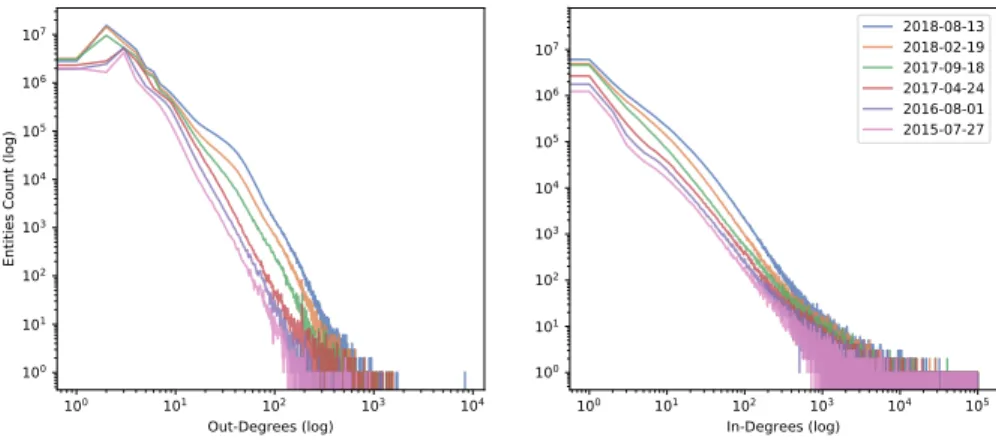
Dataset Description: Entity Degree Distribution To explore the charac-teristics of the dataset, we look at the graph as a whole (Fig. 2) and observe the constant overall growth of entities with different in and out-degrees at different points in time. 100 101 102 103 104 Out-Degrees (log) 100 101 102 103 104 105 106 107
Entities Count (log)
100 101 102 103 104 105 In-Degrees (log) 100 101 102 103 104 105 106 107 2018-08-132018-02-19 2017-09-18 2017-04-24 2016-08-01 2015-07-27
Fig. 2. The evolution of Wikidata: a temporal view on how the in- and out-degree distributions have evolved since the inception of the project.
Classes and Instances in the case of Wikidata Wikidata can be interpreted as an RDF graph [8], with a data model that differentiates between entities (including classes and instances) and properties. We define classes and instances in the Wikidata graph G = (V, E) as follows:
Single Domain Classes In Wikidata, edges with the explicit label EP 31:
in-stanceOf and EP 279: subclassOf explicitly define classes.13The target vertex Vt
which can be reached by following the edge with label EP 31: instanceOf from
the source vertex Vsare part of the classes C. Super classes collect all instances
of a class C which follow the edge EP 279: subclassOf once or multiple times.
Listing 1.2. Retrieves all instances of a specified single domain. S E L E C T ? i n s t a n c e
W H E R E { ? i n s t a n c e wdt : P31 / wdt : P 2 7 9 * wd : Q 5 1 5 . }
To extract all instances of class CQ515 : City we issue Query 1.2 against the
Wikidata endpoint.
13
Composite Classes We create composite classes by joining a class C on one or multiple properties E and their target instances V . As an example, we can join class CQ515: City with property EP 17: country and target VQ142: France on
the instances of CQ515. The result is a composite class of all Cities in France
CQ515./P 17,Q142.
Listing 1.3. Retrieves all instances of a composite class. S E L E C T ? i n s t a n c e
W H E R E { ? i n s t a n c e wdt : P31 / wdt : P 2 7 9 * wd : Q 5 1 5 . ? i n s t a n c e wdt : P17 wd : Q 1 4 2 . }
As an example, Query 1.3 selects instances from the aforementioned composite class CQ515./P 17,Q142.
Data preparation The massive size of the edit history made it impossible to extract all observations from a database efficiently. Thus, in a first step we pre-process the edit history. We select all edits involving at least two entities V which therefore could be used to extract observations. The resulting intermediate data provides more than 161 million edits containing the source entity Vs, the property
label of the connecting E, the target entity Vt, as well as the timestamp and the
user. In a second step, we pre-processed the JSON Dump into an in-memory graph to get fast access to all instances V and properties E (with property labels) of the Wikidata Graph. This gives us information on which entity V belongs to which class C. Finally, to extract the observations pointing to an entity, we join the Wikidata edits with the in-memory Graph.
We filter out the observations belonging to a specific class C by joining the observations pointing to an entity which in turn point to a class. The resulting data, grouped by class, consists of 370 million distinct observations.
4.2 Results
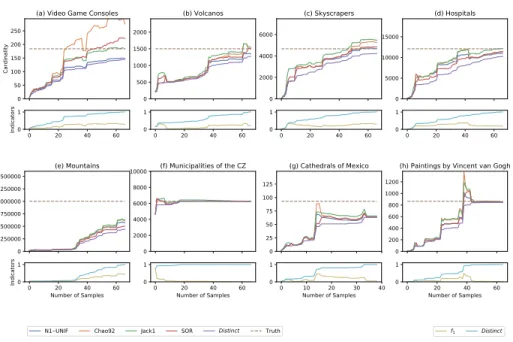
Figure 3 shows the results of the various estimators we consider. The top part of each plot represents the results of the estimators for a specific domain, as well as the lower bound given by the absolute number of distinct instances observed. The x-axis represents the number of sample periods that we obtain in chronological order to perform the class size estimation. At each sample period, we run an estimator using all the data samples collected so far. The dashed line indicates the ground truth size. The bottom part of each plot shows a comparison of two indicators: Distinct, the distinct number of instances up to the sample period and f1, the proportion of instances observed exactly once, both normalized to
the distinct number of instances retrieved in the end. These indicators are key to our methods and serve the purpose of explaining the behavior of each estimator with respect to the properties of the samples. In the following, we discuss these results and highlight key properties of each set of observations.
N1 UNIF Chao92 Jack1 SOR Distinct Truth f1 Distinct 0 50 100 150 200 250 Cardinality
(a) Video Game Consoles
0 20 40 60 0 1 Indicators 0 500 1000 1500 2000 (b) Volcanos 0 20 40 60 0 1 0 2000 4000 6000 (c) Skyscrapers 0 20 40 60 0 1 0 5000 10000 15000 (d) Hospitals 0 20 40 60 0 1 0 250000 500000 750000 1000000 1250000 1500000 Cardinality (e) Mountains 0 20 40 60 Number of Samples 0 1 Indicators 0 2000 4000 6000 8000 10000 (f) Municipalities of the CZ 0 20 40 60 Number of Samples 0 1 0 25 50 75 100 125 (g) Cathedrals of Mexico 0 10 20 30 40 Number of Samples 0 1 0 200 400 600 800 1000 1200
(h) Paintings by Vincent van Gogh
0 20 40 60
Number of Samples 0
1
Fig. 3. Estimators used on Single Domain (a)-(f) and Composite classes (g)-(h).
Size Estimates on Single Domain Classes First, we inspect the results of estimating the size of a class when the query involves a single class definition. The first five figures show incomplete classes. In Fig. 3(a) we show the results for the small-sized class Video Game Consoles (N = 184)14. We note how Chao92 is particularly intolerant to the small class size and overestimates. Fig. 3(b) shows the estimators for the class Volcanos (N = 1500)15. Figure Fig. 3(c), for Skyscrapers (N = 4669)16, shows a class that is almost complete. The
es-timators are overshooting, because the f1 on the available instances is high. In
Fig. 3(d) Hospitals (N = 12090)17, we observe how large classes also bring larger
numbers of observations. This in turn helps the estimators to get stable before completeness is reached. A massive class is represented with Fig. 3(e) Mountains (N = 1000809)18. We are aware that the ground truth, even if well researched
by the source, is still rather suggestive. Nevertheless, the estimators suggest that there are missing instances. Finally, Fig. 3(f) Municipalities of the Czech Repub-lic (N = 6258)19 shows a class which was complete early (around Sample 10).
All estimators slowly converge to the ground truth.
14 https://en.wikipedia.org/wiki/List_of_home_video_game_consoles 15 https://www.usgs.gov/faqs/how-many-active-volcanoes-are-there-earth 16 http://www.skyscrapercenter.com/ 17 https://gateway.euro.who.int/en/indicators/hfa_471-5011-number-of-hospitals/ 18 https://peakvisor.com/en/news/how_many_mountains_on_earth.html 19
https://www.oecd.org/regional/regional- policy/Subnational- governments- in- OECD- Countries-Key-Data-2018.pdf
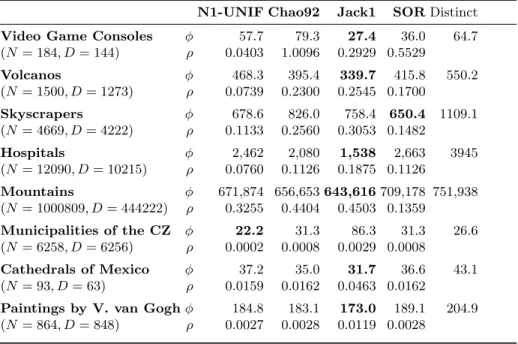
Table 1. Performance evaluation of the estimators compared to the lower bound of the count of distinct instances. For each estimator we report the error φ and the convergence ρ. Results in bold indicates the lowest error for a given estimator. N is the groundtruth and D is the number of distinct instances on the last sample.
N1-UNIF Chao92 Jack1 SOR Distinct
Video Game Consoles φ 57.7 79.3 27.4 36.0 64.7
(N = 184, D = 144) ρ 0.0403 1.0096 0.2929 0.5529 Volcanos φ 468.3 395.4 339.7 415.8 550.2 (N = 1500, D = 1273) ρ 0.0739 0.2300 0.2545 0.1700 Skyscrapers φ 678.6 826.0 758.4 650.4 1109.1 (N = 4669, D = 4222) ρ 0.1133 0.2560 0.3053 0.1482 Hospitals φ 2,462 2,080 1,538 2,663 3945 (N = 12090, D = 10215) ρ 0.0760 0.1126 0.1875 0.1126 Mountains φ 671,874 656,653 643,616 709,178 751,938 (N = 1000809, D = 444222) ρ 0.3255 0.4404 0.4503 0.1359 Municipalities of the CZ φ 22.2 31.3 86.3 31.3 26.6 (N = 6258, D = 6256) ρ 0.0002 0.0008 0.0029 0.0008 Cathedrals of Mexico φ 37.2 35.0 31.7 36.6 43.1 (N = 93, D = 63) ρ 0.0159 0.0162 0.0463 0.0162
Paintings by V. van Gogh φ 184.8 183.1 173.0 189.1 204.9
(N = 864, D = 848) ρ 0.0027 0.0028 0.0119 0.0028
Size Estimates on Composite Classes As composite classes are by definition a subset of instances, compared to single domain classes, the associated obser-vations can also drop to low numbers. Figure 3(g) shows such a case where the number of observations involving instances of a CQ2977./P 17,Q96 Cathedrals in
Mexico (N = 93)20 is n = 387. Figure Fig. 3(h) C
Q3305213./P 170,Q5582 Paintings
by Vincent van Gogh (T = 864)21 is an example which displays the
differ-ent phases of an estimator can encounter until class completeness. Starting by growing slowly at first with the addition of the first few elements. We observe intermittent overshooting when a large number of instances are added in a batch process. The final phase is a fast convergence towards the value of the ground truth.
Performance Evaluation For all our experiments, we computed the error and convergence metrics introduced in Section 3.4 to obtain quantitative mea-surements on how the estimators perform and how they can be used. Table 1 summarizes the evaluation results across all classes considered in our work. We observe that Jack1 and SOR consistently achieve the lowest error rate across all classes.
20
https://en.wikipedia.org/wiki/List_of_cathedrals_in_Mexico 21
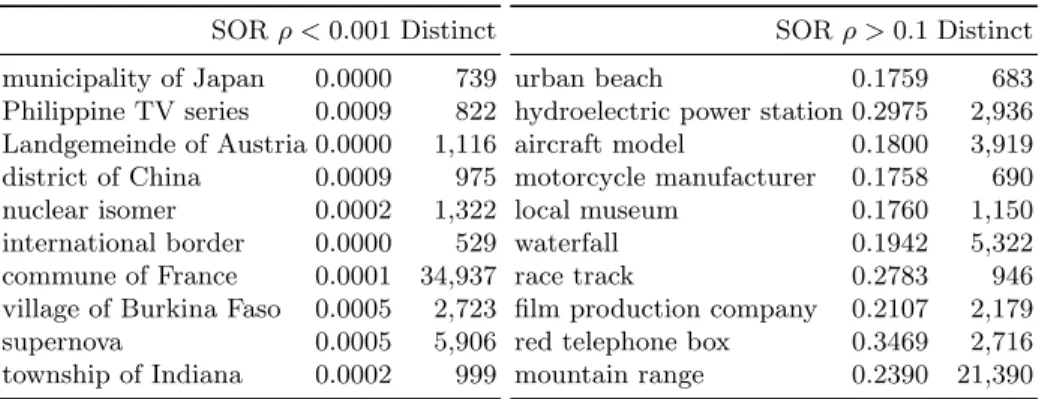
Table 2. Lists of 10 randomly picked examples. Left with a low ρ suggesting a complete class, and right a high ρ suggesting an incomplete class.
SOR ρ < 0.001 Distinct municipality of Japan 0.0000 739 Philippine TV series 0.0009 822 Landgemeinde of Austria 0.0000 1,116 district of China 0.0009 975 nuclear isomer 0.0002 1,322 international border 0.0000 529 commune of France 0.0001 34,937
village of Burkina Faso 0.0005 2,723
supernova 0.0005 5,906
township of Indiana 0.0002 999
SOR ρ > 0.1 Distinct
urban beach 0.1759 683
hydroelectric power station 0.2975 2,936
aircraft model 0.1800 3,919
motorcycle manufacturer 0.1758 690
local museum 0.1760 1,150
waterfall 0.1942 5,322
race track 0.2783 946
film production company 0.2107 2,179
red telephone box 0.3469 2,716
mountain range 0.2390 21,390
4.3 Discussion
Our experimental results unveiled key properties in terms of the sensitivity and conditions under which some estimators perform better than others. Generally speaking, all estimators beat the lower bound of distinct numbers in the error metric φ. The exception is the class (Municipalities of the CZ) which converged early on, and for which N1-UNIF still beats the error of the distinct values. However, the other estimators lose against the lower bound (distinct) in this example on the number of instances because they over estimate the class size in the early samples before the class reaches completeness. We observe that more conservative estimators N1-UNIF, Chao92 perform worse then Jack1 and SOR for incomplete classes, which is why we recommend the last two in the end for the estimation of the class size. The convergence metric can be used as an indicator to distinguish complete from incomplete classes without requiring the knowledge of the real class size. In Table 1, we see how the convergence metrics ρ are low (< 0.001) for complete classes. On the other hand for incomplete classes ρ is comparatively high (> 0.1). Table 2 lists ten randomly-picked classes, along with the convergence on SOR and the number of distinct instances, for a low and high ρ values suggesting complete and incomplete classes respectively. These lists illustrate how our convergence metric can be leveraged to identify gaps in the KG.
4.4 Additional Material and Tools
The results on all classes in Wikidata are available at http : / / cardinal . exascale . info. We also release our Python code imple-menting the data processing pipeline, all estimators and metrics as an open source package22. This includes tools to seek for incomplete classes based on
the convergence metric. Finally, we provide the pre-processed data at every step of the processing pipeline, as well as the final results for each dataset.
22
5
Conclusions and Future Work
In this work, we introduced a methodology to estimate class sizes in a collabo-rative KG and evaluated it over Wikidata. We showed how collabocollabo-rative editing dynamics create a trove of information that can be mined to extract informa-tion about data access, edits, data linkage, and overall graph growth. We relied on the edit history over six years of activity in Wikidata to collect capture-recapture observations related to a particular entity within the class of interest. We reviewed, applied, and evaluated a battery of non-parametric statistical tech-niques that leverage frequency statistics collected from the data to estimate the completeness of a given class.
Our experimental results show that many estimators yield accurate estimates when provided with enough observations that reflect the actual underlying dis-tribution of the instances of a class. However, some estimators like Chao92 tend to be less robust to bursts of newly discovered instances. Finally, based on our re-sults, we provided a set of practical recommendations to use convergence metric in conjunction with estimators to decide whether a particular class is complete or to perform large-scale completeness analyses. Our work has direct implica-tions for both Wikidata editors and data consumers. We can provide convergence statistics on the estimated class completeness by domains to point to knowledge gaps. Such statistics could aid newcomers, who often feel insecure about what to edit, to decide what to contribute or what to focus on.
In future work, we plan to leverage statistics on page views showing the at-tention that specific groups of items receive within the KG to inform estimators. We would also like to develop parametric models that assume a particular edit probability distribution. This is especially applicable to domains with a consid-erable bias towards popular entities such as Humans and Musicians. Another area of potential development is the usage of completeness estimators to detect systematic errors in Wikidata: While exploring the data, we have observed many cases of misclassification, which we conjecture as being the result of the growing complexity of the Wikidata ontology that includes more than forty thousand classes at the time of writing.
6
Acknowledgements
This project has received funding from the European Research Council (ERC) under the European Union’s Horizon 2020 research and innovation programme (grant agreement 683253/GraphInt). It is also supported by the Australian Re-search Council (ARC) Discovery Project (Grant No. DP190102141).
References
1. Balaraman, V., Razniewski, S., Nutt, W.: Recoin: Relative completeness in wiki-data. In: Companion Proceedings of the The Web Conference. pp. 1787–1792 (2018)
2. Bunge, J., Fitzpatrick, M.: Estimating the number of species: a review. Journal of the American Statistical Association 88(421), 364–373 (1993)
3. Burnham, K.P., Overton, W.S.: Robust estimation of population size when capture probabilities vary among animals. Ecology 60(5), 927–936 (1979)
4. Chao, A., Lee, S.M.: Estimating the number of classes via sample coverage. Journal of the American statistical Association 87(417), 210–217 (1992)
5. Chiu, C.H., Wang, Y.T., Walther, B.A., Chao, A.: An improved nonparametric lower bound of species richness via a modified good–turing frequency formula. Biometrics 70(3), 671–682 (2014)
6. Darari, F., Nutt, W., Pirr`o, G., Razniewski, S.: Completeness management for rdf data sources. ACM Trans. Web 12(3), 18:1–18:53 (2018)
7. Difallah, D., Filatova, E., Ipeirotis, P.: Demographics and dynamics of mechanical turk workers. In: WSDM. pp. 135–143. ACM (2018)
8. Erxleben, F., G¨unther, M., Kr¨otzsch, M., Mendez, J., Vrandecic, D.: Introducing wikidata to the linked data web. In: ISWC. pp. 50–65 (2014)
9. Gal´arraga, L., Razniewski, S., Amarilli, A., Suchanek, F.M.: Predicting complete-ness in knowledge bases. In: WSDM. pp. 375–383 (2017)
10. Good, I.J.: The population frequencies of species and the estimation of population parameters. Biometrika 40(3-4), 237–264 (1953)
11. Heltshe, J.F., Forrester, N.E.: Estimating species richness using the jackknife pro-cedure. Biometrics pp. 1–11 (1983)
12. Kaffee, L., Simperl, E.: The human face of the web of data: A cross-sectional study of labels. In: SEMANTICS. pp. 66–77 (2018)
13. Mannino, M.V., Chu, P., Sager, T.: Statistical profile estimation in database sys-tems. ACM Comput. Surv. 20(3), 191–221 (1988)
14. Neumann, T., Moerkotte, G.: Characteristic sets: Accurate cardinality estimation for rdf queries with multiple joins. In: ICDE. pp. 984–994. IEEE (2011)
15. Papapetrou, O., Siberski, W., Nejdl, W.: Cardinality estimation and dynamic length adaptation for bloom filters. Distributed and Parallel Databases 28(2-3), 119–156 (2010)
16. Sarasua, C., Checco, A., Demartini, G., Difallah, D., Feldman, M., Pintscher, L.: The evolution of power and standard wikidata editors: Comparing editing behavior over time to predict lifespan and volume of edits. Computer Supported Cooperative Work (CSCW) (2018)
17. Soulet, A., Giacometti, A., Markhoff, B., Suchanek, F.M.: Representativeness of knowledge bases with the generalized benford’s law. In: ISWC. pp. 374–390 (2018) 18. Tanon, T.P., Stepanova, D., Razniewski, S., Mirza, P., Weikum, G.:
Completeness-aware rule learning from knowledge graphs. In: ISWC. pp. 507–525 (2017) 19. Trushkowsky, B., Kraska, T., Franklin, M.J., Sarkar, P.: Crowdsourced
enumera-tion queries. In: ICDE. pp. 673–684. IEEE (2013)
20. Vrandeˇci´c, D., Kr¨otzsch, M.: Wikidata: A free collaborative knowledgebase. Com-munications of the ACM 57(10), 78–85 (2014)
21. Walther, B., Morand, S.: Comparative performance of species richness estimation methods. Parasitology 116(4), 395–405 (1998)
22. Wang, R.Y., Strong, D.M.: Beyond accuracy: What data quality means to data consumers. Journal of Management Information Systems 12(4), 5–33 (1996) 23. Wulczyn, E., West, R., Zia, L., Leskovec, J.: Growing wikipedia across languages
via recommendation. In: WWW. pp. 975–985 (2016)
24. Zaveri, A., Rula, A., Maurino, A., Pietrobon, R., Lehmann, J., Auer, S.: Quality assessment for Linked Data: A survey. Semantic Web Journal (2015)