HAL Id: hal-00297180
https://hal.archives-ouvertes.fr/hal-00297180
Submitted on 1 Aug 2006
HAL is a multi-disciplinary open access
archive for the deposit and dissemination of
sci-entific research documents, whether they are
pub-lished or not. The documents may come from
teaching and research institutions in France or
abroad, or from public or private research centers.
L’archive ouverte pluridisciplinaire HAL, est
destinée au dépôt et à la diffusion de documents
scientifiques de niveau recherche, publiés ou non,
émanant des établissements d’enseignement et de
recherche français ou étrangers, des laboratoires
publics ou privés.
absorption ozone monitors in a polluted urban
environment
E. J. Dunlea, S. C. Herndon, D. D. Nelson, R. M. Volkamer, B. K. Lamb, E.
J. Allwine, M. Grutter, C. R. Ramos Villegas, C. Marquez, Stéphane Blanco,
et al.
To cite this version:
E. J. Dunlea, S. C. Herndon, D. D. Nelson, R. M. Volkamer, B. K. Lamb, et al.. Technical note:
Evalu-ation of standard ultraviolet absorption ozone monitors in a polluted urban environment. Atmospheric
Chemistry and Physics, European Geosciences Union, 2006, 6 (10), pp.3163-3180. �hal-00297180�
www.atmos-chem-phys.net/6/3163/2006/ © Author(s) 2006. This work is licensed under a Creative Commons License.
Chemistry
and Physics
Technical note: Evaluation of standard ultraviolet absorption ozone
monitors in a polluted urban environment
E. J. Dunlea1,*, S. C. Herndon2, D. D. Nelson2, R. M. Volkamer1, B. K. Lamb3, E. J. Allwine3, M. Grutter4, C. R. Ramos Villegas5, C. Marquez6, S. Blanco6, B. Cardenas6, C. E. Kolb2, L. T. Molina1, and M. J. Molina1 1Department of Earth, Atmospheric and Planetary Sciences, Massachusetts Institute of Technology, Bldg. 54, 77
Massachusetts Ave, Cambridge, MA 02139, USA
2Aerodyne Research Inc., 45 Manning Road, Billerica MA 01821-3876, USA
3Laboratory for Atmospheric Research, Department of Civil and Environmental Engineering, Washington State University,
101 Sload Hall, Spokane Street, Pullman, WA 99164-2910, USA
4Centro de Ciencias de la Atm´osfera, UNAM, Ciudad Universitaria, 04510 Mexico City, Mexico
5Gobierno del Distrito Federal, Agricultura 21, Piso 1, Col. Escandon, Del. M. Hidalgo, CP 11800, Mexico, D.F., Mexico 6Centro Nacional de Investigacion y Capacitacion Ambiental-INE, Av. Perif´erico 5000, Col. Insurgentes Cuicuilco, CP
04530, Mexico, D.F. Mexico
*now at: University of Colorado at Boulder, Cooperative Institute for Research in Environmental Sciences, UCB 216,
Boulder, CO 80309, USA
Received: 5 December 2005 – Published in Atmos. Chem. Phys. Discuss.: 4 April 2006 Revised: 20 July 2006 – Accepted: 26 July 2006 – Published: 1 August 2006
Abstract. The performance of the EPA Federal Equivalent
Method (FEM) technique for monitoring ambient concentra-tions of O3via ultraviolet absorption (UV) has been
evalu-ated using data from the Mexico City Metropolitan Area field campaign (MCMA-2003). Comparisons of UV O3
moni-tors with open path Differential Optical Absorption Spec-troscopy (DOAS) and open path Fourier Transform Infrared (FTIR) spectroscopy instruments in two locations revealed average discrepancies in the measured concentrations be-tween +13% to –18%. Good agreement of two separate open path DOAS measurements at one location indicated that spa-tial and temporal inhomogeneities were not substanspa-tially in-fluencing comparisons of the point sampling and open path instruments. The poor agreement between the UV O3
moni-tors and the open path instruments was attributed to incor-rect calibration factors for the UV monitors, although in-terferences could not be completely ruled out. Applying a linear correction to these calibration factors results in excel-lent agreement of the UV O3monitors with the co-located
open path measurements; regression slopes of 0.94 to 1.04 and associated R2 values of >0.89. A third UV O3
mon-itor suffered from large spurious interferences, which were attributed to extinction of UV radiation within the monitor by fine particles (<0.2 µm). The overall performance of this
Correspondence to: E. J. Dunlea
particular monitor was poor owing to a combination of in-terferences from a contaminated particle filter and/or ozone scrubber. Suggestions for improved operation practices of these UV O3monitors and recommendations for future
test-ing are made.
1 Introduction
Ozone (O3)often serves as the benchmark for the overall
pollution level of a given airshed and has been designated as a “criteria pollutant” by the United States Environmen-tal Protection Agency (U.S. EPA). The costs of reducing O3
pollution are estimated in the billions of dollars (Leston et al., 2005). For example, a report by the Instituto Nacional de Ecolog´ıa (INE) in Mexico (McKinley et al., 2003) found that the implementation of several control measures could achieve a 3% reduction in daily maximum ozone concentra-tion at the cost of approximately two billion dollars. Regu-latory action is initiated by the U.S. EPA when measured O3
concentrations in an urban area exceed a certain threshold (see Reynolds et al., 2004, for recent discussion of one-hour and eight-hour averaged daily maxima standards); this is re-ferred to as “non-attainment”. Hundreds of U.S. counties are either close to the threshold or already in non-attainment, and it has been suggested that up to half of the non-attainment
counties in the U.S. have O3concentrations in excess of the
threshold as a result of measurement interferences (Leston et al., 2005).
The improvement of monitoring of O3and its precursors
was mandated by the 1990 Clean Air Act Amendments (Sec-tion 182 (c) (1)) (Demerjian, 2000). The U.S. EPA has de-veloped recommendations for standard measurement tech-niques and calibration practices (Environmental Protection Agency, 1998; Paur and McElroy, 1979) to ensure the qual-ity of measurements for the criteria pollutants. The Federal Reference Method (FRM) for O3 is a gas-phase
ethylene-chemiluminescence detector, however, by far the most com-mon technique for determining the ambient concentration of O3 is ultra-violet absorption (UV O3 monitor), which has
been designated as a Federal Equivalent Method (FEM). In-deed, UV O3monitors account for almost all of the UV
mon-itoring in the U.S. (Leston et al., 2005). Monmon-itoring net-works in other countries have also adopted UV O3monitors
making them the most ubiquitous instruments for O3
mon-itoring worldwide. Due to the importance of measuring O3
and the widespread use of UV O3monitors, it is critical that
this measurement technique be accurate, precise, and well-characterized.
The technique of UV absorption measurement of O3has
been described elsewhere (Proffitt and McLaughlin, 1983) and only a brief description is included here. Advantages of the UV absorption technique include its relatively low cost and overall reliability. UV O3 monitors employ
mer-cury (Hg) lamps as reliable sources of line UV radiation at 253.65 nm, corresponding closely to the peak in the O3cross
section (Sander et al., 2002). A typical UV O3monitor
uti-lizes an ozone-specific scrubber, often manganese dioxide (MnO2)on a substrate or heated silver wool, to create an
ozone-free air flow for reference. The UV radiation inten-sity passing through this reference flow is compared to that through a flow of ambient air and the number density of O3
is determined by the straightforward Beer-Lambert absorp-tion equaabsorp-tion, which depends on the well-known absorpabsorp-tion cross section of the O3molecule at 253.65 nm (Sander et al.,
2002). Scattering or absorption of UV radiation by ambient aerosols is typically prevented by a 5.0 µm Teflon particle filter placed in the inlet to the UV O3 monitor. These
fil-ters must be changed frequently to prevent a buildup of ma-terials which might then catalyze the breakdown of O3 on
the filter or release compounds that could absorb UV radia-tion. These monitors are routinely calibrated by generating a known amount of O3via UV photolysis of molecular oxygen
in dried/clean air, often ambient air passed through a desic-cant and a charcoal filter.
Possible interferences in this measurement technique have been summarized in several recent reviews (Cavanagh and Verkouteren, 2001; Demerjian, 2000; Environmental Pro-tection Agency, 1993; McClenny et al., 2002; Parrish and Fehsenfeld, 2000; Sickles, 1992). Overall, previous evaluations of the performance of UV O3 monitors have
yielded mixed results. Several studies have shown ade-quate performance of UV O3monitors in comparison to
NO-chemiluminescence (Ryerson et al., 1998) and spectroscopic (Stevens et al., 1993) instruments (note: neither technique is a FEM method). Alternatively, a number of studies have shown interferences due to scattering of UV radiation by fine particles within the instrument (Arshinov et al., 2002; Leston and Ollison, 2000) and anomalous sensitivity of the man-ganese dioxide scrubbers to ambient water vapor, causing a discrepancy compared with calibrations typically performed with dry gas (ASTM, 2003; Butcher and Ruff, 1971; Ca-vanagh and Verkouteren, 2001; Leston et al., 2005; Maddy, 1999; Parrish and Fehsenfeld, 2000). Aromatic hydrocar-bons and oxidized or nitrated aromatics are known to ab-sorb UV radiation and are the most likely to be present in sufficient quantities in an urban environment to potentially contribute to this type of interference (Cavanagh and Verk-outeren, 2001; Grosjean and Harrison, 1985; Hudgens et al., 1994; Kleindienst et al., 1993; Leston et al., 2005). Overall, there is still a need for field intercomparisons of these UV O3
monitors, particularly intercomparisons done in urban loca-tions with high O3concentrations typical of non-attainment
conditions (Parrish and Fehsenfeld, 2000).
This study aims to evaluate the performance of several standard UV O3monitors during a field measurement
cam-paign in Mexico City during spring of 2003. The Mexico City Metropolitan Area field campaign (MCMA-2003) fea-tured a comprehensive suite of both gas and particle phase strumentation from numerous international laboratories, in-cluding multiple measurements of O3. We utilize this unique
data set to assess the performance of these standard monitors in a heavily polluted urban atmosphere, examine possible in-terferences and make recommendations for advances in test-ing and operation of these monitors that should be pursued.
2 Measurements
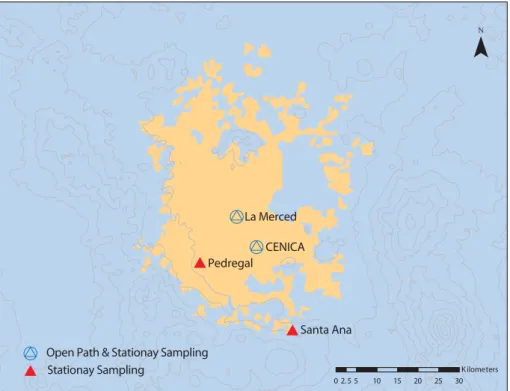
Figure 1 provides a map of the MCMA with the locations of the various sites from which measurements will be presented. A more complete description of the MCMA-2003 field cam-paign is given elsewhere (de Foy et al., 2005a, b; Molina and Molina, 2006). Details of the O3measurements made at
each location are presented in Table 1 and described below; we briefly introduce the sites here. “CENICA”, where the campaign was headquartered, receives a mix of fresh pollu-tion from area traffic corridors and aged pollupollu-tion from more downtown locations. The “La Merced” site is located very near a busy roadway and the La Merced marketplace. The “Pedregal” site is located at an elementary school in an af-fluent residential neighborhood west of the city center. As a downwind receptor site, Pedregal often has the highest ozone readings in the city. The “Santa Ana” site is located in the small town of Santa Ana just outside of Mexico City to the southwest and up on a mountain ridge above the Mexico City
Fig. 1. Map of the Metropolitan Mexico City Area (MCMA). The figure shows the urbanized sections of the city in shaded orange, along with the key topographic contours (grey). The names and locations of the fixed sites described in this work are marked on the map. The open triangles represent points where either the CENICA open path systems or the UNAM open path were located. The filled triangles describe the sites where the Mobile Laboratory was co-located with the stationary sampling O3monitors. See text (Sect. 2) for a description of the
neighborhood and character of each site.
basin floor. Mexico City is surrounded on three sides by mountains (east, south and west); Santa Ana is close to the southern gap in the mountains at Amecameca and receives mostly aged urban air during the day and rural air overnight. The ozone data measured by various instruments located at these sites form the basis of this evaluation; details on these instruments are listed in Table 1.
2.1 CENICA
The “supersite” for the MCMA-2003 campaign was located at the headquarters building of the Centro Nacional de In-vestigacion y Capacitacion Ambiental (CENICA) and in-cluded a comprehensive suite of both gas phase and aerosol instrumentation from a number of Mexican, American and European institutions (de Foy et al., 2005a, b; Molina and Molina, 2006). The two-story CENICA building is lo-cated on the Iztapalapa campus of the Universidad Aut´onoma Metropolitana (UAM), to the southeast of the city cen-ter (see Fig. 1). For the MCMA-2003 campaign, two re-search grade long path Differential Optical Absorption Spec-troscopy (DOAS) instruments and a research grade long path Fourier Transform Infrared (FTIR) spectrometer were in-stalled on the rooftop of the CENICA building and were operated by groups from the Massachusetts Institute for
Technology (MIT) and Chalmers University of Technology (CTH) respectively. The DOAS technique has been de-scribed elsewhere (Platt, 1994). In brief, light from a broad-band UV/vis lightsource (Xe-short arc lamp) is projected into the open atmosphere onto a distant array of retro re-flectors, which folds the lightpath back into the instrument where spectra are recorded using a Czerny-Turner type spec-trometer coupled to a 1024-element PDA detector. For the MCMA-2003 campaign, the DOAS-1 light path was directed towards an antenna tower in a south-easterly direction with a 430 m path length (total 860 m). The DOAS-2 lightpath was directed towards a local hill side of Cerro de la Estrella in a south-westerly direction with a 2.21 km path length (total 4.42 km). Both LP-DOAS instruments measured O3among
other species (Volkamer et al., 1998, 2005b) using ozone’s unique specific narrow-band (<5 nm) absorption structures between 252–262 nm 1) and 325–358 nm (DOAS-2). Temperature dependent absorption cross-sections (Bass and Paur, 1981) for 293 K and 313 K were convoluted to match the spectral resolution of the instruments, and fitted simultaneously with other trace-gas reference spectra and a fifth order polynomial high-pass filter to account for broad-band molecule and aerosol extinction using non-linear least squares fitting routines (Fayt and van Roozendael, 2001; Stutz and Platt, 1996). The detection limits for O3 were
Table 1. Description of relevant details for various O3instruments employed during this study. See text for further descriptions of site
locations.a= Applicable to UV monitors only.
Site Instrument Type Sampling
height
Distance from Roadway
Scrubber typea Absorption cell materiala
CENICA DOAS-1 Open Path 16 m Spanned several
minor roadways
– –
DOAS-2 Open Path 70 m Spanned several
major roadways
– –
FTIR Open Path 16 m Spanned several
minor roadways
– –
UV Monitor (Advanced Pollution Instruments (API) 400)
Point Sampling 15 m 1000 m (minor roadway) 1500 m (major roadway) Heated silver wool (12W, operating temp = 70◦C) Quartz tube and windows
La Merced FTIR Open Path 20 m 40 m (major
roadway)
– –
DOAS Open Path 20 m 40 m (major
roadway)
– –
UV Monitor (Advanced Pollution Instruments (API) 400)
Point Sampling 6 m 10 m (major roadway)
Unheated MnO2 Quartz tube
and windows Pedregal UV Monitor (Advanced
Pollution Instruments (API) 400)
Point Sampling 4 m 300 m (major roadway)
Unheated MnO2 Quartz tube and windows Santa Ana UV Monitor (Thermo
Envi-ronmental (TECO) 49-C)
Point Sampling 3 m 600 m (minor roadway)
Unheated MnO2 Aluminum
coated with Kymar; Quartz win-dows ARI Mobile Lab UV Monitor (Thermo
Envi-ronmental (TECO) 49-003)
Point Sampling 2.4 m or 5 m
– Unheated MnO2 Aluminum
coated with Kymar; Quartz win-dows
1.3 ppb for DOAS-1 and 5.0 ppb for DOAS-2. This signifi-cantly smaller detection limit of DOAS-1 reflects an approx-imately 20 times larger differential absorption cross section in the wavelength range used by this system. This potential for much more sensitive ozone measurements is partly offset by increasing light extinction from Rayleigh- and Mie scat-tering at shorter wavelengths, which limits attainable absorp-tion pathlengths and thus detecabsorp-tion limits. Also, the broad-band light absorption from O3in the Hartley band reduces
the transparency of the atmosphere and may increase pho-ton shot-noise in the spectra. Moreover, different straylight sources gain relative importance in this wavelength range, and need to be corrected for. Finally, the atmospheric oxy-gen absorption features in the Herzberg band-systems need to be eliminated carefully to allow for highly accurate measure-ments of ozone by DOAS. We have overcome all the above limitations following the procedure described in Volkamer et al. (1998).
The open-path FTIR system was operated parallel to the DOAS-1 lightpath sampling nearly identical airmasses (same length light path, <2 m apart). The FTIR consisted of a medium resolution (1 cm−1)spectrometer (Bomem MB104) coupled to a homemade transmitting and receiving telescope, and provided CO data (among other species) with 5 min in-tegration time. Spectra were analyzed using the latest HI-TRAN database cross sections (Rothman et al., 2003) and a nonlinear fitting algorithm (Samuelsson et al., 20051). The detection limit for the FTIR system was 10 ppb.
In addition to the equipment installed for the MCMA-2003 campaign, CENICA maintains a monitoring station located on the roof of its headquarters building, which includes a standard UV O3 monitor (detection limit 3 ppb). This UV
O3monitor was calibrated on the same afternoon and via the
same standard method as the one on board the ARI Mobile
1Samuelsson, J., Galle, B., and Mellqvist, J.: personal
Lab (see Sect. 2.3). The measured values from this monitor were within 7% of the calibration values, such that the moni-tor was deemed to be working acceptably and no adjustments were made at that time.
2.2 La Merced, Pedregal and Santa Ana
Another featured component of the MCMA-2003 campaign was a measurement site located downtown near the La Merced marketplace; the site is located in close proxim-ity to a busy roadway and <500 m from major bus station (TAPO). This site and instrumentation have been described in detail elsewhere (Grutter et al., 2003); briefly, researchers from Universidad Nacional Aut´onoma de M´exico (UNAM) operated two open path remote sensing instruments: one re-search grade FTIR and one commercial DOAS system (Opsis AR500). The light paths were run side-by-side between the rooftops of two four-story buildings and were 426 m long. O3
was measured by both FTIR and DOAS in addition to numer-ous other compounds; the detection limit for O3by the FTIR
technique was better than 2 ppb (Grutter et al., 2003) and em-ploys the latest HITRAN database cross sections (Rothman et al., 2003). A previous comparison of the O3reported at La
Merced by this DOAS and the more reliable FTIR instrument (Grutter and Flores, 2004) presented a very high correlation (R2=0.99). However, in this study the absolute concentration by the DOAS was consistently lower than that from the FTIR and a correction to the DOAS results was applied accordingly (Flores et al., 2004). The reason for this is unclear and unfor-tunately, any further discussion of this data is only possible to a very limited extent, as the evaluation procedure employed by the DOAS manufacturer is not clear to us. The open path spectroscopic measurements are dependent on knowledge of the absorption cross section for the molecule being detected. Recent studies have shown that the infrared cross sections of O3from the HITRAN database, upon which the FTIR open
path measurements depend, are up to 5% too large (Picquet-Varrault et al., 2005). Although using this information could bring the comparisons shown below in Sect. 3.2 with the UV O3monitor into better agreement, it would only partially
ex-plain the observed differences of more than 10%, so is not considered important.
The UNAM instruments were in close proximity (<30 m) to a monitoring station operated by Red Autom´atica de Mon-itoreo Ambiental (RAMA, 2005). RAMA operates 32 mon-itoring sites around the Mexico City metropolitan area, 20 of which are equipped with standard UV O3 monitors,
in-cluding the La Merced location. The RAMA network has been audited by the U.S. EPA (Environmental Protection Agency, 2003), and was concluded to be “accurate and well-implemented”. In particular, the O3audit data “were of
out-standing quality with no significant bias or imprecision de-tected across all stations and concentrations audited.”
The Pedregal site also housed a RAMA monitoring sta-tion including a UV O3monitor. At the Santa Ana site,
re-searchers from CENICA operated a monitoring station that included several criteria pollutant monitors including a UV O3monitor. Details on these monitors are presented in
Ta-ble 1.
2.3 Aerodyne mobile laboratory
Another major component of the MCMA-2003 campaign was the Aerodyne Research, Inc. Mobile Laboratory (ARI Mobile Lab), a van equipped with a comprehensive suite of research grade gas and particle phase instrumentation (Kolb et al., 2004), including a UV O3monitor. The ARI Mobile
Lab was operated in two modes interspersed throughout the five weeks of the MCMA-2003 field campaign – mobile and stationary modes (Kolb et al., 2004). The goals of the mo-bile mode were to follow specific vehicles to measure their on-road emission ratios and to map out the influence of sta-tionary emission sources. In stasta-tionary mode, the ARI Mo-bile Lab visited the three locations within Mexico City listed in Sect. 2.2 and made continuous measurements at each lo-cation for several days in a row. Additionally, the ARI Mo-bile Lab spent a majority of the nights and several full days during the five week field campaign in the parking lot ad-jacent to the CENICA building (Sect. 2.1). All instruments included in this study sampled ambient air from the main in-let line of the mobile lab. When moving, this inin-let sampled from in the front of the mobile lab at a height of 2.4 m above the road surface, protruding 1.2 m from the front bulkhead above the driver seat, resulting in a typical minimum hori-zontal distance between the inlet and a chased vehicle of at least several meters (Shorter et al., 2005). While stationary, an extension was added to the inlet to sample from a height of 5 m above the ground. Measured and calculated lag times for all instruments were short (<10 s) and agreed within 15% (Herndon et al., 2005).
The UV O3 monitor on board the ARI Mobile Lab was
calibrated near the beginning of the field campaign via the EPA standard method by RAMA technicians for continuity of comparisons with RAMA monitors, as all UV O3
mon-itors in the RAMA network are routinely calibrated by this method (RAMA, 2005). This calibration procedure involved the use of a charcoal filter for the production of O3free air in
which a known amount of O3is generated by the photolysis
of O2at 185 nm. The performance of the O3generator was
tracked by the use of a reference O3 monitor maintained in
pristine condition in a laboratory. Additionally for the ARI Mobile Lab UV O3 monitor, zero checks were performed
several times throughout the campaign by placing a charcoal filter in front of inlet to remove ambient O3; the resulting
readings were always near zero (between −4 and 2 ppb). The detection limit for this UV O3monitor was 2 ppb.
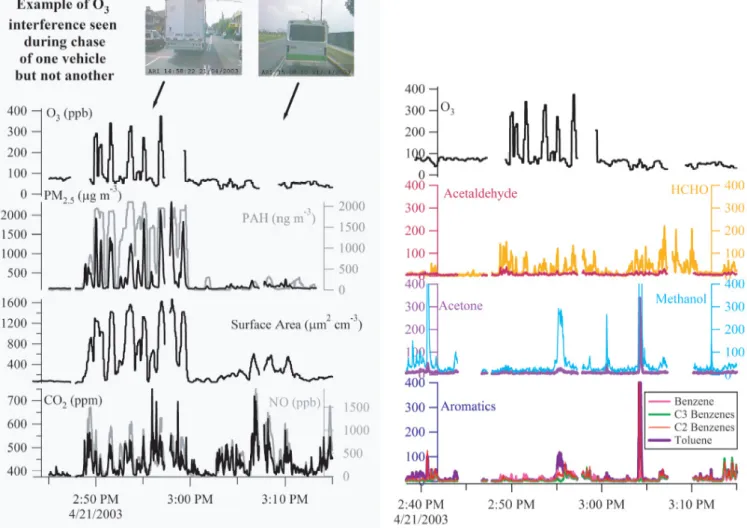
Fig. 2. Two time series showing an interference problem for the O3instrument on board the ARI Mobile Lab while chasing two separate
vehicles. Panels (a) and (b) show same time period with different compounds displayed on each panel. In the first chase of a diesel truck, apparent O3levels reached up to 400 ppb during obvious combustion plumes; in the second chase of a non-diesel microbus, there
was no interference. The NO signal was derived from a total NOymeasurement minus measured NO2; it was assumed that all NOyin a
fresh combustion plume was either NO or NO2. The O3interference correlated best with the PM2.5, PAH and particulate active surface area measurements. Measured hydrocarbon levels were low during the diesel event and numerous hydrocarbons (acetone, methanol, benzene, C2-benzenes, C3-C2-benzenes, toluene) show a large event at 03:04:11 p.m. with no corresponding interference in the O3measurement, indicating
that these compounds are not responsible for the observed interference. The gaps in the time traces are from deliberate zero air purges of the inlet line. Instrument lag times have been adjusted for such that displayed time traces represent the time at the inlet tip. Instrument response times have not been adjusted.
3 Results and discussion
3.1 Interference from ambient particles for UV O3monitor
on board ARI Mobile Lab
During the course of the five week MCMA-2003 campaign, distinct “spike events” in the UV O3 monitor on board
the ARI Mobile Lab were observed when the ARI Mobile Lab was sampling the ambient diluted exhaust from on-road diesel vehicles. This UV O3 monitor registered spikes of
up to 400 ppb occurring simultaneously with large increases in CO2 and NO concentrations from sampled combustion
plumes. Figure 2 shows an example of such an O3 spike
event while sampling a diesel truck with large particle load-ings, but then not present during a chase of a non-diesel mi-crobus just minutes later. More than twenty-five of these events were observed during the MCMA-2003 campaign. All such interference events were coincident with large en-hancements in particle number density. Almost all of these events were observed when the ARI Mobile Lab was clearly sampling the exhaust from a diesel vehicle (Canagaratna et al., 2004; Herndon et al., 2005; Shorter et al., 2005); the rest of the events were from indeterminate sources. Of the various instruments on board the ARI Mobile Lab, the best correlations in time for these interferences were found with
several particle instruments, specifically a DustTrak PM2.5
instrument (TSI Model 8520), which measured the mass loading of particulate matter smaller than 2.5 microns, an EcoChem Polycyclic Aromatic Hydrocarbon (PAH) moni-tor (PAS 2000 CE), which measured signal response to pho-toionization of particulate surfaces and has been shown to respond strongly to surface bound PAHs and possibly to el-emental carbon (EC), and an EcoChem Diffusion Charger monitor (DC 2000 CE), which measures particulate active surface area; see Marr et al. (2004) and Jiang et al. (2005) for a description of the use and interpretation of these instru-ments while sampling very fresh on-road exhaust emissions. Also on board the ARI Mobile Lab, an Aerodyne Aerosol Mass Spectrometer (AMS) (Jayne et al., 2000) measured size resolved chemical composition of non-refractory parti-cles less than 1 µm. The AMS showed an increased load-ing of organic material from diesel vehicles, but no enhance-ment in nitrate, sulfate or ammonium, consistent with other observed diesel exhaust measurements (Canagaratna et al., 2004). Poor correlations at the time of these O3interference
spikes were found with other gas phase species measured on board the ARI Mobile Lab, including CO, formaldehyde (HCHO), sulfur dioxide (SO2), nitrogen dioxide (NO2), and
a suite of volatile organic compounds (VOC) measured in real time by an on-board Proton Transfer Reaction Mass Spectrometer (PTRMS) (Rogers et al., 2006). See Fig. 2 for example.
Diesel vehicles are not known to emit O3directly (Chow,
2001; Yanowitz et al., 2000). The NO concentrations ob-served in Fig. 2 (>500 ppb) result in a short lifetime for O3
with respect to loss via reaction with NO (<6 s); this was shorter than the residence time in the inlet for the UV O3
monitor inside the ARI Mobile Lab (∼12 s). Thus, if O3
were directly emitted by a diesel vehicle, it would have to be in enormous concentrations (>2 ppm per 1 ppm of CO2
emitted) to be observed in the large concentrations in Fig. 2. It is concluded that these large O3spikes were not due to O3
itself, but rather are due to interferences in the O3
measure-ment.
Diesel vehicles are known to emit particles with large number densities in both a nanomode, (0–0.05) µm, and an accumulation mode, (0.05–0.5) µm (Canagaratna et al., 2004; Kittelson, 1998). A small percentage of particles less than 0.2 µm in geometric diameter are known to pass through standard Teflon inlet filters (Liu et al., 1983). Submicron par-ticles may potentially be lost on the mesh scrubber within the UV O3 monitor (TECO, 20062) and could thus scatter
and/or absorb UV light within the detection chamber to ap-pear as a positive O3signal. This is the simplest, and
there-fore the most likely, explanation for the large interferences like the example shown in Fig. 2. Fine particles have been shown to cause interferences in UV O3 monitors in a pre-2TECO: Technical Service Group at Thermo Electron
Corpora-tion, personal communicaCorpora-tion, 2006.
vious study using a solid dye chemiluminescence monitor (Arshinov et al., 2002), although other studies have not ob-served this (Huntzicker and Johnson, 1979). Crude estimates of the size of an O3interference based on the measured
ac-tive surface area on board the mobile lab are not enough to account for the observed interference, but there is consid-erable uncertainty in this estimate and the subject warrants further research (see Sect. 4).
Several other possible causes for this observed O3
inter-ference have been discounted. (a) Gas phase compounds emitted by diesel vehicles could be responsible for the inter-ference, however, Fig. 2 shows that large concentrations of CO2, NO and numerous hydrocarbon species (acetaldehyde,
formaldehyde, acetone, methanol, benzene, C2-benzenes, C3-benzenes, toluene) measured on board the ARI mobile lab do not cause such spikes in the O3 concentration. If a
gas phase compound were responsible for the interference, it would have to be emitted in large quantities by diesel ve-hicles only and have a proton affinity less than that for H2O
such that it would not have been measured by the PTRMS instrument on board the ARI mobile lab. We have no sugges-tions for likely candidates for such a gas phase diesel emis-sion product. (b) Volatile compounds desorbing off of the particulate filter specifically during sampling of diesel ex-haust could also explain these observed interferences, but this would require that the compound or compounds desorb very quickly (<10 s) in order to cause the short duration spikes observed but not influence the measured O3background
val-ues; see Fig. 2. (c) Rapid fluctuations in water vapor could interfere with the windows of the absorption cell (Wilson, 2005), but it seems unlikely that water vapor levels are much greater in the exhaust of diesel vehicles as compared to that of gasoline vehicles; in fact, the opposite is most likely the case. (d) Lastly, the presence of elemental Mercury could re-sult in spikes in the O3monitor such as those observed.
Al-though Hg is known to be sprinkled within vehicles as part of the cultural practices of some Latino groups (Riley et al., 2001), the interference observed in this study was only while sampling the exhaust from diesel vehicles and this cultural practice is not limited to diesel vehicles. In conclusion, none of these possibilities seems as straightforward or as likely as an interference from submicron particles entering the detec-tion chamber within the UV O3monitor.
If we take it that fine particles are indeed driving this in-terference, or at least that the interference is proportional to the concentration of fine particulate matter, the question is whether this type of interference presents a significant is-sue for most UV O3 monitors. Sampling done from the
ARI Mobile Lab represented an extreme case, with particle loadings often greater than 2000 µg m−3, which were heav-ily dominated by fresh traffic emissions and were thus com-prised mostly of fine particles (Dp<0.2 µm). The
interfer-ence in the UV O3 monitor on board the ARI Mobile Lab
correlated with the PM2.5 particle loading as measured by
Table 2. Regression coefficients and corresponding R2values for linear least square best-fits for standard UV O3monitor measured
concen-trations versus open path DOAS and FTIR measurements at CENICA and La Merced sites. Hourly averaged data used for all instruments. Similar comparisons for CO instruments are included for reference (see Sect. 3.2.1).
(a) UV O3 monitor comparison with open path
measurements
Regression slope Regression intercept (ppb for O3and ppm for CO)
Correlation coefficient R2
CENICA UV vs. MIT DOAS-1 1.08 1.1 0.97
CENICA UV vs. MIT DOAS-2 1.13 −4.6 0.95
CENICA UV vs MIT DOAS-2
(day time only = 08:00 a.m. to 04:00 p.m.)
1.11 1.6 0.96
La Merced RAMA UV vs UNAM DOAS 0.82 −3.7 0.89
La Merced RAMA UV vs UNAM FTIR 0.90 −4.4 0.96
(b) Open path DOAS comparison
CENICA DOAS-2 vs. DOAS-1 0.93 5.9 0.96
CENICA DOAS-2 vs DOAS-1
(day time only = 08:00 a.m. to 04:00 p.m.)
0.96 1.8 0.98
(c) CO monitor comparison with open path mea-surements
CENICA Monitor vs CTH FTIR 0.96 0.1 0.93
La Merced RAMA Monitor vs UNAM FTIR 0.67 0.94 0.70
(d) ARI Mobile Lab UV O3monitor comparisons
ARI Mobile Lab UV vs. MIT DOAS-1 at CENICA 0.56 6.0 0.88
ARI Mobile Lab UV vs. UNAM FTIR at La Merced
0.47 11.6 0.90
ARI Mobile Lab UV vs. RAMA UV at Pedregal 0.60 9.0 0.90
ARI Mobile Lab UV vs. CENICA UV at Santa Ana
0.75 0.0 0.95
0.18 ppb) of O3 interference per 1 µg m−3of particle
load-ing. Ambient loadings typical for many urban environments of <15 µg m−3 would thus lead to a potential interference for a normally situated UV O3monitor (at least one that was
not on board a mobile laboratory) of <3 ppb. Over the course of an eight hour day in an urban area with a daily maximum O3concentration of 100 ppb, this type of interference could
lead to an average measured O3concentration that is at most
3% higher than reality. The actual influence of fine particles on the measured O3concentration by typical UV O3
moni-tors depends on the placement of the monimoni-tors, particularly with respect to fresh traffic emissions. The recently revised national monitoring strategy under development by the U.S. EPA (Environmental Protection Agency, 2005) calls for an increase in the amount of “near roadway” monitoring, which will place more O3monitors in areas affected by fresh diesel
emission. Although this initial indication is that this type of interference may not present a significant problem, this is-sue is important enough to warrant further study that directly measures the interference to UV O3monitors from fine
par-ticles in an urban environment (see Sect. 4).
3.2 Overall comparison of multiple O3measurement
tech-niques
During MCMA-2003, O3 concentrations in Mexico City
were observed to exceed 200 ppb on several occasions and exceeded 100 ppb on every day of the 5 week campaign. Thus, the evaluation of the UV O3 monitors in this
set-ting constituted a test under non-attainment conditions by the U.S. EPA’s standards. In this study, the performance of UV O3 monitors at the CENICA and La Merced sites was
evaluated by comparison with co-located DOAS and FTIR open path spectroscopic measurements, which are both non-intrusive and highly accurate techniques in so far as they rely on extensively studied absorption cross sections (Orphal and Chance, 2003). Table 2a lists the results of linear regressions for the O3 concentrations as measured by UV O3monitors
versus those from the corresponding spectroscopic measure-ments. The two UV instruments differed from the open path measurements by more than 8% at each of the CENICA and La Merced sites, however one was systematically higher than the open path determination and the other was lower. The R2 values listed in Table 2 are all >0.89. The three most
probable reasons for divergence from near-perfect agreement were: Sect. 3.2.1: inherent difficulties in comparing open path and point sampling techniques, Sect. 3.2.2: incorrect calibration factors for the UV O3monitors, and Sect. 3.2.3:
interferences in the UV O3monitors. The UV O3monitor on
board the ARI Mobile Lab (Table 2d) is not included in this assessment for reasons described below in Sect. 3.2.5. 3.2.1 Comparison of open path and point sampling
mea-surements
The comparison of an open path measurement with a point sampling measurement is inherently difficult owing to the spatial and temporal inhomogeneities within an urban air-shed, driven by complex micro-meteorology and/or strong vertical gradients in concentration due to dry deposition. At the CENICA site, the measurements made by the two open path DOAS instruments, which were pointed in different di-rections and measured at different mean heights and path-lengths, provide an insight into the uniformity of the air mass in the area surrounding the site. The high level of agreement between the two DOAS instruments shown in Table 2b (1 h averaged points, regression slope ≥0.93, R2=0.96) indicates that O3is mixed rather homogeneously over a spatial scale of
few kilometers near the CENICA site. The regression slope was closer to unity (0.96) when data for this comparison were limited to only daytime hours where atmospheric mixing is strong, which corresponds to the times of highest O3
con-centrations with which we are most concerned. We use this comparison of the two DOAS instruments as a way to frame the comparisons between the point sampling and open path instruments; in this light, the comparisons of the point sam-pling and open path instruments are not as good.
To further put the comparisons of the O3measurements in
context, we also compared the measurements of CO by point sampling and open path techniques at both the CENICA and La Merced sites; see Table 2c. Because CO is not as re-active as O3 nor as likely to have strong vertical gradients
owing to deposition (Stutz et al., 2004), CO should be more homogeneously mixed throughout the boundary layer within the city. At the same time, CO is a primary pollutant from mobile and other sources and there may be inhomogeneities in close proximity to CO sources that do not occur for O3.
The relatively poor correlation of the CO monitor at the La Merced site may be due to an issue with the RAMA CO mon-itor, which is beyond the scope of this paper to explore. The R2values for the linear regressions for the CO measurements are thus another indicator of the level of spatial and tempo-ral variation. The R2values for the CO measurements were smaller than those for the respective O3 regression plots at
both the CENICA and La Merced sites. Thus, our conclusion above is further corroborated that spatial inhomogeneities are small enough to allow meaningful comparisons of hourly av-erages of open-path and point-sampling O3measurements at
these two locations, particularly for the afternoon periods of
elevated ozone concentrations. The next step is to examine why the slopes of the regression analyses deviate from unity. 3.2.2 Calibration factors for UV O3monitors
Barring interferences (discussed below in Sect. 3.2.3), the slopes of the regression analyses for these comparisons are indicative of the relative calibration factors. We again use the linear regressions for co-located open path DOAS O3
and CO measurements as points of comparison with the O3
measurements. The open path DOAS O3 and CO
regres-sions had slopes closer to unity (all within 7%, except for the La Merced CO comparison, which we are ignoring, see Sect. 3.2.1) than those for the O3 regression plots,
indicat-ing better agreement in the relative calibration factors of the two instruments. The slopes of the O3regression were not as
consistent; (1.08–1.13) and (0.82–0.90) for CENICA and La Merced respectively. Intercepts for the O3regressions with
respect to the UV monitors were negligible indicating that the differences in the regression slopes were not skewed by offsets. We therefore conclude that the most probable rea-son for the discrepancies found is then due to the calibration factors in the UV O3monitors.
We now examine the daily patterns of O3measurements at
both locations. The same patterns were observed on all days during the campaign, i.e., the UV monitor at CENICA al-ways reported a higher O3concentration than the co-located
open path instruments and the monitor at La Merced was al-ways lower. Thus, we average data from all days during the campaign together to attempt to quantify the overall trend. Figure 3a shows that the UV O3monitor differs most in
ab-solute concentration from the corresponding spectroscopic measurement at both CENICA and La Merced during af-ternoons when the O3 concentrations were at their highest.
Although the absolute concentration difference (Fig. 3b) var-ied throughout the course of the day, the percentage differ-ence (Fig. 3c) remained constant from roughly 10:00 a.m. to 05:00 p.m. local time each day, with average values of +12% (±2.5%) of the ambient O3concentration for CENICA and
−14% (±8.4%) for La Merced. Note that this is the average of the differences, not the difference of the averages. Overall, in both comparisons, the consistent percentage difference for most of the daytime hours, averaged over the span of a month leads us to the conclusion that the UV O3monitors at both
sites differed from the co-located open path measurements due to a calibration issue.
This discrepancy in the UV O3monitor calibration factors
can be corrected for by multiplying the O3 concentrations
from the UV O3monitors by a constant factor based on the
linear regression plots’ slopes listed above. Such a correction brings all comparisons with all four open path measurements listed to within 5% with corresponding R2values all greater than 0.90; see Table 3. This is excellent agreement in light of the other comparisons shown in Table 2 and previous stud-ies, which have concluded that UV O3monitors can measure
400 300 200 100 0 -100
Difference: UV - DOAS or FTIR
6:00 AM 12:00 PM 6:00 PM 120 80 40 0 [O3 ] (ppb) -20 0 20 5 4 3 2 1 0 [CO] (ppm) 80 60 40 20 RH (%) (a) (d) MIT DOAS 1 MIT DOAS 2 CENICA UV UV - DOAS 1 UV - DOAS 2 CO RH (b) Difference in ppb (c) Difference in % 120 80 40 0 [O 3 ] (ppb) 6:00 AM 12:00 PM 6:00 PM -20 0 20 -100 -50 0 50
Difference: UV - DOAS or FTIR
80 60 40 20 RH (%) 5 4 3 2 1 0 [CO] (ppm) (a) (d) UNAM FTIR UNAM DOAS RAMA UV UV - FTIR UV - DOAS CO RH (b) Difference in ppb (c) Difference in %
Fig. 3. Diurnally averaged profiles of O3concentrations for the entire MCMA-2003 field campaign as measured at the CENICA (left panel) and La Merced (right panel) sites are displayed in panel (a). The diurnally averaged profile of the difference between the UV O3monitor
and the corresponding long path spectroscopic measurement are shown on an absolute scale (b) and as a percentage of the measured O3
concentration (c). Note: these are not the differences of the diurnal profiles, they are the diurnal profiles of the differences. The diurnally averaged profiles of the measured CO concentrations and ambient relative humidity at both locations are also shown for reference (d). For the CENICA site, the CO concentration as measured by the CENICA rooftop monitor is shown; for the La Merced site, the CO concentration from the UNAM FTIR instrument is shown. For clarity, 1 σ uncertainty error bars are placed on only one of traces for differences between UV O3monitor and corresponding open path spectroscopic measurement (at CENICA uncertainties are displayed for the CENICA UV monitor – DOAS 1; at La Merced for the RAMA UV monitor – UNAM DOAS); the uncertainties for the other difference traces were comparable to those shown.
tropospheric O3 concentrations with uncertainties less than
±3% (Parrish and Fehsenfeld, 2000).
In practice, UV O3 monitors are routinely calibrated by
generating a known amount of O3 in a flow of dry zero air
and then adjusting the “span” or relative response of the UV O3 monitor to match the calibration standard (Parrish and
Fehsenfeld, 2000). The U.S. EPA recommends that calibra-tions be performed every six months with zero/span checks performed every two weeks with adjustments of the span up to 20% considered acceptable (Environmental Protection Agency, 1998). Typically, monitoring networks perform cal-ibrations and zero/span checks more frequently, e.g. cali-brations every month, and zero/span checks nightly (TCEQ, 2006). UV O3monitors in the RAMA monitoring network
are calibrated every two weeks with span/zero checks per-formed weekly and allowable span adjustments of ±10% (RAMA, 2005). Some studies have shown problems in this method arising from the use of dry calibration gas where
ambient measurements are made in moist air (Leston et al., 2005; Parrish and Fehsenfeld, 2000), and this is discussed in Sect. 3.2.3. The most likely explanation for the observed dif-ferences between the open path and UV O3 monitors is the
resetting of the calibration factors on the UV O3monitors as
part of routine calibrations. We reiterate that the RAMA net-work has been audited by the U.S. EPA (Environmental Pro-tection Agency, 2003) and found to be operating well under the guidelines for proper maintenance of their instruments, which indicates that it was the approved calibration proce-dures that allowed these differences to occur.
3.2.3 Possible interferences in UV O3monitors
As introduced earlier, several, but not all, previous stud-ies have observed interferences in the O3concentrations
re-ported by UV O3monitors (Arshinov et al., 2002; Huntzicker
Table 3. Regression coefficients and corresponding R2values for linear least square best-fits for corrected standard UV O3monitor measured
concentrations versus open path DOAS and FTIR measurements at CENICA and La Merced sites. Correction factors determined from regressions slopes listed in Table 2.
UV O3monitor comparison with open path measurements Correction factor
applied to UV O3
monitor
Regression slope Correlation coeffi-cient
R2
CENICA UV vs. MIT DOAS-1 1.1 0.94 0.90
CENICA UV vs. MIT DOAS-2 1.18 0.96 0.89
La Merced RAMA UV vs. UNAM DOAS 0.92 0.99 0.97
La Merced RAMA UV vs. UNAM FTIR 0.92 1.04 0.95
of the UV O3monitors at the two comparison sites in this
study, positive at CENICA and negative at La Merced, im-mediately indicate that a single type of interference in the UV O3 monitor was most likely not responsible for both
of the observed differences between the monitors and the co-located open path instruments. However, we more thor-oughly explore the possibility of interferences in the UV O3
monitors from (a) tritration of O3 by ambient NO, (b) the
presence of gas phase aromatic hydrocarbons and/or their photochemical products, (c) changing ambient relative hu-midity levels affecting the adsorption/desorption of aromatic compounds onto/from the scrubber in the UV O3 monitor
(Leston et al., 2005) or (d) changing ambient relative humid-ity levels directly influencing the transmission of UV radia-tion through the detecradia-tion cell within the monitor (Wilson, 2005), and (e) particles entering the detection chamber of the monitor (described in Sect. 3.1) or contaminating the particle filter.
(a) The largest percentage differences observed in the di-urnal patterns shown in Fig. 3c occur during the morning (05:00 a.m. to 09:00 a.m. local time). We refer to this as “morning rush hour” and examine this period in more depth here briefly. During this period, the O3concentrations were
at their smallest and, as such, were most prone to slight dif-ferences between open path and point sampling measure-ments, in particular the influence of NO and other combus-tion products. Motor vehicles are the most dominant NOx
sources in this environment, and at this time of day, the ma-jor source of O3at the surface is the down-mixing of O3from
above. Typical NO concentrations during the morning rush hour were on order of >100 ppb, making the lifetime of O3
with respect to titration by NO<30 s. During the morning rush hour, the suppression of the O3 concentration by 40%
to 70% as measured by the UV O3 monitor relative to the
DOAS-2 open path at CENICA and relative to both open path instruments at La Merced was consistent with both of these UV O3monitors being in relatively close proximity to
fresh NO emissions. Thus, O3 as measured at these point
sources was titrated by NO to a larger degree than along the open paths used by the spectroscopic techniques, which
would have been more greatly influenced by down-mixing of O3from aloft. Note that the absolute differences in O3
con-centration during this morning rush hour time frame were 5 to 7 ppb for these three comparisons, which was only just larger than the combined uncertainties of the pairs of instru-ments.
The relatively higher amount of O3measured by the UV
O3 monitor at CENICA relative to the DOAS-1 open path
instrument requires a different explanation; this difference in the concentration of UV O3monitor minus DOAS-1 had
a maximum of 170%, which corresponds to 3.4 ppb out of 1.9 ppb total O3. We note that combustion sources also peak
at this time of day; see Fig. 3d which shows the diurnally averaged profiles of CO at CENICA and La Merced. The higher concentration of O3as measured by the UV O3
mon-itor could potentially be explained by a small interference, presumably from a combustion product, perhaps fine parti-cles (Sect. 3.1). However, the magnitude of this difference (3.4 ppb) was within the combined uncertainty of the two measurements, so there was no definitive evidence for an in-terference in the UV O3monitor here.
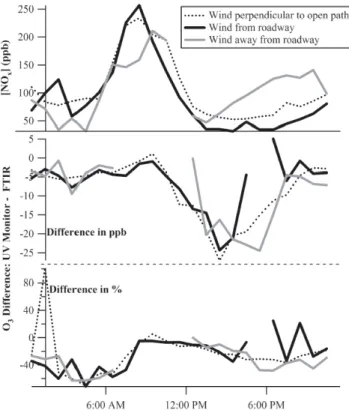
To look at the influence of nearby roadways, we plot the NOxconcentrations as a function of wind direction in Fig. 4.
The CENICA site shows very little variation, whereas the La Merced site shows a large variation of the average NOxlevels
with wind direction. This is consistent with the La Merced measurement site being in closer proximity to a major road-way. Thus, further analysis as a function of wind direction was done on the La Merced data to look at the potential ef-fects of NO tritration. The La Merced data were categorized into three types based on the wind direction with respect to the open path light paths physical relation to the nearby ma-jor roadway (see Grutter and Flores, 2004): (A) wind perpen-dicular to open path measurements (and therefore parallel to roadway, 140 to 230 and 320 to 50 degrees), (B) wind par-allel to open path measurements and coming from roadway (50 to 140 degrees), and (C) wind parallel to open path mea-surements and blowing away from roadway (230 to 320 de-grees). Figure 5 shows that category B shows enhanced NOx
Fig. 4. Average NOxconcentration as a function of wind direction
for CENICA and La Merced sites.
also shows the diurnally averaged profiles for the differences between the UV O3 monitor and FTIR O3 measurements.
Although the absolute magnitude of the difference between the measurements varies, the percentage difference remained roughly constant for the majority of the daylight hours (as described above in Sect. 3.2.2 of manuscript) and does not vary systematically as a function of wind direction. Thus, the conclusions is that the difference between the UV O3monitor
and the open path spectroscopic instruments was not driven by titration of O3by NO, nor any other combustion product.
Overall, titration of O3by NO does affect the diurnal
pro-files of O3, but does not account for the observed
discrepan-cies between the UV monitors and the open path instruments during the afternoon maxima in O3concentrations.
(b) A positive interference could potentially occur dur-ing periods of high ambient concentrations of aromatic com-pounds which may adsorb onto the scrubber, causing an ap-parent increase in O3 concentration (Huntzicker and
John-son, 1979). The MCMA-2003 field campaign included mul-tiple measurements of ambient VOC compounds from sev-eral instruments: the two DOAS instruments located at the CENICA supersite, two PTRMS instruments, one of which was on board the ARI Mobile Lab (Knighton et al., 2006??), and canister sampling followed by gas chromatography (GC) analysis at all of the locations described in this study (Lamb et al., 2004; Shirley et al., 2006). These measurements provide a consistent picture that within Mexico City over-all loadings of gas phase aromatics were higher during the morning hours (on order of ∼30 ppbv) and lower during the afternoons (on order of ∼15 ppbv). This was inconsistent with the overall pattern of the observed differences between the UV O3monitors and the open path instruments, which
showed a maximum in the afternoon. Additionally, both the DOAS and PTRMS instruments located at the CENICA site observed several large styrene (up to 3.9 ppbv) and naph-thalene (up to 1.9 ppbv) events during the five week field
Fig. 5. For La Merced site, diurnally averaged profiles of measured NOxconcentrations (top) and differences between UV O3monitor
and open path FTIR measurements in absolute (middle) and per-centage (bottom) units colored as a function of wind direction cate-gories (see text for description). NOxconcentrations from RAMA
chemiluminescence monitor.
campaign (Volkamer et al., 2005a). Laboratory tests have shown that UV O3monitors respond to both styrene
(Gros-jean and Harrison, 1985; Hudgens et al., 1994) and naph-thalene (Kleindienst et al., 1993), with response factors of (20%–113%) and 116%, respectively. Corresponding inter-ferences in the UV O3 monitors as compared to the DOAS
instrument were not observed for these styrene and naphtha-lene events. We conclude that ambient aromatic hydrocar-bons do not significantly influence the measurements made by UV O3monitors.
However, aromatic VOC’s are considered less likely to be the primary compounds responsible for interferences in UV O3 monitors than the oxidized and/or nitrated compounds
formed from these aromatic VOC’s. For example, an EPA laboratory study (Wisbith, 1999) showed that modest levels of o-nitrotoluene (24 ppb) can cause a significant interfer-ence at low humidity (20–30%). (This same study (Wisbith, 1999) also showed that mercury was a significant interfer-ence, but mercury was found only in sporadic short-duration events in Mexico City and would not have been the cause of interferences in the diurnal O3levels.) The aromatic
hy-drocarbon concentrations measured during this study were large enough such that the concentrations of oxidized and/or
nitrated products of these aromatics, which were not directly identified by the VOC measurements made during MCMA-2003, might be found in sufficient concentrations to cause an interference as large as the observed difference between the UV O3monitors and the co-located spectroscopic
instru-ments. Thus, measured hydrocarbon levels during MCMA-2003 provided no evidence for interferences in the UV O3
monitors from oxidized and/or nitrated aromatic compounds, but did not definitively rule out the possibility.
(c) Previous work by Leston et al. (2005) has shown inter-ferences in the UV O3monitors from aromatic compounds
being adsorbed/desorbed onto/from the scrubber coincident with variations in the ambient relative humidity. This inter-ference can be either positive or negative.
A positive interference in the UV O3 monitor would be
expected during periods when the ambient relative humidity was decreasing or relatively stable, which would be from ap-proximately 08:00 a.m. to 05:00 p.m. local time as shown in Fig. 3d, and a positive bias in the UV O3monitor was indeed
observed at the CENICA site during these times. However, Leston et al. (2005) showed that UV monitors with heated sil-ver wool scrubbers perform well compared with FRM chemi-luminescence instruments or, if anything, measure slightly low, whereas UV monitors with MnO2 scrubbers show a
positive interference from photochemical products in a smog chamber, presumably aromatic hydrocarbons or their deriva-tives. In our study however, we observed a positive bias in the UV monitor at the CENICA site, which employed a heated silver wool scrubber and should thus agree well or measure lower values. Additionally, we observed a negative bias in the UV monitor at the La Merced site, which employed a MnO2 scrubber and would thus be prone to positive
inter-ferences according to the Leston et al. study. Given that the observed differences at both locations are opposite in sign to the previously reported differences expected from interfer-ences, it is left as our conclusion that the most likely reason behind the observed discrepancies between the UV monitors and the co-located open path spectroscopic instruments is the mis-calibration of the UV monitors.
Additionally along these same lines, a negative interfer-ence in the UV O3monitors would be expected as relative
humidity rises in the late afternoon and aromatic compounds desorb from the scrubber into the reference channel of the UV O3monitor (Leston et al., 2005). However, the negative
difference between the UV O3 monitor and the open path
spectroscopic instruments at La Merced occurred during the early afternoon as relative humidity was decreasing.
In summary, we observed no evidence for either a pos-itive or negative interference in the UV O3 monitors from
aromatic compounds being adsorbed/desorbed onto/from the scrubber coincident with variations in the ambient relative humidity. We note that our conclusions generally contra-dict those of Leston et al. (2005) from their Mexico City study, who observed a difference between co-located UV and chemiluminescence O3monitors that they attributed to
con-tamination of the O3 scrubber in the UV O3 monitor. The
reasons for this contradiction are unclear, but further mea-surements are suggested at the end of this article.
(d) Careful laboratory studies have shown that variations in relative humidity can interact with the material of the de-tection cells within the UV O3 monitors, causing spurious
O3concentration differences during times of rapid changes
in ambient relative humidity (Meyer et al., 1991; Wilson, 2005). In this study, the fastest change in ambient relative humidity occurred before 09:00 a.m. local time, which did not correspond with the maximum observed difference be-tween the UV O3monitors and the open path spectroscopic
instruments which occurred several hours later, typically af-ter 12:00 p.m. local time. Additionally, this afaf-ternoon time period of maximum discrepancy in the UV O3monitors was
coincident with periods of relatively stable ambient relative humidity. Thus, we did not observe any evidence for this in-terference of changing relative humidity in this field study. We note that other field studies involving co-located mea-surements of O3via NO-chemiluminescence and UV
absorp-tion on board an airplane have shown no evidence for this ef-fect of ambient relative humidity variations on the scrubber performance (Ryerson et al., 1998).
(e) A possible interference from ambient particles was not substantiated by diurnal profiles of particle mass below 0.2 µm from either previous studies (Moya et al., 2004) or from the MCMA-2003 campaign (Salcedo et al., 2006). Fine particles of diameter <0.2 µm reached a maximum mass concentration in Mexico City during the morning hours, but differences between the UV O3 monitors and the
spectro-scopic instruments were largest during the afternoon. PM10
measurements at both the CENICA and La Merced sites cor-roborate this diurnal pattern, also showing maximum parti-cle loadings in the morning (RAMA, 2005). Thus, ambient particles could not have accounted for the observed differ-ences between the UV O3monitors and the open path
spec-troscopic instruments.
3.2.4 Conclusions on overall comparison of multiple O3
measurement techniques
In conclusion, we observed no evidence for any interfer-ence, either positive or negative, in the UV O3monitors from
the possible sources listed in Sect. 3.2.3. Measurements of ambient hydrocarbons exclude the possibility that aromatic VOC’s cause a significant interference in UV O3monitors,
but do not preclude the possible influence of oxidized and/or nitrated aromatics. In general, our results do not rule out the possibility of some complex interference accounting for the observed differences between the UV O3 monitors and the
open path spectroscopic instruments. However, as detailed in Sect. 3.2.2, the simplest, and therefore most plausible, ex-planation for the observed differences was the incorrect cali-bration factors for the UV monitors.
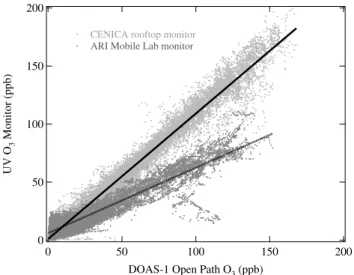
200 150 100 50 0 UV O 3 Monitor (ppb) 200 150 100 50 0
DOAS-1 Open Path O3 (ppb)
CENICA rooftop monitor ARI Mobile Lab monitor
Fig. 6. Linear regressions for UV O3 monitors versus DOAS-1 open path measurement of O3at CENICA site. Data from two
different UV O3monitors are shown: the CENICA monitor located on the roof of their headquarters building (light gray points) and the monitor on board the ARI Mobile Lab (dark gray points). The linear fits (with 2σ uncertainties reported from the fit only) are: CENICA rooftop monitor (solid line): slope=1.08±0.01, intercept=1.1±0.1, R2=0.97
ARI Mobile Lab monitor (dashed line): slope=0.56±0.01, intercept=6.0±0.1, R2=0.88.
3.2.5 UV O3monitor on board ARI Mobile Lab
Comparisons of the data from the UV O3monitor on board
the ARI Mobile Lab with measurements from DOAS, FTIR and other UV O3monitors during stationary deployments at
all four co-located sites (Table 2d) revealed a degraded per-formance for this particular monitor. Figure 6 shows the lin-ear regressions for the UV O3 monitor on the roof of the
CENICA headquarters building and the monitor on board the ARI Mobile Lab versus the co-located DOAS-1 open path measurement. This is an example of the degraded perfor-mance of the ARI Mobile Lab monitor, which displayed a negative bias at high ambient O3levels and a positive bias at
low ambient O3levels. This pattern was observed at all four
stationary sites in comparisons with both open path and point sampling O3 measurements, with multiple scrubber types,
indicating that the problem was definitely with the UV O3
monitor on board the ARI Mobile Lab. This behavior may be explained by calibration factor differences but was most likely due to a contaminated particle filter and/or scrubber for this particular monitor. For example, this pattern was consistent with a contaminated particulate filter destroying O3at high ambient O3levels and releasing particles and/or
some UV absorbing species at low ambient O3levels.
Con-tamination of this particular particle filter was not surprising given its use on board the ARI Mobile Lab where it directly sampled exhaust plumes from heavy traffic.
Additionally, a negative interference was observed in the UV O3 monitor on board the ARI Mobile Lab during
rou-tine deliberate zero air purges of the main sampling inlet line, which were for calibration of other instruments sam-pling from the same inlet as the O3 monitor. Recent work
has shown that this type of behavior is consistent with rapid relative humidity changes influencing the transmission of UV light within the detection cell of the UV O3monitor (Wilson,
2005).
In summary, the performance of standard UV O3
moni-tors is dependent upon the performance of the particulate fil-ter, which was definitely an issue during this study for the UV O3monitor on board the ARI Mobile Lab. Overall, this
particular monitor suffered from both the observed aerosol interference (Sect. 3.1) and from a contaminated particulate filter and/or scrubber, such that data from this monitor were excluded from the earlier comparisons.
4 Conclusions
In this study, the performance of several UV O3 monitors
(U.S. EPA Federal Equivalent Method) has been assessed based on data from a recent field campaign in Mexico City. Two of these monitors were co-located with open path DOAS and FTIR measurements of O3. The O3values determined by
these UV monitors were systematically different from those determined by the open path instruments, with averaged dis-crepancies of up to 18%. If uniform span corrections are applied to these two sets of UV O3monitor data, the
agree-ment with the co-located open path instruagree-ments is within 5% with R2>0.89. Comparisons of two co-located open path DOAS O3measurements and co-located point sampling and
open path CO measurements showed that this level of agree-ment was adequate for the comparison of a point sampling technique with an open path measurement. Titration of O3
by NO is shown to influence these comparisons significantly only during morning rush hour when O3levels were low and
NOxlevels were at their highest. For these two comparisons
at the CENICA and La Merced fixed sites, there was no ev-idence to suggest that the observed differences in measured O3concentration were due to interferences affecting the
re-ported O3concentration of the UV O3monitors, but such a
possibility was not ruled out.
A third UV O3 monitor employed in this study
dis-played significant interferences from fresh diesel emissions attributed to fine particles (Dp<0.2 µm) passing through the particulate filter and scattering and/or absorbing radiation within the detection cell. This same monitor also produced biased measurements owing to a contaminated particle filter and/or scrubber.
As discussed in Sect. 3.2.2, the concentration of O3was
overestimated by the UV O3 monitor at CENICA and was
underestimated by the UV monitor at La Merced. As men-tioned, we used the regression slopes for the comparisons of
Table 4. Number of hour-long averaged O3concentrations that exceeded the EPA’s one-hour average threshold of 120 ppb, number of days
that included at least one hour-long averaged O3concentration above this threshold, and number of days that included an eight-hour long
averaged O3concentration above the EPA’s eight-hour average threshold of 85 ppb. Data are for the different O3instruments at the CENICA
and La Merced sites and are for the days during the MCMA-2003 campaign where the instruments were operating properly (27 days at CENICA and 34 days at La Merced).
Instrument Number of hours
with 1 h average violations Number of days with 1 h average violations Number of days with 8 h average violations CENICA UV O3monitor 55 19 20 UV O3monitor corrected 37 17 19 La Merced UV O3monitor 21 13 11 UV O3monitor corrected 50 21 19
the UV O3monitors with the open path spectroscopic
instru-ments to determine a corrected calibration factor for the UV monitors. To assess the larger implications of these incor-rect calibration factors, the number of violations of the U.S. EPA’s O3non-attainment thresholds was determined for the
O3concentrations as measured by the UV O3 monitors for
1-h and 8-h standards of 120 ppb and 85 ppb, respectively (Environmental Protection Agency, 2005; Reynolds et al., 2004); see Table 4. Correcting the calibration factor in the UV monitors resulted in a slight decrease in the number of days with violations at CENICA, 10% for 1-h average and 5% for 8-h average, and a relatively large increase in the number of days with violations at La Merced, 61% for 1-h average and 72% for 8-1-h average. T1-his data were only from the MCMA-2003 campaign and thus represents a lim-ited sample size and limlim-ited amount of seasonal variation. However, it is clear that this issue of correct calibration fac-tors can have a major impact on the non-attainment status of a polluted urban area, falsely inflating or deflating the num-ber of violations, potentially by very large amounts.
In summary, we conclude that UV O3 monitors, if
accu-rately calibrated, have the potential to work well in a heav-ily polluted urban environment, but that there are significant challenges associated with calibrating and operating these in-struments properly. Regardless of new technologies that may become available, use of UV O3monitors in monitoring
net-works worldwide will undoubtedly continue for many years to come, and as such, several advances with respect to testing and operation of these instruments should be pursued:
(1) Previously recommended calibration procedures involv-ing frequent side-by-side comparisons with an O3
in-strument that is maintained in good operating order, preferably employing a different measurement tech-nique (Parrish and Fehsenfeld, 2000), should be adopted by routine users of UV O3monitors in addition to
what-ever calibration practices are currently employed.
Ide-ally, discrepancies between particular monitors and the reference instrument should be resolved by cleaning and/or realignment of the UV monitor, rather than ad-justments of the zero and span on the monitor.
(2) The large interferences observed while sampling diesel vehicles (Sect. 3.1) indicate that fine particles have the potential to cause significant interferences in UV O3
monitors. Although the results here indicated that this type of interference is likely to be relatively small for most monitors, this issue should be looked at further. First, it should be confirmed that fine particles are in-deed the cause of such interferences or whether some other compound emitted by diesel vehicles is responsi-ble. Either way, further quantification of this interfer-ence is necessary in order to definitively determine the potential impact of this interference for UV O3monitors
placed near roadways.
(3) Although this study was able to reach conclusions em-ploying comparisons of the integrated O3concentration
over a long light path with a point sampling measure-ment, spatial and temporal inhomogeneities necessarily limit the ultimate precision of such comparisons. Future studies could avoid this limitation by comparing UV O3monitors side-by-side with point sampling
spectro-scopic instruments. Potential spectrospectro-scopic point sam-pling techniques include tunable infrared laser differ-ential absorption spectroscopy (TILDAS), folded light path FTIR and folded light path UV-DOAS. We en-courage future field studies that incorporate point sam-pling spectroscopic O3measurement techniques to
op-erate co-located with a standard UV O3monitor so as to
more definitively evaluate the performance of this stan-dard measurement technique. If possible, comparisons on multiple UV O3 monitors with different scrubber