HAL Id: hal-00295730
https://hal.archives-ouvertes.fr/hal-00295730
Submitted on 26 Aug 2005
HAL is a multi-disciplinary open access
archive for the deposit and dissemination of
sci-entific research documents, whether they are
pub-lished or not. The documents may come from
teaching and research institutions in France or
abroad, or from public or private research centers.
L’archive ouverte pluridisciplinaire HAL, est
destinée au dépôt et à la diffusion de documents
scientifiques de niveau recherche, publiés ou non,
émanant des établissements d’enseignement et de
recherche français ou étrangers, des laboratoires
publics ou privés.
MCMA-2003 field campaign
B. de Foy, E. Caetano, V. Magaña, A. Zitácuaro, B. Cárdenas, A. Retama, R.
Ramos, L. T. Molina, M. J. Molina
To cite this version:
B. de Foy, E. Caetano, V. Magaña, A. Zitácuaro, B. Cárdenas, et al.. Mexico City basin wind
circulation during the MCMA-2003 field campaign. Atmospheric Chemistry and Physics, European
Geosciences Union, 2005, 5 (8), pp.2267-2288. �hal-00295730�
and Physics
Mexico City basin wind circulation during the MCMA-2003 field
campaign
B. de Foy1, E. Caetano2, V. Maga ˜na2, A. Zit´acuaro2, B. C´ardenas3, A. Retama4, R. Ramos4, L. T. Molina1, and
M. J. Molina1
1Department of Earth, Atmospheric and Planetary Sciences, Massachusetts Institute of Technology, USA 2Centro de Ciencias de la Atm´osfera, Universidad Nacional Aut´onoma de M´exico, Mexico
3General Direction of the National Center for Environmental Research and Training (CENICA), National Institute of Ecology
(INE), Mexico
4Secretar´ıa del Medio Ambiente, Gobierno del Distrito Federal, Mexico
Received: 22 March 2005 – Published in Atmos. Chem. Phys. Discuss.: 2 May 2005 Revised: 28 July 2005 – Accepted: 11 August 2005 – Published: 26 August 2005
Abstract. MCMA-2003 was a major field campaign
in-vestigating the atmospheric chemistry of the Mexico City Metropolitan Area (MCMA) in April of 2003. This paper describes the wind circulation patterns during the campaign both within the Mexico City basin and on the regional scale. “Time roses” are introduced to concisely analyze the diurnal wind patterns. Three episode types were identified that ex-plain the conditions encountered: “O3-South”, “Cold Surge” and “O3-North”. These can be diagnosed from a combina-tion of synoptic and basin observacombina-tions based on whether the day was predominantly cloudy, or whether the O3peak
was in the north or south of the basin. O3-South days have weak synoptic forcing due to an anti-cyclone over the east-ern Pacific. Strong solar heating leads to northerly flows in the basin and an evening shift due to a gap flow from the south-east. Peak ozone concentrations are in the convergence zone in the south of the city. Cold Surge days are associated with “El Norte” events, with strong surface northerlies bring-ing cold moist air and rain. Stable conditions lead to high concentrations of primary pollutants and peak ozone in the city center. O3-North days occur when the sub-tropical jet is closer to Mexico City. With strong westerlies aloft, the circu-lation pattern is the same as O3-South days except for a wind shift in the mid-afternoon leading to ozone peaks in the north of the city. This classification is proposed as a means of un-derstanding pollutant transport in the Mexico City basin and as a basis for future meteorological and chemical analysis. Furthermore, model evaluation and design of policy recom-mendations will need to take into account the three episode types.
Correspondence to: B. de Foy
1 Introduction
The Mexico City Metropolitan Area (MCMA) is situated in-side a basin at 2240 m altitude and 19◦N latitude. The basin is surrounded by high mountains on three sides as shown in Fig. 1. Basin drainage flows in the MCMA are therefore modified by gap flows as well as plateau winds and valley effects further afield. To the west and south there is an el-evated rim of which the highest point is the Volcan Ajusco at 3930 m above sea level. To the east is a north/south bar-rier consisting of three peaks, with the Popocat´epetl reach-ing an elevation of 5465 m. To the north, the basin extends into the Mexican Plateau and the arid interior of the country, with the Sierra de Guadalupe creating a small 800 m bar-rier above the basin floor. The regional topography is just as important as that of the basin. To the south, at low alti-tude, are Cuernavaca and the valley of Cuautla. Immediately to the north-east is the bottom of the Sierra Madre Oriental parallel to coastal plains 50 km away and the coast of the Gulf of Mexico 200 km away. To the north-west and west is the Sierra Madre Occidental which forms a barrier to the Pacific, 300 km away. Molina and Molina (2002) describe in greater detail the MCMA and provide the current state of understanding of its air quality.
The Mexico City basin meteorology is usually classified into three seasons: the cold dry season from November to February, the warm dry season from March to April and the rainy season from May to October. These are due to the two basic patterns on the synoptic scale: dry, westerly flow from November to April with anticyclonic conditions, and moist easterly flows due to the weaker trade winds for the other half of the year.
2268 B. de Foy et al.: Mexico City wind circulation Pachuca Mexican Plateau Sierra Madre Oriental Gulf Breeze Afternoon Jet (Chalco Passage) Nevado de Toluca Cerro Catedral Mexico City Cuernavaca N Plateau Winds
Fig. 1. Mexico City basin and surrounding areas. The mountains surrounding the basins can be clearly seen, along with the Mexican Plateau to the north-west, the Sierra Madre Oriental and the drop to the Gulf of Mexico plain to the north-east and the low-lying Cuernavaca and Cuautla valley to the south. The location of the meteorological stations at Cerro Catedral (CATE), Nevado de Toluca (NEVA) and Pachuca (PACH) are indicated. Black arrows show 3 main wind features described in the literature: plateau winds, Gulf breezes and the afternoon jet into the basin.
Atmos. Chem. Phys., 5, 1–40, 2005 www.atmos-chem-phys.org/acp/5/1/
Fig. 1. Mexico City basin and surrounding areas. The mountains surrounding the basins can be clearly seen, along with the Mexi-can Plateau to the north-west, the Sierra Madre Oriental and the drop to the Gulf of Mexico plain to the north-east and the low-lying Cuernavaca and Cuautla valley to the south. The location of the me-teorological stations at Cerro Catedral (CATE), Nevado de Toluca (NEVA) and Pachuca (PACH) are indicated. Black arrows show 3 main wind features described in the literature: plateau winds, Gulf breezes and the afternoon jet into the basin.
Due to its complex physiography, the meteorology of the MCMA cannot be simplified to one individual factor but de-pends rather on the interplay of the basin with the Mexican plateau and the lower coastal areas. Jauregui (1988) ana-lyzed the surface wind and temperature measured in the city and their impact on SO2levels. For the dry season when
anti-cyclonic conditions and westerly flows aloft dominate, weak northerly flows were found during the morning, strengthen-ing in the afternoon with an increased westerly component and turning into downslope drainage flows at night. Of par-ticular significance was the effect of the urban heat island which may increase the drainage flows but reduces the up-slope flow to the west during the day. The surface energy balance was measured by Oke et al. (1992) showing large ground heat fluxes capable of modifying the local circula-tion. Jauregui and Luyando (1999) looked at the contribution of the attenuation due to aerosols to the radiation budget. In-creased radiation attenuation correlated with reduced wind speeds and temperatures but increased relative humidity and air pollution.
The Mexico City Air Quality Research Initiative (MARI) conducted a field campaign in February 1991 involving ver-tical profiling with both a LIDAR and an aircraft (Streit and Guzman, 1996). Nickerson et al. (1992) show some of the profiles obtained for particulate matter, SO2 and O3,
focussing on a day with weak northerly winds leading to high pollutant levels and one with stronger southerly winds leading to cleaner air. Williams et al. (1995) modeled the episodes to reproduce the light northeast winds with pol-lution accumulation in the south-west of the basin. La-grangian dispersion modeling found entrapment of particles
convected aloft into the drainage flows of the mountains at night. Bossert (1997) analyzed three different episodes which he called the synoptic, thermal and regional flows. In the first case, southerly flow aloft leads to strong cool southerly flow in the basin and rapid pollutant washout to the north. In the second case, very weak synoptic flows lead to a situation dominated by thermal heating in the basin. Up-slope flow leads to basin venting to the upper troposphere. Lastly, north-westerly synoptic flow leads to a situation fa-voring the arrival of cool moist air from the Gulf of Mexico into the basin. This leads to pollutant accumulation in the south of the basin followed by mountain venting as for the second case.
The next international campaign was the IMADA-AVER Boundary Layer Experiment held in February and March of 1997 (Doran et al., 1998). Fast and Zhong (1998) analyzed the meteorological factors associated with inho-mogeneous ozone concentrations using mesoscale models. Thermal flows were found similar to those described by Bossert (1997), but with significant vertical wind direction shear leading to recirculation over the basin and possible re-entrapment of air pollutants in the northern part of the basin. Other days had similar thermal flows but with no vertical shear and weaker flows aloft, combined with increased at-mospheric stability leading to pollutant accumulation in the south of the city. Residence times were analyzed with a La-grangian model showing very little multi-day accumulation.
Whiteman et al. (2000) found very strong daytime heat-ing which was followed by rapid coolheat-ing in the late after-noon. This could only be explained by horizontal advection of cold air from the south. Furthermore, flows were described that were not typical basin flows but rather were due to the plateau-basin interactions. The coastal flows described by Bossert (1997) were found to be held back by the moun-tains and only led to an influx of cold air when the plateau-basin thermal balance reverses later in the day. In addition, Whiteman et al. (2000) noted an absence of nocturnal inver-sions due to urban effects. Doran and Zhong (2000) ana-lyzed the strong southerly gap flow from the Cuautla valley through the Chalco passage. This correlates with both the north/south surface temperature gradient in the basin and a similar gradient aloft between the basin and Acapulco on the Pacific coast to the south. Jazcilevich et al. (2003) further analyzed these episodes using the Multiscale Climate Chem-istry Model (Grell et al., 2000). Transport of CO from the south-west to the northern part of the city resulting from the mountain-basin flow was indicative of direct, convective re-circulation of air.
Analysis of monitoring data from the Ambient Air Moni-toring Network (Red Autom´atica de Monitoreo Atmosf´erico, RAMA) has provided valuable insights into the basin dy-namics. Raga and Le Moyne (1996) analyzed basin-wide monitoring data and identified a pattern of transport from the north-west to the south-east using nonlinear analysis. Raga et al. (1999) identified evidence of the upslope flow on the
luted by up to 50% as the flow moves up the slope, the concentration of the latter increases. A lag time of 2 h was found for the transport from the basin floor to the edge of the basin. At night, increasing levels of O3at basin sites is
traced to downward transport due to the drainage flows. Prin-cipal component analysis of O3distributions was carried out
by Klaus et al. (2001). Four eigenvectors were found to ac-count for 55% of the variance in O3 concentrations. These
components correspond to the north/south transport of pollu-tants, the east/west slope flows, the center/periphery due to drainage flows and urban effects and a north-east/south-west component due to moisture and precipitation flows.
The majority of pollution studies to date have concentrated on episodes with O3peaks in the south of the city. This
pa-per examines this episode type during the MCMA-2003 cam-paign, but also expands the analysis by adding two additional categories of importance to air quality studies. Section 10 will suggest a classification of the existing circulation mod-els in terms of the episode types proposed here.
2 Field campaign description
MCMA-2003 was designed to be towards the end of the dry season when solar radiation is intense but daily convective rainfall has not yet begun. In addition, it included school vacations as well as Holy Week and Easter when traffic is greatly reduced in the whole city, providing a natural experi-ment for the impact of emissions reductions. The four goals of the field campaign were (1) to develop improved volatile organic compounds (VOC) and nitrogen oxides (NOx)
emis-sions inventories; (2) to develop a better understanding of formaldehyde sources and atmospheric chemistry; (3) to in-vestigate fine particulate components and sources; and (4) to develop improved understanding of odd nitrogen (NOy)
lev-els and partitioning. In this context, the main meteorological questions were (1) the nature of the mixed layer; (2) the im-pact of carry-over from day-to-day; and (3) the evaluation of mesoscale model performance.
This paper describes the basin circulation patterns occur-ring duoccur-ring the campaign and classifies the days of the cam-paign into three types of episodes. This lays the foundation for further work to answer the meteorological questions of the field campaign. By classifying the days, it will be possi-ble to look at the behavior of the mixed layer in relation to the basin circulation. Developing circulation patterns will guide the analysis of carry-over by identifying both the days where accumulation is expected to occur and those where the basin is flushed clean. Finally, the paper lays out a framework for evaluating models in terms of the dominant flow features encountered in the basin for multiple episodes grouped to-gether.
Fig. 2. Map of Mexico. Circles indicate radiosonde launch
sites: Mexico City (GSMN), Acapulco (ACAP), Veracruz (VER), Monterrey (MTY), Guadalajara (GUAD) and Manzanillo (MANZ). Surface stations are indicated by diamonds: Chinatu (CHIN), Presa Allende (ALLE), Pachuca (PACH), Huejutla (HUEJ), R´ıo Tomatlan (TOMA), Angamacutiro (ANGA), Instituto Mexicano de Tecnolog´ıa del Agua (IMTA), Atlacomulco (ATLA), Nevado de Toluca (NEVA), Puerto Angel (PUER), U. Tec. de Tec-machalco (UTEC), Iz´ucar de Matamoros (IZUC), Huimilpan (HUIM), Tampico (TAMP), Soto la Marina (SOTO), Matamoros (MATA), Jalapa (JALA), Tuxpan (TUXP), Alvarado (ALVA), Cd. Alem´an (CDAL), La Cangrejera (CANG), Zacatecas (ZACA) and Los Colomos (LOSC). Some stations are included for completeness but not labeled as they were not used.
Section 4 will provide an overview of the field campaign meteorological conditions and wind patterns at CENICA and proposes a classification and circulation scheme for the Mex-ico City basin. The surface wind patterns are analysed at the regional scale (Sect. 6) and at the basin scale (Sect. 7) showing the differences between the proposed episodes. Sec-tion 8 extends this analysis to the measurements available aloft from radiosondes. The impact of the circulation pat-terns on the diurnal meteorological profiles at CENICA and the pollution levels in the city will be described in Sect. 9. After the discussion in Sect. 10, a catalogue of events has been included in Sect. 11 to highlight photochemical and me-teorological events that are of particular interest.
3 Measurement description
The MCMA-2003 field campaign was based at the National Center for Environmental Research and Training (Centro Na-cional de Investigaci´on y Capacitaci´on Ambiental, CENICA) super-site working together with the Aerodyne mobile lab-oratory (Kolb et al., 2004). The analysis is based on the monitoring site at CENICA and on the monitoring networks
2270 B. de Foy et al.: Mexico City wind circulation
Fig. 3. Map of the MCMA showing the monitoring stations. The star is the CENICA supersite. Circles are National Meteorolog-ical Service surface stations: SMN Headquarters (GSMN), Es-cuela Nacional de Ciencias Biol´ogicas (ENCB), Mexico Interna-tional Airport (AERO), Tezontle (TEZO), Pimentel (PIME) and Presa Mad´ın (MADI). Triangles and diamonds are RAMA stations by geographical sector. Those referred to in text are: Tlalnepantla (TLA), Azcapotzalco (AZC), Tacuba (TAC), Villa de las Flores (VIF), Xalostoc (XAL), San Agustin (SAG), Chapingo (CHA), La Merced (MER), Cuajimalpa (CUA), Pedregal (PED), Tlalpan (TPN), Tlahuac (TAH). Closed circles denote availability of meteo-rological observations. Urban area of 1995 shown in beige, shading corresponds to topography.
operated by the Mexican National Weather Service (Servi-cio Meteorol´ogico Na(Servi-cional, SMN) and by RAMA. Detailed measurements during the campaign available from LIDAR, SODAR, tethersonde, pilot balloon, radiometers and tempo-rary monitoring sites installed on the MCMA boundary will be presented separately.
Figure 2 shows surface and upper-air stations used in the current study on the national scale. The automatic weather stations (EHCA) are operated by SMN (see http://smn.cna. gob.mx/productos/emas/emas.html) and report 10-min data in three hour blocks via satellite. The observations were averaged to one hour intervals for this analysis. The SMN radiosondes are launched at 12:00 UTC outside of Mexico City. The Mexico City radiosondes are launched from the SMN headquarters (GSMN), WMO ID 76679 (also MEX) which is on the western edge of the basin floor every 6 h at 00:00, 06:00, 12:00 and 18:00 UTC.
Figure 3 shows the observation network in the basin. CENICA is in the south-east of the city. There are six SMN surface weather stations in the basin: SMN Headquarters
L
H
H
O3-South
Cold Surge
O3-North
Fig. 4. GOES-12 satellite images for O3-South (14 April
11:45 CDT), Cold Surge (8 April 16:45 CDT) and O3-North (24 April 7:15 CDT). Areas of high and low pressure are marked by H and L. Arrows show significant wind directions: surface sea breezes for O3-South, low level jet for Cold Surge and westerlies aloft for O3-North. Images courtesy of GOES Biomass Burning Monitor-ing Team, UW-Madison, Cooperative Institute for Meteorological Satellite Studies (CIMSS).
Afternoon Day Night Night Afternoon Day Day Night
O3-South Cold Surge O3-North
Evening Evening
Fig. 5. Circulation model for the Mexico City basin for O3-South, Cold Surge and O3-North. Weak drainage flows on O3-South days give way to strong north-easterly winds. A weak southerly jet forms in the Chalco passage in the evening. Cold Surge days have predom-inantly northerly flow with a westerly component at night turning to easterly flow from the Gulf in the afternoon. On O3-North days, the day-time flow is from the north-west and gives way to a strong after-noon jet that starts in the pass but expands over the entire southern basin rim.
www.atmos-chem-phys.org/acp/5/1/ Atmos. Chem. Phys., 5, 1–40, 2005
B. de Foy et al.: Mexico City wind circulation 17
L
H
H
O3-South Cold Surge O3-North
Fig. 4. GOES-12 satellite images for O3-South (14 April
11:45 CDT), Cold Surge (8 April 16:45 CDT) and O3-North (24 April 7:15 CDT). Areas of high and low pressure are marked by H and L. Arrows show significant wind directions: surface sea breezes for O3-South, low level jet for Cold Surge and westerlies aloft for O3-North. Images courtesy of GOES Biomass Burning Monitor-ing Team, UW-Madison, Cooperative Institute for Meteorological Satellite Studies (CIMSS).
Afternoon Day Night Night Afternoon Day Day Night
O3-South Cold Surge O3-North
EveningEvening
Fig. 5. Circulation model for the Mexico City basin for O3-South, Cold Surge and O3-North. Weak drainage flows on O3-South days give way to strong north-easterly winds. A weak southerly jet forms in the Chalco passage in the evening. Cold Surge days have predom-inantly northerly flow with a westerly component at night turning to easterly flow from the Gulf in the afternoon. On O3-North days, the day-time flow is from the north-west and gives way to a strong after-noon jet that starts in the pass but expands over the entire southern basin rim.
www.atmos-chem-phys.org/acp/5/1/ Atmos. Chem. Phys., 5, 1–40, 2005
Fig. 4. GOES-12 satellite images for O3-South (14 April
11:45 CDT), Cold Surge (8 April 16:45 CDT) and O3-North (24 April 07:15 CDT). Areas of high and low pressure are marked by H and L. Arrows show significant wind directions: surface sea breezes for O3-South, low level jet for Cold Surge and westerlies aloft for O3-North. Images courtesy of GOES Biomass Burning Monitor-ing Team, UW-Madison, Cooperative Institute for Meteorological Satellite Studies (CIMSS).
(GSMN), Escuela Nacional de Ciencias Biol´ogicas (ENCB), Mexico International Airport (AERO), Tezontle (TEZO), Pi-mentel (PIME) and Presa Mad´ın (MADI). RAMA operates 32 monitoring sites in the MCMA. Of these, 15 are equipped with weather stations, 23 with CO monitors and 20 with O3
monitors. The data is archived at one-minute time resolution and averaged to one hour for reporting and analysis. The
B. de Foy et al.: Mexico City wind circulation 2271
L
H
H
O3-South
Cold Surge
O3-North
Fig. 4. GOES-12 satellite images for O3-South (14 April
11:45 CDT), Cold Surge (8 April 16:45 CDT) and O3-North (24 April 7:15 CDT). Areas of high and low pressure are marked by H and L. Arrows show significant wind directions: surface sea breezes for O3-South, low level jet for Cold Surge and westerlies aloft for O3-North. Images courtesy of GOES Biomass Burning Monitor-ing Team, UW-Madison, Cooperative Institute for Meteorological Satellite Studies (CIMSS).
Afternoon Day Night Night Afternoon Day Day Night
O3-South Cold Surge O3-North
EveningEvening
Fig. 5. Circulation model for the Mexico City basin for O3-South, Cold Surge and O3-North. Weak drainage flows on O3-South days give way to strong north-easterly winds. A weak southerly jet forms in the Chalco passage in the evening. Cold Surge days have predom-inantly northerly flow with a westerly component at night turning to easterly flow from the Gulf in the afternoon. On O3-North days, the day-time flow is from the north-west and gives way to a strong after-noon jet that starts in the pass but expands over the entire southern basin rim.
www.atmos-chem-phys.org/acp/5/1/ Atmos. Chem. Phys., 5, 1–40, 2005
Fig. 5. Circulation model for the Mexico City basin for O3-South, Cold Surge and O3-North. Weak drainage flows on O3-South days give way to strong north-easterly winds. A weak southerly jet forms in the Chalco passage in the evening. Cold Surge days have predominantly northerly flow with a westerly component at night turning to easterly flow from the Gulf in the afternoon. On O3-North days, the day-time flow is from the north-west and gives way to a strong afternoon jet that starts in the pass but expands over the entire southern basin rim.
symbol on the map shows the geographical sectors used by RAMA in classifying the stations.
The timezone in the MCMA was Central Standard Time (CST=UTC–6) before 6 April and daylight saving time (CDT=UTC–5) thereafter. The field campaign policy spec-ified the use of local time for data storage and analysis, a convention that will be followed here with times in CDT un-less marked otherwise. Solar noon during the campaign was within 5 min of 13:35.
4 Synoptic episodes
April is a transition month between the hot dry season and the wet season (Jauregui, 1988). There are therefore weather events occurring from both kinds of seasons in brief succes-sion. Typically, the mean April synoptic flow is dominated by a low level anticyclonic circulation over central south-ern Mexico and westerly winds aloft north of 20◦N. This leads to subsidence over the Mexico basin with weak sur-face winds favorable to the development of thermally driven circulations. This pattern was observed for two episodes dur-ing MCMA-2003: 14–17 April and 1–3 May. They will be referred to as “O3-South” as, under these conditions, ozone levels are highest in the south of the city. An important phe-nomenon leading to low temperatures and rains in Mexico is “el Norte” or “Cold Surge” (Schultz et al., 1998 and Mosi˜no Alem´an and Garc´ıa, 1974). This occurred twice during the campaign, on 8–10 and 20–22 April, and once before the be-ginning of the campaign on 29–31 March. The remaining days of the campaign had unperturbed westerlies with very weak anticyclonic conditions to the south and a strong sub-tropical jet just to the north of the MCMA. This results in
high ozone levels in the north of the city, and will be referred to as “O3-North”.
GOES-12 cloud imagery is shown in Fig. 4 for representa-tive days of the 3 episode types (14, 8, and 24 April). Su-perimposed are arrows showing dominant transport direc-tion of air masses important to the flow in the Mexico City basin. The proposed circulation patterns in the basin for each episode are shown in Fig. 5. These will be discussed in greater detail once the supporting data has been presented.
Surface and 500 hPa weather maps are shown in Figs. 6 and 7 for representative days of the 3 episode types (14, 8, and 24 April 13:00). O3-South days occur when a high pressure system is located over the eastern Pacific leading to subsidence and clear skies. Strong sea breezes develop un-der these conditions and are clearly signaled by the surface convection cloudiness on the Gulf coast as the warm moist air from the Gulf rises overland. For the Cold Surge, a sur-face high over Texas with convergence aloft leads to strong northerly flow of cold polar air down the Gulf of Mexico. It accumulates moisture and is partially held back by the Sierra Madre Oriental leading to afternoon flows over the moun-tains and strong flows through the isthmus of Tehuantepec. Mild cloudiness is associated with a low pressure trough off the western coast of Mexico containing warmer tropical air. For O3-North days, the situation is dominated by the west-erly winds that reach down to the latitude of the MCMA, with the subtropical jet clearly marked by the band of clouds that form beneath. This situation corresponds to low pressure systems over the US but very little activity to the south.
2272 B. de Foy et al.: Mexico City wind circulation
18 B. de Foy et al.: Mexico City wind circulation
6
B. de Foy et al.: Mexico City wind circulation
1010 1012 1012 1014 1014 1016 1016 1016 1016 1016 1016 1018 1018 1018 1018 1018 1018 1018 1018 1020 1020 1020 1020 1020 1022 1022 1022 1024 1024 5 10 15 20 20 20 20 20 20 20 25 25 25 25 25 25 25 25 25 25 25 25 30 30 30 30 30 30 30 30 30 30 30 30 35 35 35 35 35 40 120° W 110° W 100° W 90 ° W 10° N 20° N 30° N
Sea−Level Pressure (hPa) Isotherm (oC)
Wind (0.2−9.5 m/s)
(a) 14 April (O3-South)
1010 1012 1012 1012 1012 1012 1012 1012 1014 1014 1014 1014 1014 1016 1016 1016 1016 1016 1018 1018 1018 1018 1018 1020 1020 1020 1020 1022 1022 1022 1022 1024 1024 1024 1024 1026 1026 1026 1028 1028 1028 1030 1030 1032 1034 5 10 10 10 15 15 15 15 15 15 15 20 20 20 20 20 20 20 20 25 25 25 25 25 25 25 25 25 25 25 30 30 30 30 30 30 30 30 30 30 30 35 35 35 35 35 35 40 120° W 110° W 100° W 90 ° W 10° N 20° N 30° N
Sea−Level Pressure (hPa) Isotherm (oC)
Wind (0.1−14.0 m/s)
(b) 8 April (Cold Surge)
998 1000 1002 1004 1004 1006 1006 1006 1006 1008 1008 1008 1008 1008 1010 1010 1010 1010 1010 1010 1012 1012 1012 1012 1012 1012 1012 1014 1014 1014 1014 1014 1016 1016 1016 1018 1018 15 15 15 20 20 20 20 20 20 25 25 25 25 25 25 25 25 25 25 25 25 25 30 30 30 30 30 30 30 30 30 30 30 30 30 30 35 35 35 35 35 35 40 40 120° W 110° W 100° W 90 ° W 10° N 20° N 30° N
Sea−Level Pressure (hPa) Isotherm (oC)
Wind (0.4−12.4 m/s)
(c) 24 April (O3-North)
Fig. 6. Surface weather maps for (a) 14 April (O3-South), (b) 8
April (Cold Surge) and (c) 24 April (O3-North) at 13:00 CDT. Thick
blue lines for sea level pressure contours, thin red lines for surface
isotherms and wind vectors are shown.
5560558056005620 5640 5660 5680 5700 57205740 5760 5760 5780 5780 5800 5800 5820 5820 5820 5840 5840 5840 5840 5860 5860 5860 5880 5880 5880 5900 5900 5900 5920 5920 5920 5920 5920 5920 −24 −23 −22 −21−20 −19 −18 −17 −16 −15 −16 −15 −15 −14 −14 −14 −14 −13 −13 −13 −13 −13 −12 −12 −12 −11 −11 −11 −10 −10 −10 −9 −9 −9 −8 −8 −8 −7 −7 −7 −7 −6 −6 −6 −5 −5 −5 −5 −5 120° W 110° W 100° W 90 ° W 10° N 20° N 30° N Height (gpm) Isotherm (oC) Wind (0.8−39.8 m/s)
(a) 14 April (O3-South)
5580 5600 5620 5640 5660 5660 5680 5680 5700 5700 5720 5720 5740 5740 5760 5760 5780 5780 5800 5800 5800 5800 5820 5820 5820 5840 5840 5840 5860 5860 5860 5880 5880 5880 5880 5900 5900 5900 5900 −26 −25 −24 −23 −23 −22 −22 −21 −21 −20 −20 −19 −19 −18 −18 −17 −17 −16 −16 −16 −15 −15 −15 −14 −14 −14 −14 −13 −13 −13 −13 −12 −12 −12 −11 −11 −11 −11 −10 −10 −10 −9 −9 −9 −9 −8 −8 −8 −7 −7 −7 −6 −6 −6 −5 −5 −5 −4 −4 −4 −3 −3 −2 120° W 110° W 100° W 90 ° W 10° N 20° N 30° N Height (gpm) Isotherm (oC) Wind (1.0−38.7 m/s)
(b) 8 April (Cold Surge)
5520 5540 5560 5580 5600 5620 5640 5640 5660 5660 5680 5680 5700 5700 5700 5720 5720 5720 5740 5740 5740 5760 5760 5760 5780 5780 5780 5800 5800 5800 5820 5820 5820 5840 5840 5840 5860 5860 5860 5880 5880 5880 5900 5900 5900 5900 5900 5900 −20−19 −18 −17 −17 −16 −16 −15 −15 −14 −14 −14 −13 −13 −13 −13 −12 −12 −12 −12 −11 −11 −11 −10 −10 −10 −9 −9 −9 −8 −8 −8 −7 −7 −7 −6 −6 −6 −5 −5 −5 −5 −4 −4 −4 −3 −3 −3 −3 −3 −3 120° W 110° W 100° W 90 ° W 10° N 20° N 30° N Height (gpm) Isotherm (oC) Wind (0.4−33.9 m/s)
(c) 24 April (O3-North)
Fig. 7. Weather maps at 500 hPa for (a) 14 April (O3-South), (b)
8 April (Cold Surge) and (c) 24 April (O3-North) at 13:00 CDT.
Thick blue lines for 500 hPa height, thin red lines for isotherms
and wind vectors are shown.
Atmos. Chem. Phys., 0000, 0001–24, 2005
www.atmos-chem-phys.org/acp/0000/0001/
Fig. 6. Surface weather maps for (a) 14 April (O3-South), (b) 8 April (Cold Surge) and (c) 24 April (O3-North) at 13:00 CDT. Thick blue lines for sea level pressure contours, thin red lines for surface isotherms and wind vectors are shown.
Atmos. Chem. Phys., 5, 1–40, 2005 www.atmos-chem-phys.org/acp/5/1/ B. de Foy et al.: Mexico City wind circulation 19
6
B. de Foy et al.: Mexico City wind circulation
1010 1012 1012 1014 1014 1016 1016 1016 1016 1016 1016 1018 1018 1018 1018 1018 1018 1018 1018 1020 1020 1020 1020 1020 1022 1022 1022 1024 1024 5 10 15 20 20 20 20 20 20 20 25 25 25 25 25 25 25 25 25 25 25 25 30 30 30 30 30 30 30 30 30 30 30 30 35 35 35 35 35 40 120° W 110° W 100° W 90 ° W 10° N 20° N 30° N
Sea−Level Pressure (hPa) Isotherm (oC)
Wind (0.2−9.5 m/s)
(a) 14 April (O3-South)
1010 1012 1012 1012 1012 1012 1012 1012 1014 1014 1014 1014 1014 1016 1016 1016 1016 1016 1018 1018 1018 1018 1018 1020 1020 1020 1020 1022 1022 1022 1022 1024 1024 1024 1024 1026 1026 1026 1028 1028 1028 1030 1030 1032 1034 5 10 10 10 15 15 15 15 15 15 15 20 20 20 20 20 20 20 20 25 25 25 25 25 25 25 25 25 25 25 30 30 30 30 30 30 30 30 30 30 30 35 35 35 35 35 35 40 120° W 110° W 100° W 90 ° W 10° N 20° N 30° N
Sea−Level Pressure (hPa) Isotherm (oC)
Wind (0.1−14.0 m/s)
(b) 8 April (Cold Surge)
998 1000 1002 1004 1004 1006 1006 1006 1006 1008 1008 1008 1008 1008 1010 1010 1010 1010 1010 1010 1012 1012 1012 1012 1012 1012 1012 1014 1014 1014 1014 1014 1016 1016 1016 1018 1018 15 15 15 20 20 20 20 20 20 25 25 25 25 25 25 25 25 25 25 25 25 25 30 30 30 30 30 30 30 30 30 30 30 30 30 30 35 35 35 35 35 35 40 40 120° W 110° W 100° W 90 ° W 10° N 20° N 30° N
Sea−Level Pressure (hPa) Isotherm (oC)
Wind (0.4−12.4 m/s)
(c) 24 April (O3-North)
Fig. 6. Surface weather maps for (a) 14 April (O3-South), (b) 8
April (Cold Surge) and (c) 24 April (O3-North) at 13:00 CDT. Thick
blue lines for sea level pressure contours, thin red lines for surface
isotherms and wind vectors are shown.
5560558056005620 5640 5660 5680 5700 57205740 5760 5760 5780 5780 5800 5800 5820 5820 5820 5840 5840 5840 5840 5860 5860 5860 5880 5880 5880 5900 5900 5900 5920 5920 5920 5920 5920 5920 −24 −23 −22 −21−20 −19 −18 −17 −16 −15 −16 −15 −15 −14 −14 −14 −14 −13 −13 −13 −13 −13 −12 −12 −12 −11 −11 −11 −10 −10 −10 −9 −9 −9 −8 −8 −8 −7 −7 −7 −7 −6 −6 −6 −5 −5 −5 −5 −5 120° W 110° W 100° W 90 ° W 10° N 20° N 30° N Height (gpm) Isotherm (oC) Wind (0.8−39.8 m/s)
(a) 14 April (O3-South)
5580 5600 5620 5640 5660 5660 5680 5680 5700 5700 5720 5720 5740 5740 5760 5760 5780 5780 5800 5800 5800 5800 5820 5820 5820 5840 5840 5840 5860 5860 5860 5880 5880 5880 5880 5900 5900 5900 5900 −26 −25 −24 −23 −23 −22 −22 −21 −21 −20 −20 −19 −19 −18 −18 −17 −17 −16 −16 −16 −15 −15 −15 −14 −14 −14 −14 −13 −13 −13 −13 −12 −12 −12 −11 −11 −11 −11 −10 −10 −10 −9 −9 −9 −9 −8 −8 −8 −7 −7 −7 −6 −6 −6 −5 −5 −5 −4 −4 −4 −3 −3 −2 120° W 110° W 100° W 90 ° W 10° N 20° N 30° N Height (gpm) Isotherm (oC) Wind (1.0−38.7 m/s)
(b) 8 April (Cold Surge)
5520 5540 5560 5580 5600 5620 5640 5640 5660 5660 5680 5680 5700 5700 5700 5720 5720 5720 5740 5740 5740 5760 5760 5760 5780 5780 5780 5800 5800 5800 5820 5820 5820 5840 5840 5840 5860 5860 5860 5880 5880 5880 5900 5900 5900 5900 5900 5900 −20−19 −18 −17 −17 −16 −16 −15 −15 −14 −14 −14 −13 −13 −13 −13 −12 −12 −12 −12 −11 −11 −11 −10 −10 −10 −9 −9 −9 −8 −8 −8 −7 −7 −7 −6 −6 −6 −5 −5 −5 −5 −4 −4 −4 −3 −3 −3 −3 −3 −3 120° W 110° W 100° W 90 ° W 10° N 20° N 30° N Height (gpm) Isotherm (oC) Wind (0.4−33.9 m/s)
(c) 24 April (O3-North)
Fig. 7. Weather maps at 500 hPa for (a) 14 April (O3-South), (b)
8 April (Cold Surge) and (c) 24 April (O3-North) at 13:00 CDT.
Thick blue lines for 500 hPa height, thin red lines for isotherms
and wind vectors are shown.
Atmos. Chem. Phys., 0000, 0001–24, 2005
www.atmos-chem-phys.org/acp/0000/0001/
Fig. 6. Continued.
www.atmos-chem-phys.org/acp/5/1/ Atmos. Chem. Phys., 5, 1–40, 2005
20 B. de Foy et al.: Mexico City wind circulation
1010 1012 1012 1014 1014 1016 1016 1016 1016 1016 1016 1018 1018 1018 1018 1018 1018 1018 1018 1020 1020 1020 1020 1020 1022 1022 1022 1024 1024 5 10 15 20 20 20 20 20 20 20 25 25 25 25 25 25 25 25 25 25 25 25 30 30 30 30 30 30 30 30 30 30 30 30 35 35 35 35 35 40 120° W 110° W 100° W 90 ° W 10° N 20° N 30° N
Sea−Level Pressure (hPa) Isotherm (oC)
Wind (0.2−9.5 m/s)
(a) 14 April (O3-South)
1010 1012 1012 1012 1012 1012 1012 1012 1014 1014 1014 1014 1014 1016 1016 1016 1016 1016 1018 1018 1018 1018 1018 1020 1020 1020 1020 1022 1022 1022 1022 1024 1024 1024 1024 1026 1026 1026 1028 1028 1028 1030 1030 1032 1034 5 10 10 10 15 15 15 15 15 15 15 20 20 20 20 20 20 20 20 25 25 25 25 25 25 25 25 25 25 25 30 30 30 30 30 30 30 30 30 30 30 35 35 35 35 35 35 40 120° W 110° W 100° W 90 ° W 10° N 20° N 30° N
Sea−Level Pressure (hPa) Isotherm (oC)
Wind (0.1−14.0 m/s)
(b) 8 April (Cold Surge)
998 1000 1002 1004 1004 1006 1006 1006 1006 1008 1008 1008 1008 1008 1010 1010 1010 1010 1010 1010 1012 1012 1012 1012 1012 1012 1012 1014 1014 1014 1014 1014 1016 1016 1016 1018 1018 15 15 15 20 20 20 20 20 20 25 25 25 25 25 25 25 25 25 25 25 25 25 30 30 30 30 30 30 30 30 30 30 30 30 30 30 35 35 35 35 35 35 40 40 120° W 110° W 100° W 90 ° W 10° N 20° N 30° N
Sea−Level Pressure (hPa) Isotherm (oC)
Wind (0.4−12.4 m/s)
(c) 24 April (O3-North)
Fig. 6. Surface weather maps for (a) 14 April (O3-South), (b) 8
April (Cold Surge) and (c) 24 April (O3-North) at 13:00 CDT. Thick
blue lines for sea level pressure contours, thin red lines for surface
isotherms and wind vectors are shown.
5560558056005620 5640 5660 5680 5700 57205740 5760 5760 5780 5780 5800 5800 5820 5820 5820 5840 5840 5840 5840 5860 5860 5860 5880 5880 5880 5900 5900 5900 5920 5920 5920 5920 5920 5920 −24 −23 −22 −21−20 −19 −18 −17 −16 −15 −16 −15 −15 −14 −14 −14 −14 −13 −13 −13 −13 −13 −12 −12 −12 −11 −11 −11 −10 −10 −10 −9 −9 −9 −8 −8 −8 −7 −7 −7 −7 −6 −6 −6 −5 −5 −5 −5 −5 120° W 110° W 100° W 90 ° W 10° N 20° N 30° N Height (gpm) Isotherm (oC) Wind (0.8−39.8 m/s)
(a) 14 April (O3-South)
5580 5600 5620 5640 5660 5660 5680 5680 5700 5700 5720 5720 5740 5740 5760 5760 5780 5780 5800 5800 5800 5800 5820 5820 5820 5840 5840 5840 5860 5860 5860 5880 5880 5880 5880 5900 5900 5900 5900 −26 −25 −24 −23 −23 −22 −22 −21 −21 −20 −20 −19 −19 −18 −18 −17 −17 −16 −16 −16 −15 −15 −15 −14 −14 −14 −14 −13 −13 −13 −13 −12 −12 −12 −11 −11 −11 −11 −10 −10 −10 −9 −9 −9 −9 −8 −8 −8 −7 −7 −7 −6 −6 −6 −5 −5 −5 −4 −4 −4 −3 −3 −2 120° W 110° W 100° W 90 ° W 10° N 20° N 30° N Height (gpm) Isotherm (oC) Wind (1.0−38.7 m/s)
(b) 8 April (Cold Surge)
5520 5540 5560 5580 5600 5620 5640 5640 5660 5660 5680 5680 5700 5700 5700 5720 5720 5720 5740 5740 5740 5760 5760 5760 5780 5780 5780 5800 5800 5800 5820 5820 5820 5840 5840 5840 5860 5860 5860 5880 5880 5880 5900 5900 5900 5900 5900 5900 −20−19 −18 −17 −17 −16 −16 −15 −15 −14 −14 −14 −13 −13 −13 −13 −12 −12 −12 −12 −11 −11 −11 −10 −10 −10 −9 −9 −9 −8 −8 −8 −7 −7 −7 −6 −6 −6 −5 −5 −5 −5 −4 −4 −4 −3 −3 −3 −3 −3 −3 120° W 110° W 100° W 90 ° W 10° N 20° N 30° N Height (gpm) Isotherm (oC) Wind (0.4−33.9 m/s)
(c) 24 April (O3-North)
Fig. 7. Weather maps at 500 hPa for (a) 14 April (O3-South), (b)
8 April (Cold Surge) and (c) 24 April (O3-North) at 13:00 CDT.
Thick blue lines for 500 hPa height, thin red lines for isotherms
and wind vectors are shown.
Atmos. Chem. Phys., 0000, 0001–24, 2005
www.atmos-chem-phys.org/acp/0000/0001/
Fig. 6. Continued.
Atmos. Chem. Phys., 5, 1–40, 2005 www.atmos-chem-phys.org/acp/5/1/
Fig. 6. Surface weather maps for (a) 14 April (O3-South), (b) 8 April (Cold Surge) and (c) 24 April (O3-North) at 13:00 CDT. Thick blue lines for sea level pressure contours, thin red lines for surface isotherms and wind vectors are shown.
B. de Foy et al.: Mexico City wind circulation 2273
B. de Foy et al.: Mexico City wind circulation 21
6
B. de Foy et al.: Mexico City wind circulation
1010 1012 1012 1014 1014 1016 1016 1016 1016 1016 1016 1018 1018 1018 1018 1018 1018 1018 1018 1020 1020 1020 1020 1020 1022 1022 1022 1024 1024 5 10 15 20 20 20 20 20 20 20 25 25 25 25 25 25 25 25 25 25 25 25 30 30 30 30 30 30 30 30 30 30 30 30 35 35 35 35 35 40 120° W 110° W 100° W 90 ° W 10° N 20° N 30° N
Sea−Level Pressure (hPa) Isotherm (oC)
Wind (0.2−9.5 m/s)
(a) 14 April (O3-South)
1010 1012 1012 1012 1012 1012 1012 1012 1014 1014 1014 1014 1014 1016 1016 1016 1016 1016 1018 1018 1018 1018 1018 1020 1020 1020 1020 1022 1022 1022 1022 1024 1024 1024 1024 1026 1026 1026 1028 1028 1028 1030 1030 1032 1034 5 10 10 10 15 15 15 15 15 15 15 20 20 20 20 20 20 20 20 25 25 25 25 25 25 25 25 25 25 25 30 30 30 30 30 30 30 30 30 30 30 35 35 35 35 35 35 40 120° W 110° W 100° W 90 ° W 10° N 20° N 30° N
Sea−Level Pressure (hPa) Isotherm (oC)
Wind (0.1−14.0 m/s)
(b) 8 April (Cold Surge)
998 1000 1002 1004 1004 1006 1006 1006 1006 1008 1008 1008 1008 1008 1010 1010 1010 1010 1010 1010 1012 1012 1012 1012 1012 1012 1012 1014 1014 1014 1014 1014 1016 1016 1016 1018 1018 15 15 15 20 20 20 20 20 20 25 25 25 25 25 25 25 25 25 25 25 25 25 30 30 30 30 30 30 30 30 30 30 30 30 30 30 35 35 35 35 35 35 40 40 120° W 110° W 100° W 90 ° W 10° N 20° N 30° N
Sea−Level Pressure (hPa) Isotherm (oC)
Wind (0.4−12.4 m/s)
(c) 24 April (O3-North)
Fig. 6. Surface weather maps for (a) 14 April (O3-South), (b) 8
April (Cold Surge) and (c) 24 April (O3-North) at 13:00 CDT. Thick
blue lines for sea level pressure contours, thin red lines for surface
isotherms and wind vectors are shown.
5560558056005620 5640 5660 5680 5700 57205740 5760 5760 5780 5780 5800 5800 5820 5820 5820 5840 5840 5840 5840 5860 5860 5860 5880 5880 5880 5900 5900 5900 5920 5920 5920 5920 5920 5920 −24 −23 −22 −21−20 −19 −18 −17 −16 −15 −16 −15 −15 −14 −14 −14 −14 −13 −13 −13 −13 −13 −12 −12 −12 −11 −11 −11 −10 −10 −10 −9 −9 −9 −8 −8 −8 −7 −7 −7 −7 −6 −6 −6 −5 −5 −5 −5 −5 120° W 110° W 100° W 90 ° W 10° N 20° N 30° N Height (gpm) Isotherm (oC) Wind (0.8−39.8 m/s)
(a) 14 April (O3-South)
5580 5600 5620 5640 5660 5660 5680 5680 5700 5700 5720 5720 5740 5740 5760 5760 5780 5780 5800 5800 5800 5800 5820 5820 5820 5840 5840 5840 5860 5860 5860 5880 5880 5880 5880 5900 5900 5900 5900 −26 −25 −24 −23 −23 −22 −22 −21 −21 −20 −20 −19 −19 −18 −18 −17 −17 −16 −16 −16 −15 −15 −15 −14 −14 −14 −14 −13 −13 −13 −13 −12 −12 −12 −11 −11 −11 −11 −10 −10 −10 −9 −9 −9 −9 −8 −8 −8 −7 −7 −7 −6 −6 −6 −5 −5 −5 −4 −4 −4 −3 −3 −2 120° W 110° W 100° W 90 ° W 10° N 20° N 30° N Height (gpm) Isotherm (oC) Wind (1.0−38.7 m/s)
(b) 8 April (Cold Surge)
5520 5540 5560 5580 5600 5620 5640 5640 5660 5660 5680 5680 5700 5700 5700 5720 5720 5720 5740 5740 5740 5760 5760 5760 5780 5780 5780 5800 5800 5800 5820 5820 5820 5840 5840 5840 5860 5860 5860 5880 5880 5880 5900 5900 5900 5900 5900 5900 −20−19 −18 −17 −17 −16 −16 −15 −15 −14 −14 −14 −13 −13 −13 −13 −12 −12 −12 −12 −11 −11 −11 −10 −10 −10 −9 −9 −9 −8 −8 −8 −7 −7 −7 −6 −6 −6 −5 −5 −5 −5 −4 −4 −4 −3 −3 −3 −3 −3 −3 120° W 110° W 100° W 90 ° W 10° N 20° N 30° N Height (gpm) Isotherm (oC) Wind (0.4−33.9 m/s)
(c) 24 April (O3-North)
Fig. 7. Weather maps at 500 hPa for (a) 14 April (O3-South), (b)
8 April (Cold Surge) and (c) 24 April (O3-North) at 13:00 CDT.
Thick blue lines for 500 hPa height, thin red lines for isotherms
and wind vectors are shown.
Atmos. Chem. Phys., 0000, 0001–24, 2005
www.atmos-chem-phys.org/acp/0000/0001/
Fig. 7. Weather maps at 500 hPa for (a) 14 April (O3-South), (b) 8 April (Cold Surge) and (c) 24 April (O3-North) at 13:00 CDT. Thick blue lines for 500 hPa height, thin red lines for isotherms and wind vectors are shown.
www.atmos-chem-phys.org/acp/5/1/ Atmos. Chem. Phys., 5, 1–40, 2005 22 B. de Foy et al.: Mexico City wind circulation
6
B. de Foy et al.: Mexico City wind circulation
1010 1012 1012 1014 1014 1016 1016 1016 1016 1016 1016 1018 1018 1018 1018 1018 1018 1018 1018 1020 1020 1020 1020 1020 1022 1022 1022 1024 1024 5 10 15 20 20 20 20 20 20 20 25 25 25 25 25 25 25 25 25 25 25 25 30 30 30 30 30 30 30 30 30 30 30 30 35 35 35 35 35 40 120° W 110° W 100° W 90 ° W 10° N 20° N 30° N
Sea−Level Pressure (hPa) Isotherm (oC)
Wind (0.2−9.5 m/s)
(a) 14 April (O3-South)
1010 1012 1012 1012 1012 1012 1012 1012 1014 1014 1014 1014 1014 1016 1016 1016 1016 1016 1018 1018 1018 1018 1018 1020 1020 1020 1020 1022 1022 1022 1022 1024 1024 1024 1024 1026 1026 1026 1028 1028 1028 1030 1030 1032 1034 5 10 10 10 15 15 15 15 15 15 15 20 20 20 20 20 20 20 20 25 25 25 25 25 25 25 25 25 25 25 30 30 30 30 30 30 30 30 30 30 30 35 35 35 35 35 35 40 120° W 110° W 100° W 90 ° W 10° N 20° N 30° N
Sea−Level Pressure (hPa) Isotherm (oC)
Wind (0.1−14.0 m/s)
(b) 8 April (Cold Surge)
998 1000 1002 1004 1004 1006 1006 1006 1006 1008 1008 1008 1008 1008 1010 1010 1010 1010 1010 1010 1012 1012 1012 1012 1012 1012 1012 1014 1014 1014 1014 1014 1016 1016 1016 1018 1018 15 15 15 20 20 20 20 20 20 25 25 25 25 25 25 25 25 25 25 25 25 25 30 30 30 30 30 30 30 30 30 30 30 30 30 30 35 35 35 35 35 35 40 40 120° W 110° W 100° W 90 ° W 10° N 20° N 30° N
Sea−Level Pressure (hPa) Isotherm (oC)
Wind (0.4−12.4 m/s)
(c) 24 April (O3-North)
Fig. 6. Surface weather maps for (a) 14 April (O3-South), (b) 8
April (Cold Surge) and (c) 24 April (O3-North) at 13:00 CDT. Thick
blue lines for sea level pressure contours, thin red lines for surface
isotherms and wind vectors are shown.
5560558056005620 5640 5660 5680 5700 57205740 5760 5760 5780 5780 5800 5800 5820 5820 5820 5840 5840 5840 5840 5860 5860 5860 5880 5880 5880 5900 5900 5900 5920 5920 5920 5920 5920 5920 −24 −23 −22 −21−20 −19 −18 −17 −16 −15 −16 −15 −15 −14 −14 −14 −14 −13 −13 −13 −13 −13 −12 −12 −12 −11 −11 −11 −10 −10 −10 −9 −9 −9 −8 −8 −8 −7 −7 −7 −7 −6 −6 −6 −5 −5 −5 −5 −5 120° W 110° W 100° W 90 ° W 10° N 20° N 30° N Height (gpm) Isotherm (oC) Wind (0.8−39.8 m/s)
(a) 14 April (O3-South)
5580 5600 5620 5640 5660 5660 5680 5680 5700 5700 5720 5720 5740 5740 5760 5760 5780 5780 5800 5800 5800 5800 5820 5820 5820 5840 5840 5840 5860 5860 5860 5880 5880 5880 5880 5900 5900 5900 5900 −26 −25 −24 −23 −23 −22 −22 −21 −21 −20 −20 −19 −19 −18 −18 −17 −17 −16 −16 −16 −15 −15 −15 −14 −14 −14 −14 −13 −13 −13 −13 −12 −12 −12 −11 −11 −11 −11 −10 −10 −10 −9 −9 −9 −9 −8 −8 −8 −7 −7 −7 −6 −6 −6 −5 −5 −5 −4 −4 −4 −3 −3 −2 120° W 110° W 100° W 90 ° W 10° N 20° N 30° N Height (gpm) Isotherm (oC) Wind (1.0−38.7 m/s)
(b) 8 April (Cold Surge)
5520 5540 5560 5580 5600 5620 5640 5640 5660 5660 5680 5680 5700 5700 5700 5720 5720 5720 5740 5740 5740 5760 5760 5760 5780 5780 5780 5800 5800 5800 5820 5820 5820 5840 5840 5840 5860 5860 5860 5880 5880 5880 5900 5900 5900 5900 5900 5900 −20−19 −18 −17 −17 −16 −16 −15 −15 −14 −14 −14 −13 −13 −13 −13 −12 −12 −12 −12 −11 −11 −11 −10 −10 −10 −9 −9 −9 −8 −8 −8 −7 −7 −7 −6 −6 −6 −5 −5 −5 −5 −4 −4 −4 −3 −3 −3 −3 −3 −3 120° W 110° W 100° W 90 ° W 10° N 20° N 30° N Height (gpm) Isotherm (oC) Wind (0.4−33.9 m/s)
(c) 24 April (O3-North)
Fig. 7. Weather maps at 500 hPa for (a) 14 April (O3-South), (b)
8 April (Cold Surge) and (c) 24 April (O3-North) at 13:00 CDT.
Thick blue lines for 500 hPa height, thin red lines for isotherms
and wind vectors are shown.
Atmos. Chem. Phys., 0000, 0001–24, 2005
www.atmos-chem-phys.org/acp/0000/0001/
Fig. 7. Continued.
Atmos. Chem. Phys., 5, 1–40, 2005 www.atmos-chem-phys.org/acp/5/1/
B. de Foy et al.: Mexico City wind circulation 23
1010 1012 1012 1014 1014 1016 1016 1016 1016 1016 1016 1018 1018 1018 1018 1018 1018 1018 1018 1020 1020 1020 1020 1020 1022 1022 1022 1024 1024 5 10 15 20 20 20 20 20 20 20 25 25 25 25 25 25 25 25 25 25 25 25 30 30 30 30 30 30 30 30 30 30 30 30 35 35 35 35 35 40 120° W 110° W 100° W 90 ° W 10° N 20° N 30° N
Sea−Level Pressure (hPa) Isotherm (oC) Wind (0.2−9.5 m/s)
(a) 14 April (O3-South)
1010 1012 1012 1012 1012 1012 1012 1012 1014 1014 1014 1014 1014 1016 1016 1016 1016 1016 1018 1018 1018 1018 1018 1020 1020 1020 1020 1022 1022 1022 1022 1024 1024 1024 1024 1026 1026 1026 1028 1028 1028 1030 1030 1032 1034 5 10 10 10 15 15 15 15 15 15 15 20 20 20 20 20 20 20 20 25 25 25 25 25 25 25 25 25 25 25 30 30 30 30 30 30 30 30 30 30 30 35 35 35 35 35 35 40 120° W 110° W 100° W 90 ° W 10° N 20° N 30° N
Sea−Level Pressure (hPa) Isotherm (oC) Wind (0.1−14.0 m/s)
(b) 8 April (Cold Surge)
998 1000 1002 1004 1004 1006 1006 1006 1006 1008 1008 1008 1008 1008 1010 1010 1010 1010 1010 1010 1012 1012 1012 1012 1012 1012 1012 1014 1014 1014 1014 1014 1016 1016 1016 1018 1018 15 15 15 20 20 20 20 20 20 25 25 25 25 25 25 25 25 25 25 25 25 25 30 30 30 30 30 30 30 30 30 30 30 30 30 30 35 35 35 35 35 35 40 40 120° W 110° W 100° W 90 ° W 10° N 20° N 30° N
Sea−Level Pressure (hPa) Isotherm (oC) Wind (0.4−12.4 m/s)
(c) 24 April (O3-North)
Fig. 6. Surface weather maps for (a) 14 April (O3-South), (b) 8
April (Cold Surge) and (c) 24 April (O3-North) at 13:00 CDT. Thick
blue lines for sea level pressure contours, thin red lines for surface
isotherms and wind vectors are shown.
5560558056005620 5640 5660 5680 5700 57205740 5760 5760 5780 5780 5800 5800 5820 5820 5820 5840 5840 5840 5840 5860 5860 5860 5880 5880 5880 5900 5900 5900 5920 5920 5920 5920 5920 5920 −24 −23 −22 −21−20 −19 −18 −17 −16 −15 −16 −15 −15 −14 −14 −14 −14 −13 −13 −13 −13 −13 −12 −12 −12 −11 −11 −11 −10 −10 −10 −9 −9 −9 −8 −8 −8 −7 −7 −7 −7 −6 −6 −6 −5 −5 −5 −5 −5 120° W 110° W 100° W 90 ° W 10° N 20° N 30° N Height (gpm) Isotherm (oC) Wind (0.8−39.8 m/s)
(a) 14 April (O3-South)
5580 5600 5620 5640 5660 5660 5680 5680 5700 5700 5720 5720 5740 5740 5760 5760 5780 5780 5800 5800 5800 5800 5820 5820 5820 5840 5840 5840 5860 5860 5860 5880 5880 5880 5880 5900 5900 5900 5900 −26 −25 −24 −23 −23 −22 −22 −21 −21 −20 −20 −19 −19 −18 −18 −17 −17 −16 −16 −16 −15 −15 −15 −14 −14 −14 −14 −13 −13 −13 −13 −12 −12 −12 −11 −11 −11 −11 −10 −10 −10 −9 −9 −9 −9 −8 −8 −8 −7 −7 −7 −6 −6 −6 −5 −5 −5 −4 −4 −4 −3 −3 −2 120° W 110° W 100° W 90 ° W 10° N 20° N 30° N Height (gpm) Isotherm (oC) Wind (1.0−38.7 m/s)
(b) 8 April (Cold Surge)
5520 5540 5560 5580 5600 5620 5640 5640 5660 5660 5680 5680 5700 5700 5700 5720 5720 5720 5740 5740 5740 5760 5760 5760 5780 5780 5780 5800 5800 5800 5820 5820 5820 5840 5840 5840 5860 5860 5860 5880 5880 5880 5900 5900 5900 5900 5900 5900 −20−19 −18 −17 −17 −16 −16 −15 −15 −14 −14 −14 −13 −13 −13 −13 −12 −12 −12 −12 −11 −11 −11 −10 −10 −10 −9 −9 −9 −8 −8 −8 −7 −7 −7 −6 −6 −6 −5 −5 −5 −5 −4 −4 −4 −3 −3 −3 −3 −3 −3 120° W 110° W 100° W 90 ° W 10° N 20° N 30° N Height (gpm) Isotherm (oC) Wind (0.4−33.9 m/s)
(c) 24 April (O3-North)
Fig. 7. Weather maps at 500 hPa for (a) 14 April (O3-South), (b)
8 April (Cold Surge) and (c) 24 April (O3-North) at 13:00 CDT.
Thick blue lines for 500 hPa height, thin red lines for isotherms
and wind vectors are shown.
Atmos. Chem. Phys., 0000, 0001–24, 2005
www.atmos-chem-phys.org/acp/0000/0001/
Fig. 7. Continued.
www.atmos-chem-phys.org/acp/5/1/ Atmos. Chem. Phys., 5, 1–40, 2005
Fig. 7. Weather maps at 500 hPa for (a) 14 April (O3-South), (b) 8 April (Cold Surge) and (c) 24 April (O3-North) at 13:00 CDT. Thick blue lines for 500 hPa height, thin red lines for isotherms and wind vectors are shown.
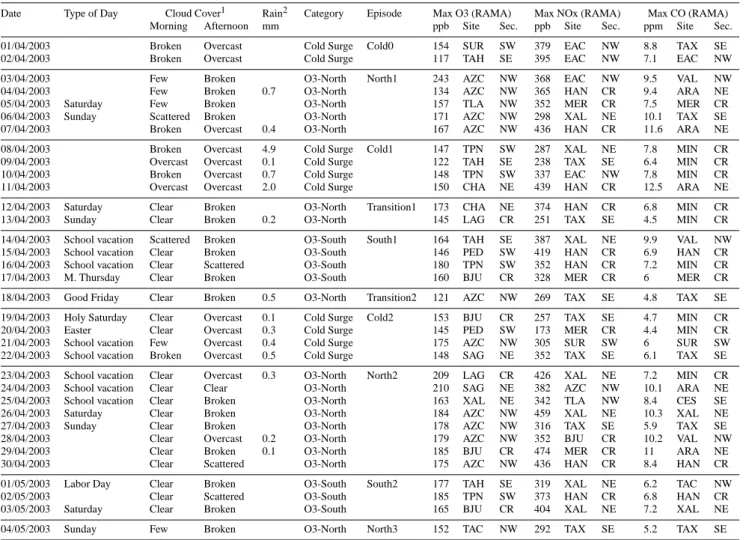
Table 1. Summary of MCMA-2003 field campaign days with classification by episode type.
Date Type of Day Cloud Cover1 Rain2 Category Episode Max O3 (RAMA) Max NOx (RAMA) Max CO (RAMA) Morning Afternoon mm ppb Site Sec. ppb Site Sec. ppm Site Sec. 01/04/2003 Broken Overcast Cold Surge Cold0 154 SUR SW 379 EAC NW 8.8 TAX SE 02/04/2003 Broken Overcast Cold Surge 117 TAH SE 395 EAC NW 7.1 EAC NW 03/04/2003 Few Broken O3-North North1 243 AZC NW 368 EAC NW 9.5 VAL NW 04/04/2003 Few Broken 0.7 O3-North 134 AZC NW 365 HAN CR 9.4 ARA NE 05/04/2003 Saturday Few Broken O3-North 157 TLA NW 352 MER CR 7.5 MER CR 06/04/2003 Sunday Scattered Broken O3-North 171 AZC NW 298 XAL NE 10.1 TAX SE 07/04/2003 Broken Overcast 0.4 O3-North 167 AZC NW 436 HAN CR 11.6 ARA NE 08/04/2003 Broken Overcast 4.9 Cold Surge Cold1 147 TPN SW 287 XAL NE 7.8 MIN CR 09/04/2003 Overcast Overcast 0.1 Cold Surge 122 TAH SE 238 TAX SE 6.4 MIN CR 10/04/2003 Broken Overcast 0.7 Cold Surge 148 TPN SW 337 EAC NW 7.8 MIN CR 11/04/2003 Overcast Overcast 2.0 Cold Surge 150 CHA NE 439 HAN CR 12.5 ARA NE 12/04/2003 Saturday Clear Broken O3-North Transition1 173 CHA NE 374 HAN CR 6.8 MIN CR 13/04/2003 Sunday Clear Broken 0.2 O3-North 145 LAG CR 251 TAX SE 4.5 MIN CR 14/04/2003 School vacation Scattered Broken O3-South South1 164 TAH SE 387 XAL NE 9.9 VAL NW 15/04/2003 School vacation Clear Broken O3-South 146 PED SW 419 HAN CR 6.9 HAN CR 16/04/2003 School vacation Clear Scattered O3-South 180 TPN SW 352 HAN CR 7.2 MIN CR 17/04/2003 M. Thursday Clear Broken O3-South 160 BJU CR 328 MER CR 6 MER CR 18/04/2003 Good Friday Clear Broken 0.5 O3-North Transition2 121 AZC NW 269 TAX SE 4.8 TAX SE 19/04/2003 Holy Saturday Clear Overcast 0.1 Cold Surge Cold2 153 BJU CR 257 TAX SE 4.7 MIN CR 20/04/2003 Easter Clear Overcast 0.3 Cold Surge 145 PED SW 173 MER CR 4.4 MIN CR 21/04/2003 School vacation Few Overcast 0.4 Cold Surge 175 AZC NW 305 SUR SW 6 SUR SW 22/04/2003 School vacation Broken Overcast 0.5 Cold Surge 148 SAG NE 352 TAX SE 6.1 TAX SE 23/04/2003 School vacation Clear Overcast 0.3 O3-North North2 209 LAG CR 426 XAL NE 7.2 MIN CR 24/04/2003 School vacation Clear Clear O3-North 210 SAG NE 382 AZC NW 10.1 ARA NE 25/04/2003 School vacation Clear Broken O3-North 163 XAL NE 342 TLA NW 8.4 CES SE 26/04/2003 Saturday Clear Broken O3-North 184 AZC NW 459 XAL NE 10.3 XAL NE 27/04/2003 Sunday Clear Broken O3-North 178 AZC NW 316 TAX SE 5.9 TAX SE 28/04/2003 Clear Overcast 0.2 O3-North 179 AZC NW 352 BJU CR 10.2 VAL NW 29/04/2003 Clear Broken 0.1 O3-North 185 BJU CR 474 MER CR 11 ARA NE 30/04/2003 Clear Scattered O3-North 175 AZC NW 436 HAN CR 8.4 HAN CR 01/05/2003 Labor Day Clear Broken O3-South South2 177 TAH SE 319 XAL NE 6.2 TAC NW 02/05/2003 Clear Scattered O3-South 185 TPN SW 373 HAN CR 6.8 HAN CR 03/05/2003 Saturday Clear Broken O3-South 165 BJU CR 404 XAL NE 7.2 XAL NE 04/05/2003 Sunday Few Broken O3-North North3 152 TAC NW 292 TAX SE 5.2 TAX SE
1Average of AERO METAR reports
2Average of afternoon (12:00–00:00) accumulated rain at GSMN, ENCB, AERO, TEZO and PIME
5 MCMA classification
The classification into 3 episode types was carried out sub-jectively from an analysis of the synoptic flow conditions. Table 1 lists all the days of the campaign with their group, cloudiness, rain, O3 and CO levels, showing the relevance
of the episodes to the basin atmospheric chemistry. There are 7 O3-South days, 10 Cold Surge days and 17 O3-North days making each episode type well represented during the campaign. Each of the three episode types lead to high pollu-tion events: O3-South days have a peak around 150 ppb O3,
with one day above 200 ppb, Cold Surge days have a broad distribution from 140 to 175 ppb and O3-North days have a narrower distribution around 170 ppb but with three days above 200 ppb.
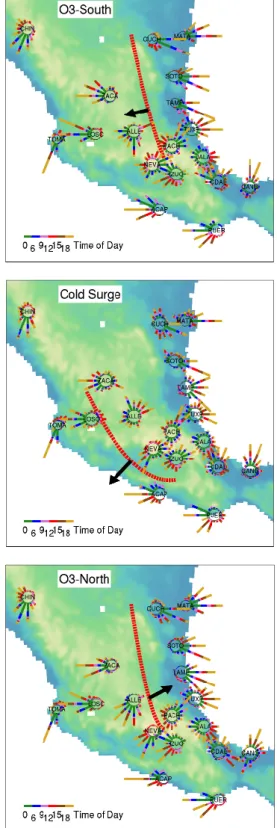
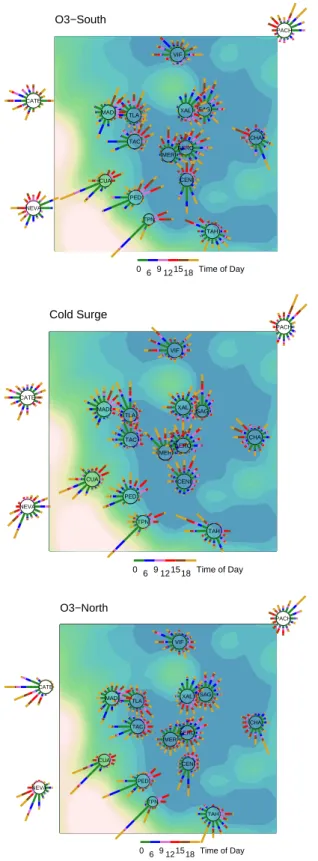
Two-dimensional maps of the maximum ozone for every-day of the campaign are shown in Fig. 18. The timing of the maximum differs based on the station and the day, and is
be-tween 12:00–18:00. These are arranged by episode type and show clearly high ozone levels in the south of the city for O3-South days, in the north for O3-North, and lower levels with a more even geographical distribution for Cold Surge. The variation within the episode types can be clearly seen. The Cold Surge category contains more variation than the others. Each Cold Surge event can be of different strength and in addition, each day of the Cold Surge has different features. O3-South events are most similar to each other, in particular because they all have low level of cloudiness. O3-North days have different levels of clouds and of wind strengths, leading to substantial variations in the ozone levels. They also in-clude transition days (e.g. 12, 13 and 18 April) that are less clearly defined than the others.
Figure 8 shows the wind rose for CENICA during the en-tire campaign. The preferred directions are from the north-east and south, but there is no clear relationship between the wind speed and direction, and no way of seeing the variation
B. de Foy et al.: Mexico City wind circulation 2275 5% 10% 15% N E S W 5% 0.50 1 23.5 5 m/s
(a) Wind Rose
0 3 6 9 12 15 18 21 24 S W N E S W N E Time of Day Wind Direction 0 3 6 9 12 15 18 21 24 0 1 2 3 4 5 6 Wind Speed (m/s)
(b) Wind Speed and Direction O3−South
Cold Surge O3−North
Fig. 8. (a) Wind rose for CENICA during MCMA-2003. Domi-nant wind direction is from the south with both stronger and calmer winds, secondary preferred direction from the north-north-east with medium winds. Diurnal variation of wind speed and direction (b) at CENICA segregated by episode type: red for O3-South, blue for Cold Surge and green for O3-North. Thick line indicates median value, thin lines show the 25 and 75 percentile (inter-quartile range), dotted lines show minimum and maximum values. Arrows show timing of wind shift for O3-North (15:00) and O3-South (20:00).
Atmos. Chem. Phys., 5, 1–40, 2005 www.atmos-chem-phys.org/acp/5/1/
Fig. 8. (a) Wind rose for CENICA during MCMA-2003. Dominant wind direction is from the south with both stronger and calmer winds, secondary preferred direction from the north-north-east with medium winds. Diurnal variation of wind speed and direction (b) at CENICA segregated by episode type: red for O3-South, blue for Cold Surge and green for O3-North. Thick line indicates median value, thin lines show the 25 and 75 percentile (inter-quartile range), dotted lines show minimum and maximum values. Arrows show timing of wind shift for O3-North (15:00) and O3-South (20:00).
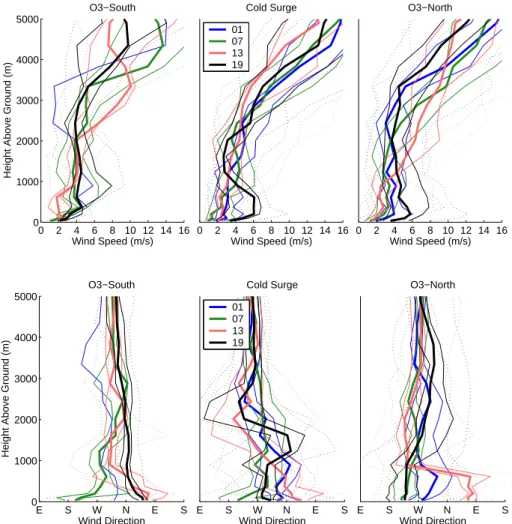
of the winds by time of day. Also shown in Fig. 8 are the diur-nal profile of wind speed and wind direction as median, upper and lower quartile and data range for each episode. For wind speed, there is a clear pattern that differs little between the episodes. Winds are below 2 m/s in the early morning, in-crease steadily from sunrise to speeds of 4 to 6 m/s at sunset and then decrease until about midnight. The wind direction is southerly in the early morning, shifting to northerly during the day and back to southerly at night. There is a sharp dif-ference between the episodes in the timing of the wind shift from northerly to southerly, highlighted by the arrows in the figure. O3-South days have a late shift to southerly between 18:00–21:00. The same shift exists on O3-North days but 3–6 h earlier, starting at 15:00. For Cold Surge days winds are more consistently from the north and north-west, with a gradual shift limited to the early hours of the morning. Be-cause traditional wind roses fail to capture the differences in these patterns, Fig. 9 shows a “Time rose” for each episode. Wind speed categories have been replaced by time of day cat-egories, showing the dominant wind direction for each time segment. These were selected to be 0–6, 6–9, 9–12, 12–15, 15–18 and 18–24: 3 h resolution during the day and 6 h at night when the variations are smaller. The distinctive feature of each episode can be clearly seen: northerly to southerly wind shift between 18:00–24:00 for O3-South, same shift but at 15:00 for O3-North and northerly winds for Cold Surge.
B. de Foy et al.: Mexico City wind circulation 25
5%10% 15% N E S W O3−South 5%10% 15% N E S W Cold Surge 5%10% 15% N E S W O3−North 0 6 9121518Time of Day
Fig. 9. “Time rose” for CENICA for South, Cold Surge and O3-North. Rose segments correspond to time of day as follows: green 00:00–6:00, blue 06:00–9:00, pink 09:00–12:00, red 12:00–15:00, brown 15:00–18:00 and tan 18:00–24:00.
www.atmos-chem-phys.org/acp/5/1/ Atmos. Chem. Phys., 5, 1–40, 2005
Fig. 9. “Time rose” for CENICA for South, Cold Surge and O3-North. Rose segments correspond to time of day as follows: green 00:00–6:00, blue 06:00–9:00, pink 09:00–12:00, red 12:00–15:00, brown 15:00–18:00 and tan 18:00–24:00.
These sharp differences suggest that this classification ac-counts for the main variability in basin observations. It will therefore be used in understanding the circulation in the MCMA and the manner it which it is influenced by the syn-optic flow. Once the circulation patterns associated with each episodes are established, they will help in the analysis of chemical measurements in the basin and provide a basis for organizing and averaging field campaign results.