HAL Id: hal-00302137
https://hal.archives-ouvertes.fr/hal-00302137
Submitted on 25 Sep 2006HAL is a multi-disciplinary open access
archive for the deposit and dissemination of sci-entific research documents, whether they are pub-lished or not. The documents may come from teaching and research institutions in France or abroad, or from public or private research centers.
L’archive ouverte pluridisciplinaire HAL, est destinée au dépôt et à la diffusion de documents scientifiques de niveau recherche, publiés ou non, émanant des établissements d’enseignement et de recherche français ou étrangers, des laboratoires publics ou privés.
Identification and classification of the formation of
intermediate ions measured in boreal forest
A. Hirsikko, T. Bergman, L. Laakso, M. Dal Maso, I. Riipinen, U. Hõrrak, M.
Kulmala
To cite this version:
A. Hirsikko, T. Bergman, L. Laakso, M. Dal Maso, I. Riipinen, et al.. Identification and classification of the formation of intermediate ions measured in boreal forest. Atmospheric Chemistry and Physics Discussions, European Geosciences Union, 2006, 6 (5), pp.9187-9212. �hal-00302137�
ACPD
6, 9187–9212, 2006 Identification of the formation of intermediate ions A. Hirsikko et al. Title Page Abstract Introduction Conclusions References Tables Figures J I J I Back CloseFull Screen / Esc
Printer-friendly Version
Interactive Discussion
EGU
Atmos. Chem. Phys. Discuss., 6, 9187–9212, 2006 www.atmos-chem-phys-discuss.net/6/9187/2006/ © Author(s) 2006. This work is licensed
under a Creative Commons License.
Atmospheric Chemistry and Physics Discussions
Identification and classification of the
formation of intermediate ions measured
in boreal forest
A. Hirsikko1, T. Bergman1, L. Laakso1, M. Dal Maso1, I. Riipinen1, U. H ˜orrak1,2, and M. Kulmala1
1
Department of Physical Sciences, University of Helsinki, P.O. Box 64, 00014 University of Helsinki, Finland
2
Institute of Environmental Physics, University of Tartu, ¨Ulikooli 18, 50090 Tartu, Estonia Received: 15 August 2006 – Accepted: 18 September 2006 – Published: 25 September 2006 Correspondence to: A. Hirsikko ([email protected])
ACPD
6, 9187–9212, 2006 Identification of the formation of intermediate ions A. Hirsikko et al. Title Page Abstract Introduction Conclusions References Tables Figures J I J I Back CloseFull Screen / Esc
Printer-friendly Version
Interactive Discussion
Abstract
We have measured the size distributions of air ions (0.42–7.5 nm in diameter) with the Balanced Scanning Mobility Analyzer in boreal forest, in Southern Finland since spring 2003. The size range covers the size range of cluster ions (approximately 0.42– 1.6 nm) and naturally charged nanometre aerosol particles (1.6–7.5 nm) or
intermedi-5
ate air ions. Based on the measurements from April 2003 to March 2006 we studied the characteristics of charged aerosol particle formation by classifying each day either as a particle formation event, undefined or non-event day. The principal of the classi-fication, as well as the statistical description of the charged aerosol particle formation events are given. We found in total 269 and 226 particle formation days for negative
10
and positive intermediate ions, respectively. For negatively charged particles we clas-sified 411 undefined and 349 non-event days whereas for positively charged particles 342 undefined and 461 non-event days. The results were compared with the ordi-nary classification based on Differential Mobility Particle Sizer (DMPS) measurements carried out at the same place. The above-presented values differed slightly from that
15
found from the DMPS data, with a lower particle diameter of 3 nm. In addition, we have found the rain-induced intermediate ion bursts frequently. The rain effect was detected on 163 days by means of negative ions and on 104 days by positive ones. Another in-teresting phenomenon among the charged aerosol particles was the appearance and existence of intermediate ions during the snowfall. We observed this phenomenon 24
20
times with negatively charged particles and 21 times with positively charged ones dur-ing winter months (October–April). These intermediate air ions were seen durdur-ing the snowfall and may be caused by ice crystals, although the origin of these intermediate ions is unclear at the moment.
ACPD
6, 9187–9212, 2006 Identification of the formation of intermediate ions A. Hirsikko et al. Title Page Abstract Introduction Conclusions References Tables Figures J I J I Back CloseFull Screen / Esc
Printer-friendly Version
Interactive Discussion
EGU
1 Introduction
Aerosol particles in the atmosphere, both the primary and secondary, influence our lives in various ways. Depending on the chemical composition many aerosol parti-cles are thought to be harmful to people’s health (e.g. Pope et al., 2002). In addition to health effects the particles affect for example the Earth’s radiation balance, cloud
5
dynamics and precipitation (Kaufman et al., 2002). For these reasons especially the formation and growth of secondary aerosol particles have recently been under inten-sive research (e.g. Kulmala et al., 2004b).
Dal Maso et al. (2005) have analysed eight years of the particle size distributions measured with the Differential Mobility Particle Sizer (DMPS) at the SMEAR II station
10
in Finland. They presented a detailed visual method for the distinction of the particle formation days from the days when there was no particle formation or generated new particles did not form a growing nucleation mode. The classification of days and ob-served new particle formation events enables us to further study the various properties of the forming secondary aerosol particles. Important properties to investigate are,
15
for instance, the formation and growth rates of the particles and chemical compounds associated in these processes (e.g. Boy et al., 2005; Dal Maso et al., 2005).
Aerosol particles can be either neutral or charged. In fair weather conditions the charge on the aerosol particles originates mainly from cluster ions: either the cluster ions have grown to intermediate ion size class by ion-induced formation mechanisms
20
or have attached to neutral aerosol particles (Israel, 1970). The charge is known to enhance the nucleation and condensation of the vapour molecules on clusters (Laakso et al., 2003b; Nadykto and Yu, 2003; Wilhelm et al., 2004). We have noticed that sometimes particle formation is observed only with the DMPS but not with the Balanced Scanning Mobility Analyzer (BSMA, manufactured by Airel Ltd., Estonia, see Tammet,
25
2004, 2006), which measures naturally charged aerosol particles smaller than 7.5 nm. On some other days the situation has been opposite and we have observed particle formation with the BSMA but not with the DMPS. However, all the intermediate ion
ACPD
6, 9187–9212, 2006 Identification of the formation of intermediate ions A. Hirsikko et al. Title Page Abstract Introduction Conclusions References Tables Figures J I J I Back CloseFull Screen / Esc
Printer-friendly Version
Interactive Discussion formation events have not been observed in both charge polarities. All the phenomena
related to air ions are not well known or even discovered at the moment. We have noticed some interesting changes in the particle size distributions when measuring with the ion spectrometers at different sites for example during rain and snowfall.
In this paper we introduce for the first time criteria that can be used to classify the
5
intermediate ion formation events. We have modified the classification criteria given by Dal Maso et al. (2005) and analysed three years of charged particle data measured with the BSMA during April 2003–March 2006. We also were interested in to find the effect of different phenomena (for example rain and snowfall) on the mobility distributions of intermediate ions and to find the frequency of the influence of such effects. Here we
10
will present the classification guidelines, the results of our analysis and compare them with the DMPS statistics, which have partly been published by Dal Maso et al. (2005).
2 Measurements and methods
In this study we utilised particle mobility and size distributions measured with the Bal-anced Scanning Mobility Analyzer (BSMA, manufactured by Airel Ltd., Estonia,
Tam-15
met, 2004, 2006) and the Differential Mobility Particle Sizer (DMPS) (Aalto et al., 2001). With the BSMA we obtained charged particle size distributions in the size range 0.42– 7.5 nm and with the DMPS we measured the size distributions of the charged and neutral particles starting at 3 nm.
We have been measuring particle size distributions with the BSMA at Hyyti ¨al ¨a
mea-20
suring station (61◦510N, 24◦170E, 181 m above sea level) in Southern Finland since March 2003, with the exception of two longer service breaks (about one month). The DMPS has been measuring continuously at Hyyti ¨al ¨a since January 1996. Both the BSMA and DMPS sampled air inside the forest. The inlet for the BSMA has been ap-proximately 2 m above the ground. The DMPS inlet has been at 2 m height until the
25
end of September 2004, after which it was moved at about 8 m height. The BSMA and DMPS were placed in different measurement cabins less than 100 m away from
ACPD
6, 9187–9212, 2006 Identification of the formation of intermediate ions A. Hirsikko et al. Title Page Abstract Introduction Conclusions References Tables Figures J I J I Back CloseFull Screen / Esc
Printer-friendly Version
Interactive Discussion
EGU
each other. The measuring site and the permanent instrumentation of the station are described in more detail by Vesala et al. (1998) and Kulmala et al. (2001).
2.1 BSMA
The BSMA (Balanced Scanning Mobility Analyzer) is an instrument developed to mea-sure the mobility distributions of small air ions and naturally charged nanometre
par-5
ticles (intermediate ions) in the range of 3.2–0.032 cm2 V−1s−1 (http://www.airel.ee/). Tammet (2004, 2006) has described the BSMA in detail; here we give only summarised description of the instrument. The device scans the mobility distributions of air ions and measures the natural air ion concentration of one polarity at a time with a plain type-differential mobility analyser. The instrument consists of two mobility analysers (one
10
for positive ions and the second for negative ions) and a common electrical amplifier, which are connected as a balanced bridge circuit. Inside each analyser there is one collecting element connected to common electrometer to measure the electrical current of air ions.
Sheath air is produced at the inlets of the analysers with the electro-filters (plates
15
connected either to the ground or high voltage). The plates form an inlet gate for the air ions. The middle part of the inlet gate is electronically controlled: the gate is closed or opened for the ions depending on the measuring cycle of the instrument. The BSMA measures sample air (inlet gate opened) and offset level of the measuring electrometer (inlet gate closed). Measuring algorithm calculates the mobility distributions based on
20
the sample air measurements and error in the distributions based on the offset level measurements. The air flow of the BSMA is high, 22 l s−1per analyser, to suppress the losses of the smallest air ions.
The measuring cycle of the BSMA was three minutes per polarity until 15 August 2005. During the three minutes five sample and four offset scans were performed. The
25
BSMA measured first the ions of one polarity and then the other polarity, for exam-ple first positive particles then negative ones. From the mid August 2005 the BSMA has been measuring in ten-minute-cycles where offset-level, positive and negative ion
ACPD
6, 9187–9212, 2006 Identification of the formation of intermediate ions A. Hirsikko et al. Title Page Abstract Introduction Conclusions References Tables Figures J I J I Back CloseFull Screen / Esc
Printer-friendly Version
Interactive Discussion mobility distributions are scanned in turns (see Tammet, 2006).
The measuring range of the BSMA is 3.2–0.032 cm2 V−1s−1 and mobility distribu-tions are obtained in 16 fracdistribu-tions. The corresponding size distribudistribu-tions, which we utilised here, were calculated for 10 fractions in the diameter range of 0.42–7.5 nm. In the size distribution calculations the limiting diameters for each fraction were
con-5
stant and corresponding (temperature and pressure dependent) mobilities were calcu-lated with the algorithm described by Tammet (1995) for each distribution. To reduce the temporal fluctuation of the data the three-minute data was averaged over 15 min, where as the ten-minute data was not further averaged. According to the manufacturer the concentration range of the BSMA is 0–40 000 cm−3for each mobility fraction, with
10
uncertainty of ±10 ions cm−3. 2.2 DMPS
We have measured aerosol particle size distributions with the DMPS-setup de-scribed by Aalto et al. (2001). Here we give only a summary of the utilized DMPS-instrumentation. The setup consists of two different DMPS-units, which have different
15
but partly overlapping measuring ranges. The first DMPS consists of 10.9-cm long Hauke-type differential mobility analyzer (DMA) and TSI 3025 condensation particle counter (CPC). The second setup is composed of 28-cm long DMA and TSI 3010 CPC. Aerosol is charged with 2 nCi Krypton-85 beta source before it is carried into the DMAs.
3 Criteria for the classification of the formation of intermediate air ions 20
Traditionally molecular ions and small charged particles, in practise all charged par-ticles that are smaller than about 1.6 nm in diameter, are called cluster ions (H ˜orrak et al., 1994, 2003). However, this boarder is rather conventional and the maximum cluster size can vary between 1.2–2.0 nm depending on the season, time of day and charge polarity of ions. Charged particles with the diameter between that of clusters
ACPD
6, 9187–9212, 2006 Identification of the formation of intermediate ions A. Hirsikko et al. Title Page Abstract Introduction Conclusions References Tables Figures J I J I Back CloseFull Screen / Esc
Printer-friendly Version
Interactive Discussion
EGU
and 7.5 nm are called intermediate ions (H ˜orrak et al., 2003). The intermediate air ions are either formed via ion-induced formation mechanisms or the cluster ions have attached on the neutrally nucleated particles.
One of the objectives of the present paper is to identify the formation days of in-termediate air ions and distinguish those days from unclear and non-event days. The
5
criteria for the classification of the charged particle size distribution data follow the guidelines described by Dal Maso et al. (2005) for the DMPS system. However, due to the nature of air ions (clusters and naturally charged particles) and the measuring range of the BSMA we cannot directly adopt the criteria of Dal Maso et al. (2005). Al-though the BSMA cannot measure particles with the diameters larger than 7.5 nm, we
10
obtain the size distributions down to molecular sizes, which enable us to identify also the particle formation events that were suppressed at very small sizes, like at 3–5 nm. These events cannot typically be detected with the DMPS (lower limit 3 nm) or only few particles that have grown to 5 nm have been observed with the DMPS.
According to new classification criteria, the intermediate air ion formation events
15
(later shortly events) were divided into two main classes I and II. A detailed description of these classes and subclasses is given in Table 1 and Fig. 1. In the first class we have the most representative events that we should be able to utilise when studying various event characteristics, like particle concentrations and growth rates in small size fractions during the event. The less representative events, those which we will have
20
difficulties to analyse further, belong into the class II.
The class I was further divided into three subclasses (Ia, Ib.1 and Ib.2), whereas Dal Maso et al. (2005) utilised only two subclasses Ia and Ib. The class-Ia events are the most representative event days, e.g. particularly suitable for case studies. The particles grow from cluster sizes over the measuring range of the BSMA and the number
con-25
centration of the particles in the new mode is typically high. The class-Ib events either grow from the cluster sizes but the growth is suppressed at some size (subclass Ib.1) or there is a gap in the size distribution between cluster and intermediate ions during the event but the particles grow over the BSMA range (subclass Ib.2). We wanted to
ACPD
6, 9187–9212, 2006 Identification of the formation of intermediate ions A. Hirsikko et al. Title Page Abstract Introduction Conclusions References Tables Figures J I J I Back CloseFull Screen / Esc
Printer-friendly Version
Interactive Discussion distinguish the latter events for the purposes of particle formation mechanism study.
We suppose that the gap in the size distribution is an indication of the dominance of the neutral formation mechanisms of particles contrary to ion-induced formation mech-anisms, when the gap in ion mobility/size distribution is filled by ions. However, we have to remind the reader that to draw more detailed conclusions about the particle
forma-5
tion mechanisms we need the exact calculations of the particle charging probability based on comparison of the data of different ion and particle measuring instruments (see Laakso et al., 2006). The events where the intermediate ion (1.6–7.5 nm) concen-trations seemed to increase as a function of size but there was no gap in the distribution were not classified into class Ib.2 but into class Ib.1 or II.
10
We collected the different types of uncertain and unclear days to class called unde-fined days (Table 1 and Fig. 2). We detected frequently two interesting phenomena in the charged particle size distributions: rain-induced intermediate ion bursts (H ˜orrak et al., 2005) and the existence of intermediate ions during snowfall. The rain-induced ion bursts are associated with the breaking of the water droplets into small negative
15
droplets and one large positive droplet. There are couple of mechanisms that could cause the phenomenon. Firstly, subsequent consecutive Rayleigh explosion and the evaporation of charged water droplets can result in the formation of particles in the in-termediate air ions (Gamero-Casta ˜no and Fern ´andez de la Mora, 2000a, b). Secondly, the charged nanometre particles could form by ion evaporation from charged raindrops
20
by the breaking or splashing of raindrops (Iribarne and Thomson, 1976). Due to the formation mechanisms of the rain-induced intermediate ions they could be multiple charged and particles with various sizes can have same mobilities and, therefore, con-tribute to the concentration of intermediate ions. However, the formation mechanisms of the charged particles during rain are not well known and understood.
25
The intermediate ions were sometimes observed during the snowfall. On one hand the intermediate ions were not observed to form a growing mode during the snowfall, as in the case of rain-induced intermediate ion bursts. On the other hand, the cause or formation mechanisms of this phenomenon are not known and are not discussed here
ACPD
6, 9187–9212, 2006 Identification of the formation of intermediate ions A. Hirsikko et al. Title Page Abstract Introduction Conclusions References Tables Figures J I J I Back CloseFull Screen / Esc
Printer-friendly Version
Interactive Discussion
EGU
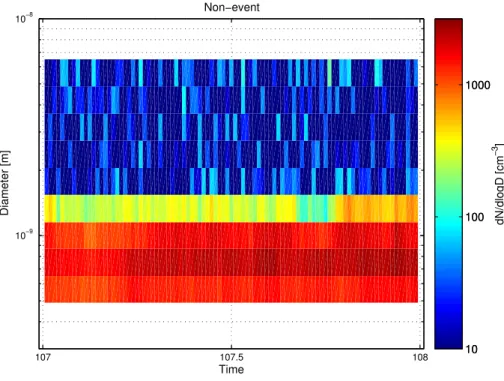
in detail. We have to note that the data of the BSMA was not typically stable during snowfall phenomenon and it may be difficult to study the phenomenon based on the BSMA data. However, each intermediate ion phenomena associated to snowfall was also observed with another kind of air ion spectrometer (AIS, Airel Ltd., see for example Laakso et al., 2004) which data was always stable during the snowfall. Non-event days
5
were such days when the cluster ions were the only particles that we observed in considerable concentrations by the BSMA (Fig. 3).
4 Results
Our main focus in this study was to identify and separate the intermediate air ion forma-tion event days from the other days. The results of the analysis are introduced below
10
and compared with the corresponding DMPS-findings. Statistics for the further classifi-cation of charged particle events are also discussed. Finally we report the frequency of the rain-induced ion bursts and the snowfall associated intermediate ion phenomenon. Periods with at least one day gap in either the DMPS or BSMA data were excluded from the analysis to make the statistics of event, undefined and non-event days
com-15
parable with each other. Longest measurement breaks with the BSMA were during August 2003 and March 2004. The DMPS had only single day breaks in measure-ments. Therefore we had 253, 335, 359 and 82 days to study for years from 2003 to 2006, respectively.
4.1 Event classification statistics: BSMA vs. DMPS
20
The main results of the analysis are collected to the Table 2. The number of event, undefined and non-event days of positive and negative as well as the whole aerosol population (charged and neutral) increased from year to year until 2006. These ob-servations are explained by the increase of available days in the analysis from 2003 to 2005. For that reason it is more illustrative to investigate the relative occurrence (the
ACPD
6, 9187–9212, 2006 Identification of the formation of intermediate ions A. Hirsikko et al. Title Page Abstract Introduction Conclusions References Tables Figures J I J I Back CloseFull Screen / Esc
Printer-friendly Version
Interactive Discussion percentage of analysed days) of the different types of days when comparing the
dif-ferences between studied years and various instruments. The relative appearance of the three types of days turned out to be nearly the same from year to year for positive and negative intermediate ions. However, the DMPS data displayed the decrease in the relative appearance of events each year, while the relative occurrence of non-event
5
days increased. In the first three months of 2006 the undefined and non-event days determined by both the BSMA and the DMPS data were dominant due to the annual cycle of the nucleation events in boreal forest (Dal Maso et al., 2005).
We observed typically more particle formation events with the DMPS than with the BSMA when comparing differences during each year (Table 2 and Fig. 4). Based on
10
the DMPS measurements some of the events become obvious at sizes (see Dal Maso et al., 2005) which are out of the BSMA’s measuring range and these events cannot be detected with the BSMA. On such days the particle formation has most likely oc-curred away from the measuring station and the particles that travelled with air masses had already grown. However, in 2005 and 2006 the number of event days based on
15
the DMPS measurements was smaller compared to the negatively charged particles. When comparing polarity differences, we observed more charged particle events and undefined days among the negatively charged particles than positively charged ones. Differences in the event rates of positive and negative ions indicate the importance of charge polarity in the particle formation, i.e. negatively charged particles seemed to be
20
involved in the particle formation more favourably (see for example Froyd and Lovejoy, 2003a, b; Lovejoy et al., 2004). The difference in the number of undefined days is partly explained by the different occurrence rates of rain-induced intermediate ion bursts (see more detailed description below).
We have found that the annual cycle of the charged particle events detected by the
25
BSMA followed the corresponding cycle based on the DMPS measurements with the exception of a couple of months (Fig. 4). Most of the events were detected between spring and autumn. The annual maximum for the non-event days occurred during winter time by both instruments. Dal Maso et al. (2005) had also observed that particle
ACPD
6, 9187–9212, 2006 Identification of the formation of intermediate ions A. Hirsikko et al. Title Page Abstract Introduction Conclusions References Tables Figures J I J I Back CloseFull Screen / Esc
Printer-friendly Version
Interactive Discussion
EGU
formation days are typically rare in boreal forest during winter. We observed a clear maximum of undefined days for charged particles between June and September, with an exception of the year 2003 when any clear maximum was not seen. The summer maximum of undefined days is caused mainly by rain-induced ion bursts and to some extent by operational ability of the BSMA, i.e. the measurement uncertainty increases
5
significantly in the case of high relative humidity and the dirty insulators (by pollen etc.) of the mobility analyser. For the DMPS data undefined days were more evenly distributed through the year.
What other reasons caused the differences in the numbers of events between pos-itive and negative intermediate ions and the whole aerosol population (charged and
10
neutral particles)? Firstly, some of the charged particle events, especially in winter (in February and March of 2005 and 2006), were suppressed at sizes of 3–5 nm and could not be detected with the DMPS because of the low steady-state charging probability of nanometre particles. We observed such days 21 times among negative ions and 6 times among positive ones. The demise of the particle formation event was probably
15
due to the low concentration of condensing vapours (e.g. H2SO4and organics) or rapid increase of condensation sink. Secondly, we have recently observed the relationship between particle formation mechanisms, neutral or ion-induced, to vary from day to day, which affects the amount of intermediate ions during particle formation (for exam-ple Laakso et al., 2006). The differences between positive and negative intermediate
20
ions indicate that conditions that led to the particle formation in Hyyti ¨al ¨a often favoured the negative particles (see also the next section). Thirdly, sometimes the resolution of the BSMA and the quality of the data led us to classify some of the days as undefined days. Only in the class II we may have some questionable events since sometimes the low concentration of charged particles may have caused misjudgement.
25
4.2 Differences between charge polarities
We have found two main differences when classifying the charged particle formation events (Table 3). Firstly, the class-Ia events were more frequent among the negative
ACPD
6, 9187–9212, 2006 Identification of the formation of intermediate ions A. Hirsikko et al. Title Page Abstract Introduction Conclusions References Tables Figures J I J I Back CloseFull Screen / Esc
Printer-friendly Version
Interactive Discussion intermediate ions. Secondly, the class-Ib.2 events were found to be more common
among the positive intermediate ions than for the negative ones. However, the class-Ib.2 days were altogether rare. The main reason for having only a few class-class-Ib.2 events is that we wanted to identify the days with a clear gap (concentration of ∼0 cm−3) be-tween clusters and new intermediate ion mode. The relative appearance of different
5
event types of all classified days (event+ non-event days) showed only a minor varia-tion from year to year (see Table 3). Excepvaria-tions were classes Ib and II for negatively charged particles. For the preceding, the relative occurrence increased as a function of time whereas for the latter it decreased.
Typically the negatively charged particle formation events had the same or higher
10
rank than corresponding events for positively charged particles on the same day. We found only a couple of exceptions. These observations support the fact that the en-vironmental conditions at Hyyti ¨al ¨a SMEAR station were often more favourable for the negatively charged particle formation.
4.3 Rain and snowfall associated intermediate air ions
15
Two special phenomena found among charged particles were rain and snowfall as-sociated intermediate ion bursts (see Fig. 2). When identifying the rain-induced ion bursts, we utilised information about precipitation measured with ARG-100 tipping bucket counter (Vector Instruments, Rhyl, Clwyd, UK, Laakso et al., 2003a) between the beginning of April and the end of October. During the other months there was a
20
high probability for the water measuring instrument to be frozen.
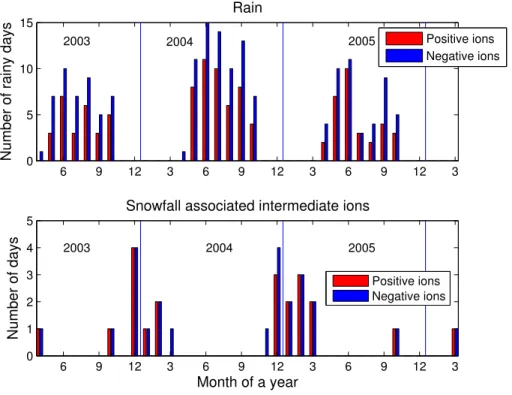
We observed rain-induced ion bursts among negative and positive intermediate ions on 163 and 105 days, respectively (Table 4 and Fig. 5). Depending on the raining conditions these bursts could be detected many times a day, even on the same day as particle formation was observed. During the three studied summers the highest
25
monthly number of days when the rain-induced ion bursts were observed was in June for the ions of both polarities, although the rate of rain-induced ion bursts depends on the amount and type of rain. We observed some (in total 11 and 42 with the positive
ACPD
6, 9187–9212, 2006 Identification of the formation of intermediate ions A. Hirsikko et al. Title Page Abstract Introduction Conclusions References Tables Figures J I J I Back CloseFull Screen / Esc
Printer-friendly Version
Interactive Discussion
EGU
and negative ions, respectively) rain-induced ion bursts also in each winter (November– February). However, they were left out from the Table 4 and Fig. 5, because we could not detect the raining reliably in winter.
We detected the intermediate ions associated to the snowfall in the negative and positive intermediate ion distributions on 24 and 21 days, respectively (Table 4 and
5
Fig. 5). This phenomenon was observed in winter months, between October and April. In December 2003 and 2004 we saw the phenomenon four times among negative intermediate ions, which was the maximum number during one month. For positive ions the corresponding maximum appearance rate was four per month also in December 2003. We have observed these intermediate ions during the snowfall and believe that
10
they could be caused by snowflake or hail originated particles and/or ice crystals. More information about the origin of these intermediate ions can be obtained by studying simultaneous measurements of ion size distributions and meteorological parameters like the type of snowfall together with theoretical approach.
5 Summary and conclusions
15
We analysed three years (from April 2003 to March 2006) of naturally charged particle size distributions measured with the BSMA in Hyyti ¨al ¨a, in order to identify the formation events of intermediate air ions. The particle formation event classification guidelines for the DMPS data proposed by Dal Maso et al. (2005) inspired us to classify the charged particle events in a similar manner to the different classes; on one hand to distinguish
20
between particle formation event days from non-event days and on the other hand the days with special characteristics.
We observed the differences in the frequency of particle formation events between positively and negatively charged particles measured by the BSMA and the whole aerosol population (charged and neutral) measured by the DMPS, which confirmed
25
our preliminary observations. In general, the percentage of particle formation event days per year during 2003–2005 was nearly constant: about 22–23% and 25–27%
ACPD
6, 9187–9212, 2006 Identification of the formation of intermediate ions A. Hirsikko et al. Title Page Abstract Introduction Conclusions References Tables Figures J I J I Back CloseFull Screen / Esc
Printer-friendly Version
Interactive Discussion based on positive and negative ion measurements, respectively. However, the
rela-tive number of particle formation events detected with the DMPS has been decreasing from 36% down to 23% during the same period. In each studied year we observed the charged particle formation events during which the particle growth was stopped at small sizes (around 3–5 nm). These kinds of charged particle formation events were
5
observed especially in February and March. The growth of the particles was thought to stop due to the low concentration of condensing vapours (e.g. H2SO4and organics) or rapid increase of condensation sink. Thus, with ion spectrometers we obtain infor-mation about the initial steps of the particle forinfor-mation and growth (see e.g. Kulmala et al., 2004a; Hirsikko et al., 2005).
10
In addition to differences in particle formation rates between charged particles and the whole aerosol population (charged and neutral) we observed charge polarity di ffer-ences. We found out that negatively charged particle formation events were typically more representative than the corresponding events for the positive particles. During the three years, there were in total 43 negatively charged particle events more than
15
positive ones. These results indicate that ambient conditions leading to particle forma-tion favoured negatively charged particles over the positive ones. Thus, charged par-ticle measurements can give extra information about the charging state of nanometre particles during particle formation. This valuable information together with the DMPS measurements can be used to study the different particle formation mechanisms.
20
We observed frequently two interesting phenomena, rain-induced intermediate ion bursts and intermediate ions during the snowfall in our study. H ˜orrak et al. (2005, 2006) have studied the formation of rain-induced intermediate ion bursts both in laboratory and in nature. The intermediate ions observed during the snowfall, however, need fur-ther analysis since their cause and the related ion formation mechanism are currently
25
somewhat unclear.
Acknowledgements. A. Hirsikko would like to acknowledge Maj and Tor Nessling foundation
for their financial support (grant 2006168). This work has in part been supported by Estonian Science foundation through grant 6223. The authors thank P. Aalto for his work with the DMPS
ACPD
6, 9187–9212, 2006 Identification of the formation of intermediate ions A. Hirsikko et al. Title Page Abstract Introduction Conclusions References Tables Figures J I J I Back CloseFull Screen / Esc
Printer-friendly Version
Interactive Discussion
EGU and the staff of SMEAR II station for maintaining the measurements. The authors would like to
acknowledge also T. Tuomi for discussion about ice electricity.
References
Aalto, P., H ¨ameri, K., Becker, E., Weber, R., Salm, J., M ¨akel ¨a, J. M., Hoell, C., O’Dowd, C. O., Karlsson, H., Hansson, H.-C., V ¨akev ¨a, M., Koponen, I. K., Buzorius, G., and Kulmala, M.: 5
Physical characterization of aerosol particles during nucleation events, Tellus, 53B, 344–358, 2001.
Boy, M., Kulmala, M., Ruuskanen, T. M., Pihlatie, M., Reissell, A., Aalto, P. P., Keronen, P., Dal Maso, M., Hellen, H., Hakola, H., Jansson, R., Hanke, M., and Arnold, F.: Sulphuric acid closure and contribution to nucleation mode particle growth, Atmos. Chem. Phys., 5, 10
863–878, 2005.
Dal Maso, M., Kulmala, M., Riipinen, I., Wagner, R., Hussein, T., Aalto, P. P., and Lehtinen, K. E. J.: Formation and growth of fresh atmospheric aerosols: eight years of aerosol size distri-bution data from SMEAR II, Hyyti ¨al ¨a, Finland, Boreal Environ. Res., 10, 323–336, 2005. Froyd, K. D. and Lovejoy, E. R.: Experimental Thermodynamics of Cluster Ions Composed of 15
H2SO4and H2O. 1. Positive Ions, J. Phys. Chem. A, 107, 9800–9811, 2003a.
Froyd, K. D. and Lovejoy, E. R.: Experimental Thermodynamics of Cluster Ions Composed of H2SO4and H2O. 2. Measurements and ab Initio Structures of Negative Ions, J. Phys. Chem. A, 107, 9812–9824, 2003b.
Gamero-Casta ˜no, M. and Fern ´andez de la Mora, J.: Direct measurement of ion evaporation 20
kinetics from electrified liquid surfaces, J. Chem. Phys., 113, 815–832, 2000a.
Gamero-Casta ˜no, M. and Fern ´andez de la Mora, J.: Mechanisms of electrospray ionisation of singly and multiply charged salt clusters, Analytica Chimica Acta, 406, 67–91, 2000b. Hirsikko, A., Laakso, L., H ¨orrak, U., Aalto, P. P., Kerminen, V.-M., and Kulmala, M.: Annual
and size dependent variation of growth rates and ion concentrations in boreal forest, Boreal 25
Environ. Res., 10, 357–369, 2005.
H ˜orrak, U., Iber, H., Luts, A., Salm, J., and Tammet, H.: Mobility spectrum of air ions at Tahkuse Observatory, J. Geophys. Res., 99, 10 697–10 700, 1994.
ACPD
6, 9187–9212, 2006 Identification of the formation of intermediate ions A. Hirsikko et al. Title Page Abstract Introduction Conclusions References Tables Figures J I J I Back CloseFull Screen / Esc
Printer-friendly Version
Interactive Discussion
ions of different mobility classes in a rural area, J. Geophys. Res., 108, 4653, doi:10.1029/2002JD003240, 2003.
H ˜orrak, U., Tammet, H., Aalto, P. P., Vana, M., Hirsikko, A., Laakso, L., and Kulmala, M.: Formation of charged nanometer aerosol particles associated with rainfall, Proceedings of European Aerosol Conference 2005, p. 606, 2005.
5
H ˜orrak, U., Tammet. H., Aalto, P. P., Vana, M., Hirsikko, A., Laakso, L., and Kulmala, M.: For-mation of Charged Nanometer Aerosol Particles Associated with Rainfall: Atmospheric Mea-surements and Lab Experiment, Proceedings of BACCI, NECC and FCoE activities 2005, Report Series in Aerosol Sciences, 81, 180–185, 2006.
Iribarne, J. V. and Thomson, B. A.: On the evaporation of small ions from charged droplets, J. 10
Chem. Phys., 64, 2287–2294, 1976.
Israel, H.: Atmospheric electricity, Israel Program for Scientific Translations, 1, Jerusalem, 1970.
Kaufman, Y. J., Tanr ´e, D., and Boucher, O.: A satellite view of aerosols in the climate system, Nature, 419, 215–223, 2002.
15
Kulmala, M., H ¨ameri, K., Aalto, P. P., M ¨akel ¨a, J. M., Pirjola, L., Nilsson, E. D., Buzorius, G., Rannik, ¨U., Dal Maso, M., Seidl, W., Hoffman, T., Janson, R., Hansson, H.-C., Viisanen, Y., Laaksonen, A., and O’Dowd, C. D.: Overview of the international project on biogenic aerosol formation in the boreal forest (BIOFOR), Tellus, 53B, 324–343, 2001.
Kulmala, M., Laakso, L., Lehtinen, K. E. J., Riipinen, I., Dal Maso, M., Anttila, T., Kerminen, 20
V.-M., H ¨orrak, U., Vana, M., and Tammet, H.: Initial steps of aerosol growth, Atmos. Chem. Phys., 4, 2553–2560, 2004a.
Kulmala, M., Vehkam ¨aki, H., Pet ¨aj ¨a, T., Dal Maso, M., Lauri, A., Kerminen, V.-M., Birmili, W., and McMurry, P. H.: Formation and growth rates of ultrafine atmospheric particles: A review of observations, J. Aerosol Sci., 35, 143–176, 2004b.
25
Laakso, L., Gr ¨onholm, T., Rannik, ¨U., Kosmale, M., Fiedler, V., Vehkam ¨aki, H., and Kulmala, M.: Ultrafine particle scavenging coefficients calculated from 6 years field measurements, Atmos. Environ., 37(25), 3605–3613, 2003a.
Laakso, L., Kulmala, M., and Lehtinen, K. E. J.: Effect of condensation rate enhancement factor on 3-nm (diameter) particle formation in binary ion-induced and homogeneous nucleation, J. 30
Geophys. Res., 108, 4574, doi:10.1029/2003JD003432, 2003b.
Laakso, L., Anttila, T., Lehtinen, K. E. J., Aalto, P. P., Kulmala, M., H ˜orrak, U., Paatero, J., Hanke, M., and Arnold, F.: Kinetic nucleation and ions in boreal particle formation events,
ACPD
6, 9187–9212, 2006 Identification of the formation of intermediate ions A. Hirsikko et al. Title Page Abstract Introduction Conclusions References Tables Figures J I J I Back CloseFull Screen / Esc
Printer-friendly Version
Interactive Discussion
EGU Atmos. Chem. Phys., 4, 2353–2366, 2004.
Laakso, L., Gagn ´e, S., Pet ¨aj ¨a, T., Hirsikko, A., Aalto, P., Kulmala, M., and Kerminen, V.-M.: Detecting charging state of ultra-fine particles: instrumental development and ambient mea-surements, Atmos. Chem. Phys. Discuss., 6, 6401–6429, 2006.
Lovejoy, E. R., Curtius, J., and Froyd, K. D.: Atmospheric ion-induced nucleation of sulphuric 5
acid and water, J. Geophys. Res., 109, D08204, doi:10.1029/2003JD004460, 2004.
Nadykto, A. and Yu, F.: Uptake of neutral polar vapour molecules by charged parti-cles: Enhancement due to dipole-charge interaction, J. Geophys. Res., 108(D23), 4717, doi:10.1029/2003JD003664, 2003.
Pope, C. A., Burnett, R. T., Thun, M. J., Calle, E. E., Krewski, D., Ito, K., and Thurston, G. D.: 10
Lung Cancer, Cardiopulmonary Mortality, and Long-term Exposure to Fine Particulate Air Pollution, J. American Medical Association, 287, 1132–1141, 2002.
Tammet, H.: Size and mobility of nanometer particles, clusters and ions, J. Aerosol Sci., 26, 459–475, 1995.
Tammet, H.: Balanced Scanning Mobility Analyzer, in: Proc. 16th International Conference on 15
Nucleation & Atmospheric Aerosols in Kyoto, 2004.
Tammet, H.: Continuous scanning of the mobility and size distribution of charged clusters and nanometer particles in atmospheric air and the Balanced Scanning Mobility Analyzer BSMA, Atmos. Res., in press, 2006.
Vesala, T., Haataja, J., Aalto, P., Altimir, N., Buzorius, G., Garam, E., H ¨ameri, K., Ilvesniemi, H., 20
Jokinen, V., Keronen, P., Lahti, T., Markkanen, T., M ¨akel ¨a, J. M., Nikinmaa, E., Palmroth, S., Palva, L., Pohja, T., Pumpanen, J., Rannik, ¨U., Siivola, E., Ylitalo, H., Hari, P., and Kulmala, M.: Long-term field measurements of atmosphere-surface interactions in boreal forest com-bining forest ecology, micrometeorology, aerosol physics and atmospheric chemistry, Trends in Heat, Mass and Momentum Transfer, 4, 17–35, 1998.
25
Wilhelm, S., Eichkorn, S., Wiedner, D., Pirjola, L., and Arnold, F.: Ion-induced aerosol formation: new insights from laboratory measurements of mixed cluster ions HSO−4(H2SO4)a(H2O)wand
ACPD
6, 9187–9212, 2006 Identification of the formation of intermediate ions A. Hirsikko et al. Title Page Abstract Introduction Conclusions References Tables Figures J I J I Back CloseFull Screen / Esc
Printer-friendly Version
Interactive Discussion
Table 1. The classification of different intermediate ion formation events/non-events based on
the BSMA data.
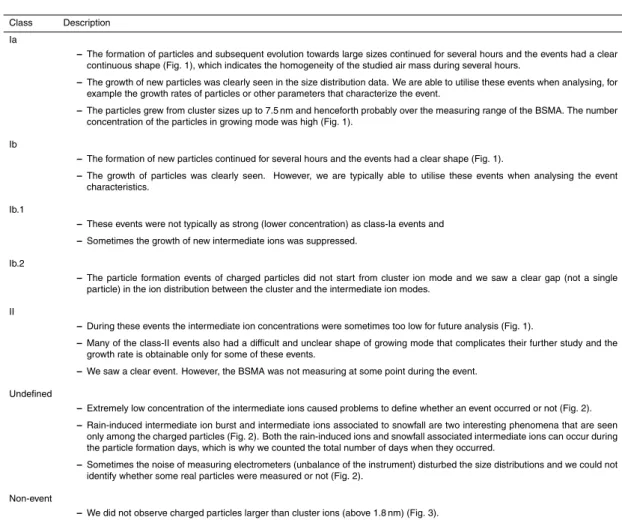
Class Description Ia
– The formation of particles and subsequent evolution towards large sizes continued for several hours and the events had a clear
continuous shape (Fig. 1), which indicates the homogeneity of the studied air mass during several hours.
– The growth of new particles was clearly seen in the size distribution data. We are able to utilise these events when analysing, for
example the growth rates of particles or other parameters that characterize the event.
– The particles grew from cluster sizes up to 7.5 nm and henceforth probably over the measuring range of the BSMA. The number
concentration of the particles in growing mode was high (Fig. 1). Ib
– The formation of new particles continued for several hours and the events had a clear shape (Fig. 1).
– The growth of particles was clearly seen. However, we are typically able to utilise these events when analysing the event
characteristics. Ib.1
– These events were not typically as strong (lower concentration) as class-Ia events and – Sometimes the growth of new intermediate ions was suppressed.
Ib.2
– The particle formation events of charged particles did not start from cluster ion mode and we saw a clear gap (not a single
particle) in the ion distribution between the cluster and the intermediate ion modes. II
– During these events the intermediate ion concentrations were sometimes too low for future analysis (Fig. 1).
– Many of the class-II events also had a difficult and unclear shape of growing mode that complicates their further study and the growth rate is obtainable only for some of these events.
– We saw a clear event. However, the BSMA was not measuring at some point during the event.
Undefined
– Extremely low concentration of the intermediate ions caused problems to define whether an event occurred or not (Fig. 2). – Rain-induced intermediate ion burst and intermediate ions associated to snowfall are two interesting phenomena that are seen
only among the charged particles (Fig. 2). Both the rain-induced ions and snowfall associated intermediate ions can occur during the particle formation days, which is why we counted the total number of days when they occurred.
– Sometimes the noise of measuring electrometers (unbalance of the instrument) disturbed the size distributions and we could not
identify whether some real particles were measured or not (Fig. 2). Non-event
ACPD
6, 9187–9212, 2006 Identification of the formation of intermediate ions A. Hirsikko et al. Title Page Abstract Introduction Conclusions References Tables Figures J I J I Back CloseFull Screen / Esc
Printer-friendly Version
Interactive Discussion
EGU
Table 2. Comparison between the total numbers of particle formation event, undefined and
non-event days measured with the BSMA and DMPS during three years between April 2003 and March 2006. The total number of analysed days was 253, 335, 359 and 82 for years from 2003 to 2006, respectively. The percentage of event, undefined and non-event days from the analysed (i.e. event+ undefined + non-event days) days is presented in parentheses.
Year BSMA+ BSMA − DMPS
Event days 2003 59 (23) 67 (27) 92 (36) 2004 77 (23) 85 (25) 99 (29) 2005 80 (22) 96 (27) 83 (23) 2006 10 (12) 21 (26) 13 (16) Undefined days 2003 79 (31) 104 (41) 106 (42) 2004 122 (37) 138 (41) 146 (44) 2005 130 (36) 153 (42) 157 (44) 2006 11 (14) 16 (19) 39 (47) Non-event days 2003 115 (46) 82 (32) 55 (22) 2004 136 (40) 112 (34) 90 (27) 2005 149 (42) 110 (31) 119 (33) 2006 61 (74) 45 (55) 30 (37)
ACPD
6, 9187–9212, 2006 Identification of the formation of intermediate ions A. Hirsikko et al. Title Page Abstract Introduction Conclusions References Tables Figures J I J I Back CloseFull Screen / Esc
Printer-friendly Version
Interactive Discussion
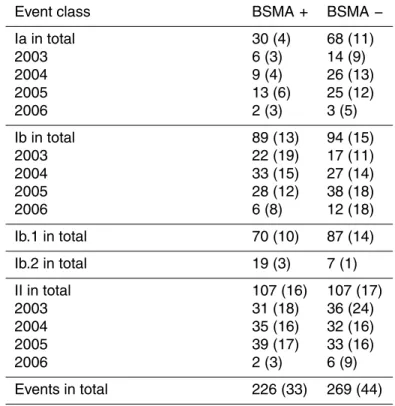
Table 3. Statistics for positively and negatively charged particle formation events during April
2003–March 2006. Both the total number of the different types of events during three years and the annual number of these events are presented. In parentheses the percentage from the classified days (i.e. events+ non-events) is indicated. The percentages are calculated for the total number of events from the total classified days, where as for the annual number of events from the corresponding classified days.
Event class BSMA+ BSMA −
Ia in total 30 (4) 68 (11) 2003 6 (3) 14 (9) 2004 9 (4) 26 (13) 2005 13 (6) 25 (12) 2006 2 (3) 3 (5) Ib in total 89 (13) 94 (15) 2003 22 (19) 17 (11) 2004 33 (15) 27 (14) 2005 28 (12) 38 (18) 2006 6 (8) 12 (18) Ib.1 in total 70 (10) 87 (14) Ib.2 in total 19 (3) 7 (1) II in total 107 (16) 107 (17) 2003 31 (18) 36 (24) 2004 35 (16) 32 (16) 2005 39 (17) 33 (16) 2006 2 (3) 6 (9) Events in total 226 (33) 269 (44)
ACPD
6, 9187–9212, 2006 Identification of the formation of intermediate ions A. Hirsikko et al. Title Page Abstract Introduction Conclusions References Tables Figures J I J I Back CloseFull Screen / Esc
Printer-friendly Version
Interactive Discussion
EGU
Table 4. The number of the days of two special phenomena: snowfall associated intermediate
ion phenomenon and rain-induced ion bursts. The statistics for the rain-induced bursts are only for periods April–October.
Year BSMA+ BSMA −
Rain-induced ion burst, total 105 163
2003 27 46
2004 47 71
2005 31 46
2006 0 0
Snowfall effect, total 21 24
2003 6 6
2004 6 9
2005 8 8
ACPD
6, 9187–9212, 2006 Identification of the formation of intermediate ions A. Hirsikko et al. Title Page Abstract Introduction Conclusions References Tables Figures J I J I Back CloseFull Screen / Esc
Printer-friendly Version Interactive Discussion 68 68.5 69 10−9 10−8 Diameter [m] Ia 88 88.5 89 10−9 10−8 Diameter [m] Time Ib.2 96 96.5 97 Ib.1 262 262.5 263 Time II 10 100 1000 dN/dlogD [cm −3 ]
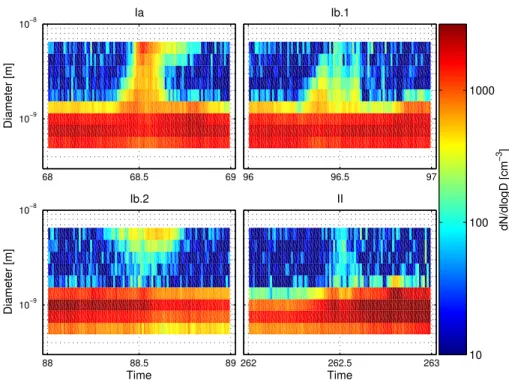
Fig. 1. The examples of the different types of intermediate ion formation events: The class Ia
(top left panel), class Ib.1 (top right panel), class Ib.2 (bottom left panel) and class II (bottom right panel).
ACPD
6, 9187–9212, 2006 Identification of the formation of intermediate ions A. Hirsikko et al. Title Page Abstract Introduction Conclusions References Tables Figures J I J I Back CloseFull Screen / Esc
Printer-friendly Version Interactive Discussion EGU 285 285.5 286 10−9 10−8 Diameter [m] Rain−induced ions 95 95.5 96 10−9 10−8 Diameter [m] Time Snowfall effect 301 301.5 302 Bad data 86 86.5 87 Time Uncertain day 10 100 1000 10 100 1000 dN/dlogD [cm −3 ]
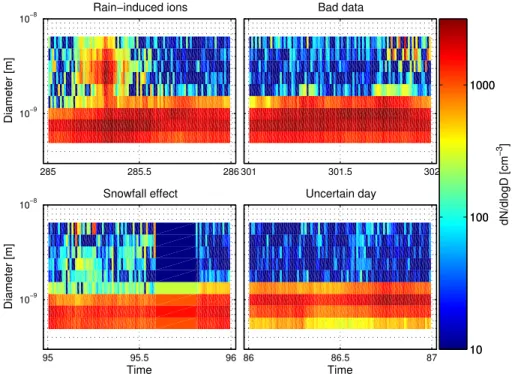
Fig. 2. The examples of undefined days: rain induced intermediate ions (top left panel), the
bad data: the concentration of intermediate air ions increased due to the instrumental noise of the BSMA (top right panel), intermediate ions associated to snowfall (bottom left panel) and unclear case, when whether a very weak event was detected in the afternoon or not (bottom right panel).
ACPD
6, 9187–9212, 2006 Identification of the formation of intermediate ions A. Hirsikko et al. Title Page Abstract Introduction Conclusions References Tables Figures J I J I Back CloseFull Screen / Esc
Printer-friendly Version Interactive Discussion 107 107.5 108 10−9 10−8 Diameter [m] Time Non−event 10 100 1000 10 100 1000 dN/dlogD [cm −3 ]
ACPD
6, 9187–9212, 2006 Identification of the formation of intermediate ions A. Hirsikko et al. Title Page Abstract Introduction Conclusions References Tables Figures J I J I Back CloseFull Screen / Esc
Printer-friendly Version Interactive Discussion EGU 6 9 12 3 6 9 12 3 6 9 12 3 0 0.1 0.2 0.3 0.4 0.5 0.6 0.7 0.8 0.9
Fraction of analysed days
Month of a year 2005 2004 2003 30 27 29 27 18 30 31 30 31 30 29 9 30 30 30 31 30 30 28 28 31 31 28 31 30 31 30 30 31 30 31 30 26 24 28 30 only BSMA only DMPS Both
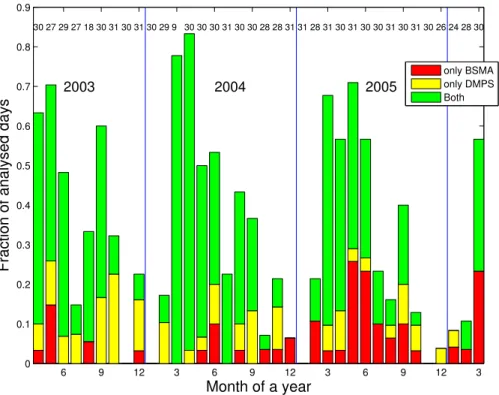
Fig. 4. Monthly differences in the occurrence of simultaneous and non-simultaneous particle
formation events (the number of events per analysed days in each month) based on the BSMA and DMPS measurements. Red colour indicates the fraction of days when only the BSMA measured intermediate ion (either positive or negative) formation, yellow colour indicates the fraction of days when only the DMPS measured particle formation. Green colour presents the fraction of days when both the BSMA and DMPS measured particle formation. The number of analysed days in each month is given in the upper part of the figure.
ACPD
6, 9187–9212, 2006 Identification of the formation of intermediate ions A. Hirsikko et al. Title Page Abstract Introduction Conclusions References Tables Figures J I J I Back CloseFull Screen / Esc
Printer-friendly Version Interactive Discussion 6 9 12 3 6 9 12 3 6 9 12 3 0 5 10 15 Rain
Number of rainy days
2005 2004 2003 6 9 12 3 6 9 12 3 6 9 12 3 0 1 2 3 4
5 Snowfall associated intermediate ions
Number of days Month of a year 2005 2004 2003 Positive ions Negative ions Positive ions Negative ions
Fig. 5. The annual rate of days when rain-induced ion bursts (top panel) and intermediate ions