Annals of Oncology 22 (Supplement 4): iv44–iv46, 2011 doi:10.1093/annonc/mdr172
VI. DNA microarray technology. Principles and
application to the analysis of malignant tumours (with
special emphasis on lymphoma)
M. F. Fey
Medical Oncology, University and Inselspital Bern, Bern, Switzerland from ‘Molecular Biology of Cancer’. In Cavalli, Kaye, Hansen, Armitage and Piccart-Gebhart (eds), Textbook of Medical Oncology, 4th edition, Boca Raton: Informa 2009
The human genome sequence is now available, virtually complete. Why should oncologists bother about this data bank? Until now most research in molecular carcinogenesis has been directed at discovering and characterizing single ‘cancer’ genes. Virtually all established diagnostic techniques in molecular cancer pathology suffer from the limitation that they only tell us what we are specifically looking for. It may well be that a chosen molecular marker may be less relevant than another one which was not ordered by the clinician, or was not considered by the pathologist. Colon cancer is a nice example to illustrate this issue. For example, patients with stage III colon cancer seem to derive more benefit from adjuvant therapy if their tumours retain a wild-type K-ras sequence [1, 2]. Interestingly, colon cancer with a wild-type K-ras status will also derive particular benefit from epidermal growth factor receptor (EGFR)-targeted treatment. Colon cancers with microsatellite instability may be less aggressive than tumours with stable microsatellites. Retention of 18q alleles in microsatellite-stable tumours, and mutations of the gene for type II TGF-b1 receptor in node-positive microsatellite-instable colon cancers both point to a more favourable prognosis after adjuvant chemotherapy. A glance at this literature shows that in most papers the molecular marker of interest was carefully studied, and one or the other additional gene included in the analysis, but no such study provided an overall appraisal of all molecular markers of potential clinical value in this cancer. The established molecular diagnostic techniques are mostly too laborious to permit the comprehensive screening of a tumour biopsy sample for all possible types of genetic marker.
A new approach would be to screen cancer specimens for all possible ‘gene’ problems, i.e. to obtain individual comprehensive cancer gene expression profiles, at the RNA expression level (also known as ‘signatures’). This is now possible with microarray gene profiling [3, 4]. In contrast to the study of single genes and their proteins, molecular tumour profiling is a large-scale analysis of gene expression in a tumour using DNA microarrays (Figure 1). DNA microarrays typically consist of rows and rows of oligonucleotide sequence strands, or cDNA sequences lined up in dots on a silicon chip or glass slide [3–6]. Oligonucleotide sequences or cDNAs on the chip permit specific hybridization to labelled mRNAs of interest extracted from a biopsy. Arrays can
accommodate up to 30 000 specific sequences on a single chip, either chosen randomly or deliberately ‘biased’ to represent theme parks of genes typically expressed in a cell type of interest, e.g. ‘lymphoid genes’ in B cells (‘Lymphochip’) [6].
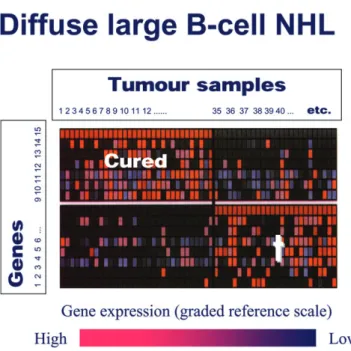
The Lymphochip is a cDNA microarray containing selected genes preferentially expressed in lymphoid cells [7, 8]. Analysis of gene expression in various lymphoid malignancies yields an orderly picture of gene expression patterns in particular types of lymphoma, reflecting lineage characteristics, stage of maturation of lymphoid cells and proliferation signatures. Diffuse large B-cell lymphoma (DLBCL, a clinically
heterogeneous group of lymphomas despite their morphological similarity) can be split into subtypes with gene expression profiles typical either of germinal centre B cells, or of activated B cells. DLBCL expression signatures differ markedly between patients who were cured, and those who eventually relapsed [8]. The promise is that such expression profiles or ‘signatures’ offer more precise prognostic information than established prognostic factors, such as the International Prognostic Index in NHL (Figure 2), and eventually translate into concepts of refined differentially targeted therapy.
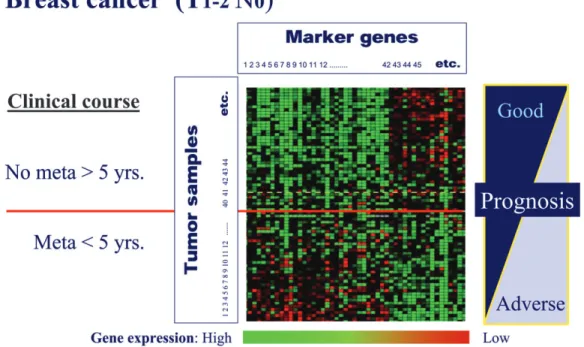
Likewise, one invasive ductal breast cancer specimen may look deceptively similar to another one on histology, but the fate of the two women may be totally different. This is due to inherent biological differences of the two tumours hidden in their genome, which may be elusive to morphological examination. Variation in gene transcription programmes governed by specific somatic gene alterations accounts for much of the biological diversity in human tumours. The study of gene expression patterns in human breast cancer specimens displays distinct molecular portraits, or gene expression profiles providing molecular ‘fingerprints’ [9]. Tumours may be clustered by sharing gene expression patterns, and it is likely that such subgroups comprise clinically distinct subtypes or entities of breast cancer. It also turns out that the overall gene expression pattern of a breast cancer case is by and large retained in its metastases. Figure 2 shows an analysis where T1– 2 N0 tumours that had or had not relapsed within 5 years after diagnosis and primary treatment, show clearly distinct gene expression profiles, respectively. Breast cancers of the basal-like cell type, which often express neither hormone receptors nor
ªThe Author 2011. Published by Oxford University Press on behalf of the European Society for Medical Oncology. All rights reserved. For permissions, please email: journals.permissions@oup.com
Figure 2. Microarray analysis of DLBCL. About half of patients with diffuse DLBCL are cured with CHOP-type chemotherapies, and the other half relapse and often die from their disease. Although a number of clinicopathological parameters are available to create prognostic subgroups (International Prognostic Index), clinical and pathological information is inadequate for a neat distinction of these two subgroups. In this example, cases either cured or cases with an eventually fatal outcome were studied for their gene expression profiles. It turns out that DLBCL with a good prognosis display a gene expression signature that is clearly different from the profile that lights up in lymphoma cells from eventually fatal cases. Although the microarrays used in this experiment offered thousands of genes for analysis, a neat prognostic distinction of the two clinical DLBCL subgroups can be made with a restricted and selected group of genes (horizontal rows), in fact no more than 15 genes (modified after [8] with permission).
Figure 1. Gene expression profiling of tumours with cDNA microarrays or ‘chips’. The chip is a small flat box (upper left) which in a rectangular chamber contains a siliconized surface loaded with single-strand nucleic acid sequences (lower left). These sequences represent either short specific oligonucleotides or cDNA prepared from mRNA of various cells. Specific sequences are neatly arranged in rows and columns, and are ready for hybridization with a sample composed of labelled single-stranded cRNA. A single chip may contain up to several 10 000 such sequences [representing genes, or so-called expressed sequence tags (ESTs)]. After hybridization the chip surface can be read, and the results expressed as quantitative estimates of gene expression, with respect to a scale of reference (bottom centre). In this example mRNA from tumour 1 has been examined with the help of the chip. Gene A is overexpressed in this sample (red), and gene B is not expressed at all (blue). Tumour 3 shows the reverse gene expression pattern, and the other samples all show distinct gene expression profiles. These raw data are then sorted by a number of strategies. Unsupervised clustering (explained in a terribly simplified fashion!) refers to a programme that groups tumour samples according to similar or completely distinct expression profiles. In supervised clustering, additional information on the samples is fed in before sorting, e.g. some clinical information. In the end a limited number of genes can be pulled from such profiles which distinguish one subgroup of tumours from another one.
Annals of Oncology
VI. Clinical interest in DNA
HER2 (‘triple-negative breast cancer’) cannot be readily identified by histology, but exhibit specific gene expression profiles detectable on microarray analysis [10].
A few words of caution on the chip technology are warranted. Currently, molecular diagnostics with DNA microarrays do not displace time-honoured diagnostic tools such as morphology and related techniques, as the demands on bioinformatics to handle the impressive data flow are
considerable, and costs still excessive [3, 5]. The clinical relevance of this technology and the new data it creates will undoubtedly need to be refined, and tested in appropriate clinical trials. Although global gene expression profiling of cancers with the DNA chip technology is now a reality, the detailed characterization of single genes and their proteins with a possible role in the molecular pathology of cancers is far from being old hat. New strategies to detect and characterize human proteins in biological material (including clinical specimens) are now mandatory and indeed on the horizon. As a concept, proteomics is on the road to providing a new wave of fascinating data with a great potential for cancer medicine, since, similar to cDNA microchips, proteomic analysis provides a survey of protein production in a tumour specimen, hence specific protein production signatures.
references
1. Steeg PS, Abrams JS. Cancer prognostics: past, present and p27. Nat Med 1997; 3: 152–154.
2. Ahnen DJ, Feigl P, Quan G et al. Ki ras mutation and p53 mutation overexpression predict the clinical behaviour of colorectal cancer: a Southwest Oncology Group Study. Cancer Res 1998; 58: 1149–1158.
3. Fey MF. Impact of the Human Genome Project on the clinical management of sporadic cancers. Lancet Oncol 2002; 3: 349–356.
4. Quackenbush J. Microarray analysis and tumor classification. N Engl J Med 2006; 354: 2463–2472.
5. Sotiriou C, Piccart MJ. Taking gene-expression profiling to the clinic: when will molecular profile signatures become relevant for patient care? Nat Rev Cancer 2007; 7: 545–553.
6. Staudt L. Molecular diagnosis of the hematologic cancers. N Engl J Med 2003; 348: 1777–1785.
7. Alizadeh AA, Eisen MB, Davis RE. Distinct types of diffuse large B-cell lymphoma identified by gene expression profiling. Nature 2000; 403: 503–511.
8. Shipp MA, Ross KN, Tamayo P et al. Diffuse large B-cell lymphoma outcome predicted by gene-expression profiling and supervised machine learning. Nat Med 2002; 8: 68–74.
9. van ‘t Veer LJ, Dai H, van de Vijver MJ et al. Gene expression profiling predicts clinical outcome of breast cancer. Nature 2002; 415: 530–536.
10. Rakha EA, Reis-Filho JS, Ellis IO. Basal-like breast cancer: a critical review. J Clin Oncol 2008; 26: 2568–81.
Figure 3. cDNA microchip analysis (so-called supervised classification on prognosis gene expression signatures) of samples from women with early node-negative breast cancer. In this example, tumour tissue samples from women with T1–2 N0 stage early breast cancer were analysed with microarrays. For data analysis, cases were split into those who remained disease free for at least 5 years, and those who relapsed within 5 years after diagnosis and primary treatment (so-called supervised clustering analysis of chip data). The established clinical and biological prognostic parameters in breast cancer (T stage, N stage, receptor status, etc.) did not permit prediction with any accuracy of which women would remain disease free or relapse. In the molecular analysis, genes have been ordered according to their correlation with the two clinical prognostic patient groups. The microchip analysis lights up gene expression profiles that clearly differ between tumours treated successfully, and those cases that had relapsed within 5 years after diagnosis. In women with no evidence of metastases after 5 years of follow-up, genes with low expression cluster to the upper left of the panel (lighting up in green), and overexpressed genes (depicted in red) are grouped in the upper right sector of the panel. The reverse pattern or expression profile is seen in the group of women who relapsed (modified after [9] with permission).