HAL Id: tel-02497667
https://tel.archives-ouvertes.fr/tel-02497667
Submitted on 3 Mar 2020
HAL is a multi-disciplinary open access
archive for the deposit and dissemination of
sci-entific research documents, whether they are
pub-lished or not. The documents may come from
teaching and research institutions in France or
abroad, or from public or private research centers.
L’archive ouverte pluridisciplinaire HAL, est
destinée au dépôt et à la diffusion de documents
scientifiques de niveau recherche, publiés ou non,
émanant des établissements d’enseignement et de
recherche français ou étrangers, des laboratoires
publics ou privés.
and Means
Pierre Le Mouël
To cite this version:
Pierre Le Mouël. Macroeconomic evaluation of EU R&I Policies : ways and Means. Economics and
Finance. Université Côte d’Azur, 2019. English. �NNT : 2019AZUR0008�. �tel-02497667�
L
’évaluation Macroéconomique des
Politiques de R&I de
l’UE :
L
’Art et la Manière
Pierre LE MOUËL
Laboratoire GREDEG
Présentée en vue de l’obtention
du grade de docteur en sciences économiques
d
’Université Côte d’Azur
Dirigée par : Jean-Luc Gaffard
Soutenue le : 29 novembre 2019
Devant le jury, composé de :
Michele Cincera, Professeur,
Université Libre de Bruxelles (ULB)
Jean-Luc Gaffard, Professeur émérite,
Université Côte d’Azur
Pierre Mohnen, Professeur,
Université de Maastricht
Lionel Nesta, Professeur,
Université Côte d’Azur
Patrick Sevestre, Professeur,
Université d’Aix-Marseille
Paul Zagamé, Professeur émérite,
Directeur scientifique de SEURECO
Politiques de R&I de l’UE : L’Art et la
Mani`
ere
Jury:
❼ Directeur de th`ese :
– Jean-Luc Gaffard, Professeur ´em´erite, Universit´e Cˆote d’Azur ❼ Rapporteurs :
– Pierre Mohnen, Professeur, Universit´e de Maastricht
– Michele Cincera, Professeur, Universit´e Libre de Bruxelles (ULB) ❼ Examinateurs
– Paul Zagam´e, Professeur ´em´erite, Directeur scientifique de SEURECO – Lionel Nesta, Professeur, Universit´e Cˆote d’Azur
Policies: Ways and Means
Jury:
❼ Thesis director:
– Jean-Luc Gaffard, Professeur ´em´erite, Universit´e Cˆote d’Azur ❼ Rapporteurs:
– Pierre Mohnen, Professeur, Universit´e de Maastricht
– Michele Cincera, Professeur, Universit´e Libre de Bruxelles (ULB) ❼ Examiners:
– Paul Zagam´e, Professeur ´em´erite, Directeur scientifique de SEURECO – Lionel Nesta, Professeur, Universit´e Cˆote d’Azur
R´esum´e : Cette th`ese de doctorat d´ecrit les m´ecanismes de R&I que les mod`eles macro´economiques QUEST III, NEMESIS et RHOMOLO int`egrent, et comment ces mod`eles sont utilis´es pour ´evaluer les politiques de R&I qui sont introduites par la Direction G´en´erale de la R&I de la Commission Europ´eenne.
QUEST III, NEMESIS et RHOMOLO sont des mod`eles appartenant `a diff´erentes traditions ´eco-nomiques, avec ´egalement diff´erents niveaux de d´etail. QUEST est un mod`ele d’´Equilibre G´en´eral Dynamique Stochastique (DSGE), le plus en accord avec les canons de la th´eorie macro-´economique moderne. Il y a un mod`ele pour chacun des pays de l’UE(28), avec des fondements micro-´economiques d´eriv´es explicitement de la maximisation intertemporelle des profits et de l’utilit´e sous l’hypoth`ese d’an-ticipations parfaites. NEMESIS est comme QUEST, un mod`ele pour chacun des pays de l’UE, mais les deux mod`eles diff`erent profond´ement dans leur approche des ph´enom`enes ´economiques. NEMESIS est un mod`ele macro-sectoriel (30 secteurs), d’inspiration n´eo-keyn´esienne, avec des coˆuts d’ajustement, des anticipations adaptatives, des prix rigides, et des taux de change et d’int´erˆet exog`enes, qui ne per-mettent pas au mod`ele de d´ecrire un ´equilibre g´en´eral, mˆeme dans le long terme. RHOMOLO, qui est un mod`ele d’´economie spatiale bas´e sur les nouvelles th´eories de l’´economie g´eographique, est le plus d´etaill´e g´eographiquement, avec la mod´elisation en ´equilibre g´en´eral de 267 r´egions europ´eennes, avec leurs interactions. Le mod`ele comporte ´egalement une dimension sectorielle, les r´egions comportant chacune 10 secteurs d’activit´e. Comme pour NEMESIS, le grand niveau de d´etail de RHOMOLO, ne permet pas une r´esolution tourn´ee vers l’avenir, et le mod`ele est r´esolu par une approche dynamique r´ecursive.
En ce qui concerne la repr´esentation de l’innovation, les trois mod`eles ont en commun de la faire reposer sur la forte ´evidence empirique, que les investissements en R&D ont ´et´e `a l’origine des prin-cipales innovations technologiques, et progr`es de productivit´e, dans les pays industrialis´es au cours des derni`eres d´ecennies. Du point de vue th´eorique, ils se r´ef`erent ´egalement tous, explicitement ou implicitement, aux nouvelles th´eories de la croissance, qui ont ´emerg´e `a partir du d´ebut des ann´ees 1990. NEMESIS est certainement le mod`ele qui inclut les m´ecanismes de progr`es technique les plus riches, avec notamment l’extension r´ecente de ses m´ecanismes d’innovation au rˆole jou´e par les in-vestissements en TIC, en logiciels et en formation professionnelle, particuli`erement importants pour repr´esenter l’innovation dans les services. Mais les approches sectorielle, et “hors-de-l’´equilibre” qui
contraste, le compromis est cette fois au prix de la richesse, et du degr´e de d´etail, des m´ecanismes d’innovation, qui sont restreints par les contraintes analytiques fortes, qu’imposent la mod´elisation DSGE. Pour RHOMOLO, `a l’oppos´e, les limitations viennent davantage des contraintes de donn´ees, et de la difficult´e de repr´esenter certains ph´enom`enes, comme les externalit´es de connaissance, avec un niveau r´egional d´etaill´e.
Si nous ajoutons `a ces diff´erences dans la structure des mod`eles, la repr´esentation de la croissance endog`ene, versus semi-endog`ene, que les mod`eles supportent, nous ne pouvons certainement pas esp´erer qu’ils fournissent des r´esultats similaires lorsqu’ils sont utilis´es pour l’´evaluation des politiques de R&I de l’UE, mais tout au moins que leurs r´esultats se compl`etent utilement. Il y a l’art, et la mani`ere, pour l’´evaluation macro´economique des politiques de R&I de l’UE, et c’est `a la pr´esentation de ce “compromis” que forment les diff´erents mod`eles, `a partir de l’analyse des principaux travaux th´eoriques
qui se sont d´evelopp´es, depuis les ann´ees 1950, que cette th`ese est d´edi´ee.
Mots-cl´e : Croissance endog`ene, Croissance multisectorielle, Changement technologique, Producti-vit´e agr´eg´ee, Comptabilit´e de la croissance, Innovation de produit et de proc´ed´e, Innovation dans les services, Recherche publique et priv´ee, R&D, TIC, Intangibles, Externalit´es de connaissance, Mod´elisa-tion macro´economique, Mod`eles de simulaMod´elisa-tion de grande taille, CGE, Mod`eles n´eo-keyn´esiens, DSGE, Politiques de R&I, Subventions `a la R&I, ´Evaluation des politiques de R&I
Summary: This PhD thesis describes the R&I mechanisms that the macroeconomic models QUEST III, NEMESIS and RHOMOLO incorporate, and how these models are used to evaluate the R&I policies that are introduced and monitored by the General Directorate for R&I of the EC.
QUEST III, NEMESIS and RHOMOLO are models belonging to different economic traditions, and also possess different levels of detail. QUEST is a macroeconomic Dynamic Stochastic General Equilibrium (DSGE) model, the most in line with modern macroeconomic theory. There is one model for every EU(28) country, with microeconomic foundations explicitly derived from inter-temporal profit and utility maximization under perfect foresight, as in the general equilibrium setting of modern theoretical models of economic growth. NEMESIS is, like QUEST, a model for every EU(28) country, but the two models are very different in their modeling approach. NEMESIS is a macro-sectorial model (30 sectors) of neo-Keynesian inspiration. There are adjustment costs, adaptive expectations, wage rigidities and exogenous exchange and interest rates, which prevent the model from describing a general equilibrium, even in the long-run. RHOMOLO, is a spatial model based on the new economic geography theories and is the most detailed geographically, as it describes the general equilibrium modeling of 267 EU regional economies and their interactions. This model also has a sectorial dimension and each region contains 10 economic sectors. Like NEMESIS, the great level of detail in RHOMOLO, prevents any forward-looking dynamics, and both models are solved according to a recursively dynamic approach.
For modeling innovation, what the three models have in common is that they were inspired by the strong empirical evidence that investments in R&D were at the origin of major technological innovations and TFP growth in advanced industrialized countries over the past decades. On the theoretical side, they all also refer, explicitly or implicitly, to the New Growth Theories that have emerged from the beginning of the 1990s. NEMESIS, that is grounded on empirics, is certainly the model that includes the richest mechanisms of technical change, with, notably, the recent extension of the innovation mechanisms of the model to the role played by investments in ICT, software and professional training, that are particularly important when representing innovation in the service sectors. But the sectorial and “out-of-equilibrium” approaches that are used in NEMESIS, do not ensure that the long-run behavior of the model will conform to the general equilibrium prerequisite present in QUEST III. For QUEST III, in contrast, this time the compromise is at the cost of the richness and the level of detail of the innovation mechanisms of the model, that are restricted by the forward-looking expectations,
phenomena, such as knowledge externalities, on a detailed regional level.
If, to these differences in the structure of the models, we add the endogenous, versus, semi-endogenous representation of growth they support, we could certainly not expect that they would provide similar results when evaluating EU R&I policies, but at least that their results would usefully complement each other’s. There are various ways and means, for the macroeconomic evaluation of EU R&I policies, and this thesis is dedicated to the presentation of this “compromise” the different models form, using the analysis of the main findings in the empirical and theoretical works developed since the fifties, to measure and represent economic growth.
Key-words: Endogenous Growth, Multi-sector Growth, Technological Change, Aggregate Produc-tivity, Growth Accounting, Product and Process Innovation, Service Innovation, Private and Public Research, R&D, ICT, Intangibles, International Technology Diffusion, Knowledge Spillovers, Macro-Econometric Modeling, CGE, Neo-Keynesian Models, DSGE, Large-Scale Simulation Models, R&I Policy, R&I Subsidies, R&I Policy Evaluation
This thesis could not be written without the help and the support of the people and institutions I would like to thank here.
First the Universit´e Cˆote d’Azur that accepted my candidature for this PhD and allowed me to highlight more than twenty years of research with the delivery of this thesis. Particular thanks go to the GREDEG laboratory, and the DESPEG doctoral school that both accepted me as a member. In Nice, I would like to thank Elisabeth Gazano, Isabelle Arfeuil, Ghislain Chave, Martine Naulet and Jeanne Scheit for their administrative support, and Luc Gaffard, my thesis Director, as well as Jean-Pierre Allegret, Patrick Musso, Flora Bellone, Olivier Bruno and Lionel Nesta, for their academic support.
Second, the services of the Directorate General For Research and Innovation of the European Com-mission, that financially supported much of the research presented in this dissertation, beginning with the financing of the NEMESIS model from 2000 onwards. This was the start of a fascinating adventure and of an intense collaboration that continues today. In Brussels, I would like to thank Fran¸cois Valette, Daniel Debey, Domenico Rosetti Di Valdalbero, Hugur Muldur, Henri Delanghe, Marco Grancagnolo, Liviu Stirbat and Julien Ravet.
Third the ERASME laboratory, formerly at the ´Ecole Centrale de Paris, and now at SEURECO, where I have my oldest and today closest collaborators. In Paris, I thank Paul Zagam´e, who guided me in this difficult task of applied macro modeling, Arnaud Fougeyrollas, who was the main artisan of the NEMESIS model, as well as Baptiste Boitier, Gilles Kol´eda and Boris Le Hir: those who collaborated the most with me and who supported my work in various other ways.
Fourth, the thesis committee, Jean-Luc Gaffard, Michele Cincera, Pierre Mohnen, Patrick Sevestre, Lionel Nesta and Paul Zagam´e, for accepting to be part of this adventure, and for evaluating this thesis.
Fifth Georgina, who helped me with my English.
Then finally my family, my son R´emi and his mum Shu-Wen, my brother and sisters, Jean-Patrick, Pascale and B´en´edicte, my parents, Gilbert and Giselle, and all my friends too many to be named as I would not like to forget anyone.
1 General Introduction 25
1.1 Context of the research . . . 26
1.2 Subject of the thesis . . . 28
1.3 Organization of the thesis . . . 31
I
The Facts and the Theories
34
2 The Econometric Literature on R&D 35 2.1 Objectives and first methodological issues . . . 382.1.1 The framework inherited from growth accounting literature . . . 39
2.1.2 The framework used in econometric studies . . . 41
2.2 Output elasticities and rates of return of R&D . . . 45
2.2.1 Definition of the concepts . . . 45
2.2.2 Synthesis of main findings . . . 47
2.3 R&D spillovers and the social returns of R&D . . . 50
2.3.1 Rent and knowledge spillovers: definition and measurement issues . . . 50
2.3.2 The different impacts of rent and knowledge spillovers . . . 53
2.3.3 Private and social returns on R&D capital . . . 55
2.4 The role of public R&D and the importance of “absorptive capacity” . . . 59
2.4.1 How big is public research compared to private research? . . . 59
2.4.2 The complementarity between public and private research . . . 60
2.4.3 The direct impact of public research on productivity is weaker than that of private research . . . 60
2.4.4 Public research is more basic and crucial for corporate innovation in high tech
sectors . . . 62
2.4.5 Knowledge transfers from public to private need an absorptive capacity . . . 63
2.5 Six other important topics . . . 64
2.5.1 Measurement of inputs, outputs and TFP . . . 65
2.5.2 Rate of return of product/process innovations . . . 67
2.5.3 Output and employment impacts of product and process innovations . . . 67
2.5.4 R&D depreciation rate and knowledge capital measurement . . . 68
2.5.5 The time lags between R&D investments and their effects over time . . . 70
2.5.6 Negative externalities: stepping on toes and creative destruction . . . 71
3 The New Growth Theories 73 3.1 The RCK Model . . . 77
3.1.1 The Kaldor Facts . . . 77
3.1.2 Factor endowment and production technology . . . 78
3.1.3 The Firms’ optimum and the solving of the model . . . 80
3.1.4 Transitional dynamics and convergence towards the balanced growth path . . . . 82
3.1.5 Implications for convergence of GDP per capita in different countries . . . 84
3.1.6 What finally is the true engine for growth: Capital deepening or technological externalities? . . . 85
3.2 The AK models . . . 86
3.2.1 The central distinction between internal and external returns in the original AK model introduced by Frankel in 1962 . . . 88
3.2.2 Arrow’s 1962 model and “The Economic Implications of Learning by Doing” . . . 91
3.2.3 Romer’s 1986 paper . . . 93
3.2.4 The implications for convergence and economic policy . . . 96
3.3 The first generation of NGT models . . . 97
3.3.1 Romer’s product variety model . . . 100
3.3.2 The “quality ladder” model by Aghion and Howitt (1992) and Grossman and Helpman (1991) . . . 107
3.4 The Jones’ criticism of the “Scale Effect” and the second generation of NGT models . . 113
3.4.2 The second generation of “fully endogenous” models . . . 120
3.5 Semi-endogenous growth, fully-endogenous growth, or both? . . . 124
3.6 The role of structural change and out-of-equilibrium growth . . . 135
3.7 New Growth Theories and New Kaldor facts . . . 138
II
The Macro Models Used by the European Commission
142
4 The endogenization of innovation on R&D 143 4.1 QUEST, NEMESIS and RHOMOLO . . . 1484.1.1 The QUEST III DSGE model . . . 149
4.1.2 Overview of the model functioning . . . 150
4.1.2.1 Modeling of innovation and endogenous growth characteristics . . . 152
4.1.2.2 Calibration of endogenous growth mechanisms . . . 154
4.1.2.3 Some remarks for future improvements . . . 160
4.1.3 The NEMESIS macro-econometric model . . . 161
4.1.3.1 Overview of the model functioning . . . 164
4.1.3.2 Modeling of innovation . . . 168
4.1.3.3 Endogenous growth properties in the model . . . 173
4.1.3.4 Implications of product innovation for the measurement of growth . . . 177
4.1.3.5 Some indications on the calibration of innovation . . . 179
4.1.3.6 Recent improvements in the model . . . 180
4.1.4 The RHOMOLO spatial CGE model . . . 180
4.1.4.1 Overview of the model’s functioning . . . 181
4.1.4.2 Modeling innovation . . . 182
4.1.4.3 Calibration of innovation mechanisms . . . 182
4.1.4.4 Limitations and potential for future improvements . . . 182
4.2 What do the three models, in the case of “Horizon Europe”, tell us? . . . 184
4.2.1 The Horizon Europe programme and its implementation in the models . . . 184
4.2.2 The adaptation of the R&I mechanisms in the models: Leverage, spillovers and performance . . . 187
4.2.4 Job creations provoked by the programme . . . 190
4.3 Unresolved issues on the practice of EC R&I policy evaluation using macro models . . . 191
5 Beyond R&D: A New Framework for NEMESIS 196 5.1 Introduction . . . 197
5.2 Broadening the framework with the concept of ICT as GPT . . . 198
5.2.1 Theoretical grounds1 . . . 199
5.2.1.1 Growth accounting and the productivity paradox . . . 199
5.2.1.2 Multidimensional Innovation and the GPT concept . . . 201
5.2.2 Can ICT really be considered as GPT? - The empirics . . . 205
5.2.2.1 What do the data and the stylized facts tell us? . . . 205
5.2.2.2 The contribution of econometric studies . . . 208
5.2.2.3 Summary of empirical literature key findings . . . 211
5.3 The new frame introduced in Nemesis . . . 211
5.3.1 General outline: from Romer to Bresnahan & Trajtenberg . . . 212
5.3.1.1 A three dimensional innovation function . . . 212
5.3.1.2 Modeling of knowledge externalities . . . 214
5.3.1.3 Sectorial inter-dependencies: interactions through knowledge external-ities and enabling technologies . . . 217
5.3.2 Implementation in NEMESIS . . . 219
5.3.2.1 Introduction of process and product innovations . . . 219
5.3.2.2 Endogenous growth properties . . . 223
5.3.2.3 Overview of the innovation mechanisms/equations introduced into NEME-SIS . . . 227
5.4 Calibration of the new NEMESIS innovation module . . . 230
5.4.1 The innovation chain . . . 231
5.4.2 Calibration of innovation chain . . . 233
5.4.3 Data used for calibration . . . 240
5.5 Analytical tests . . . 243
1This section builds partly on Le Hir (2012, [205]) concerning the presentation of the concept of GPT, as does the
5.5.1 Protocol . . . 244
5.5.2 The distinct impacts of innovation inputs with pulling effects . . . 247
5.5.3 The role of complementarities and the pulling effects . . . 253
5.5.4 Removing the pulling effects . . . 255
5.5.5 Removing knowledge externalities reduces GDP level but not the long-run output growth . . . 257
5.5.6 The importance of product innovations . . . 257
5.5.7 On convergence in GDP/capita . . . 259
5.6 NEMESIS: A useful bridge between Micro and Macro . . . 263
III
The Evaluation of EU R&I Policies with NEMESIS
265
6 Horizon 2020 - Interim Evaluation 266 6.1 The H2020 programme . . . 2706.2 Methodology to implement the H2020 programme in NEMESIS . . . 272
6.2.1 The budget and its allocation . . . 272
6.2.2 The key parameters . . . 273
6.2.2.1 The leverage effect . . . 274
6.2.2.2 Knowledge spillovers . . . 280
6.2.2.3 Economic performance . . . 281
6.2.3 The reference scenario . . . 282
6.3 Introduction of the H2020 programme in NEMESIS . . . 284
6.3.1 The assessed budget . . . 284
6.3.2 Values for key parameters . . . 287
6.3.3 Summary of the main assumptions . . . 288
6.4 The main results of H2020 interim evaluation . . . 289
6.4.1 Results at EU macro level . . . 289
6.4.2 Results at EU sectorial level . . . 292
6.4.3 Results at national level . . . 294
6.4.4 Summary table . . . 298
6.5.1 “Optimistic” and “Pessimistic” scenarios: assumptions . . . 299
6.5.2 The “Optimistic” and “Pessimistic” scenarios: results . . . 301
6.5.3 The results of two additional scenarios: lower” and “Optimistic-upper” . . . 304
6.6 The “H2020 forever” scenario . . . 308
6.6.1 “H2020 forever” assumptions . . . 308
6.6.2 Economic impacts under the “H2020 forever” scenario . . . 309
6.7 Comparison of “H2020 forever” with the results of the ex-ante impact assessment . . . . 312
6.7.1 Direct comparison of the two assessments . . . 313
6.7.2 Explaining the difference: The role played by the size of the H2020 budget . . . 314
6.7.3 Explaining the difference: The role played by the other methodological issues . . 316
6.7.4 “H2020 forever” and ex-ante/interim comparison: the “Optimistic” case . . . 320
6.8 Summary of main findings and discussions . . . 323
6.8.1 A summary of the socioeconomic and environmental impacts . . . 324
6.8.2 Lessons for future evaluations of EC R&I programmes . . . 326
7 Investigating the Impacts of the Innovation Union (I3U) 329 7.1 The Innovation Union Flagship Initiative and the I3U H2020 Research Project . . . 331
7.1.1 Europe 2020 and the Innovation Union Flagship initiative . . . 331
7.1.2 The Innovation Union 34 Commitments and their Assessment in I3U . . . 333
7.2 Where are we following the 2008 financial crisis? . . . 344
7.2.1 What we can learn from Conceptual Model of the European Innovation System2 344 7.2.1.1 Taxonomy of Member States Innovation Patterns . . . 345
7.2.1.2 Characterization of Member States Innovation Systems by adding in-formation on Member States’ innovation policies . . . 349
7.2.1.3 Introducing the specific context of the Innovation Union and its 34 commitments3 . . . 351
7.2.2 The progress of the Innovation Union as Measured by the European Innovation Scoreboard . . . 354
2This section builds on the works Verspagen et al. (2017a, [328], and 2017b, [329]) on the I3U project, I3U deliverable
D9.4 ( [169]), and on the I3U policy brief of September 2018 ( [168]) “The State of the Innovation and the working of the European Innovation Systems”.
7.2.2.1 Situation in 2015: Country ranking . . . 355
7.2.2.2 Evolution from 2008 to 2015 . . . 358
7.2.2.3 The specific contribution of R&D investments . . . 360
7.2.3 How the evolution of R&D investments modified the economic performance of the EU countries? . . . 362
7.2.3.1 Evolution of R&D investments since the financial crisis . . . 362
7.2.3.2 The evolution at sectorial level and by socioeconomic objective . . . 367
7.2.3.3 Other methodological issues . . . 374
7.2.3.4 The results at EU macro level . . . 378
7.2.3.5 The results at EU sectorial level . . . 380
7.2.3.6 The results at national level . . . 383
7.2.3.7 Summary of main findings with NEMESIS . . . 390
7.2.4 Conclusion on the current state of the Europe Innovation Union based on the results of the I3U project. . . 392
7.3 What are the perspectives under current trends? . . . 394
7.3.1 Implementation of Innovation Union Commitments in NEMESIS . . . 397
7.3.1.1 Implementation group 1 commitments: “Human capital” . . . 399
7.3.1.2 Implementation group 2 commitments: “Access to finance” . . . 403
7.3.1.3 Implementation of the group 3 commitments: “European funds” . . . . 408
7.3.1.4 Implementation of the group 4 commitments: “Action to market” . . . . 418
7.3.1.5 Taking into account overlapping between individual commitments when assessing them in groups or as a whole . . . 421
7.3.2 The socioeconomic impacts of the Innovation Union . . . 426
7.3.2.1 The evaluation of the Innovation Union as a whole . . . 427
7.3.2.2 The individual impacts of the commitments at EU-27 level . . . 439
7.3.2.3 The individual impacts of the commitments in the different EU coun-tries and in UK . . . 445
7.3.3 Summarizing the conclusions on the perspectives of the Innovation Union under current trends . . . 451
7.4 Summary of the main findings of I3U project from its final report . . . 457 7.4.1 The state of the Innovation Union and recommendations for future improvements 458
7.4.2 The evaluation of the Innovation Union socioeconomic impacts . . . 461
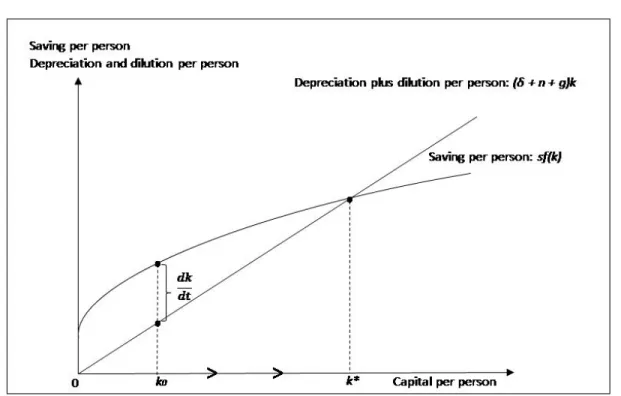
3.1.1 Convergence to the study state in the Solow model . . . 83
4.1.1 Response of TFP to 0.1 GDP point increase of R&D from tax credit . . . 157
4.1.2 Response of GDP to 0.1 GDP point increase of R&D from tax credit . . . 158
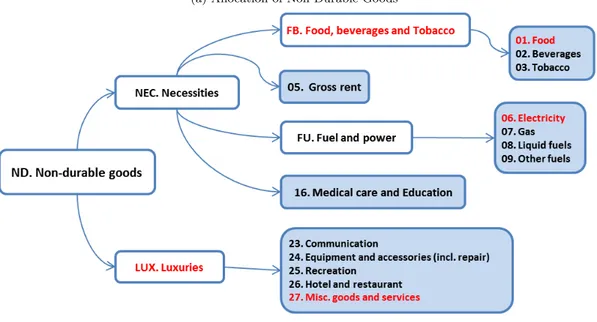
4.1.3 Allocation of the aggregate consumption . . . 165
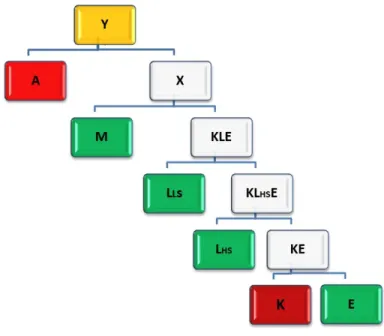
4.1.4 The CES production functions . . . 167
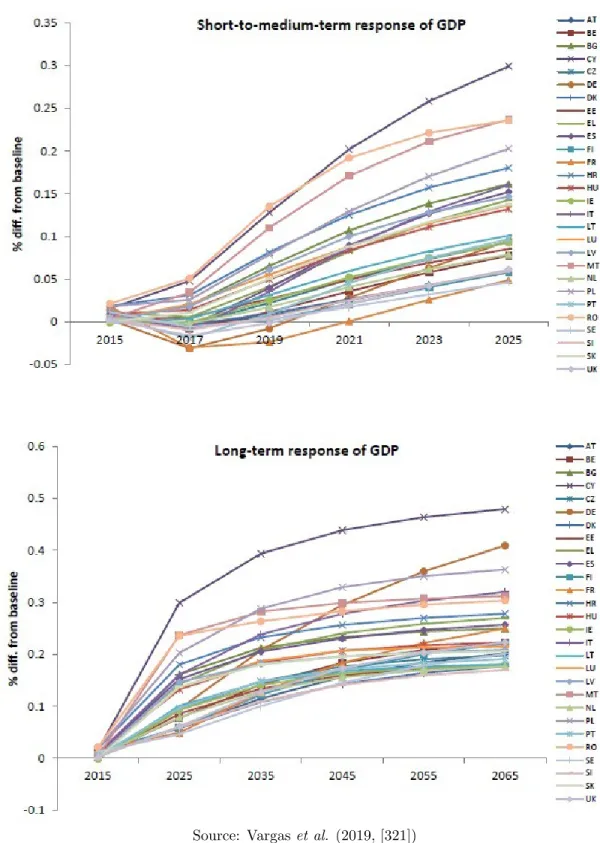
4.2.1 The impact of Horizon Europe on GDP . . . 189
4.2.2 Job creation provoked by the programme . . . 190
5.3.1 Knowledge flows . . . 218
5.3.2 GPT mechanisms . . . 219
5.3.3 Innovation and economic feedbacks . . . 223
5.4.1 The chain of effects to calibration from the sectorial level to interactions within the NEMESIS system . . . 232
5.4.2 Intensities in innovation inputs in % GDP, 2012 . . . 241
5.4.3 Sectoral intensities in innovative inputs, 2012 . . . 243
5.5.1 Scenarios T1605, T2605, T3605: Change in GDP in % compared to the reference scenario248 5.5.2 Deviation in points of GDP growth compared to the reference scenario (T1605, T2605, T3605) . . . 249
5.5.3 Impacts on total employment (deviation w.r.t. baseline, in thousand; T1605, T2605 and T3605) . . . 251
5.5.4 Impacts on the long term annual growth rate of labor productivity in EU-28 sectors (deviation w.r.t. baseline in difference; T1605, T2605 and T3605) . . . 252
5.5.6 Impact on long term annual growth rate of GDP per capita (T2605 - ICT) . . . 262
5.5.7 Impact on long term annual growth rate of GDP per capita (T2605 - OI) . . . 263
6.0.1 Methodology of the assessments of SEEI of FP7 and H2020 using NEMESIS . . . 269
6.1.1 Overall structure of Horizon 2020 (excluding Euratom) . . . 271
6.2.1 Illustrative scheme of the different cases for the leverage effect . . . 275
6.4.1 The economic impact of Horizon 2020 funding for research on EU GDP (in % deviation from the reference scenario) . . . 289
6.4.2 Impact of H2020 on total employment in thousands (difference to the reference scenario) 291 6.4.3 Impact on GDP in 2030 at country level (in % deviation from the reference scenario, on the right axis) and EC contribution received (in % GDP, mean value over 2014-2020, on the left axis) . . . 295
6.4.4 Impacts on total employment in the different EU countries in 2030 (thousands, in dif-ference from the redif-ference scenario)) . . . 295
6.5.1 Sensitivity of EU GDP gains with the assumptions of H2020 (% deviation w.r.t. reference scenario) . . . 302
6.6.1 Results of the “H2020 forever scenario” at EU level (in % deviation w.r.t. reference scenario) . . . 310
6.7.1 Comparison of GDP gains between the ex-ante and the interim assessments (million 2014 ➾, deviation w.r.t the reference scenario) (The accumulated GDP gains are the integral, between 2014 and 2030, of the annual GDP gains displayed on the graph) . . . 313
6.7.2 Comparison of the annual H2020 budget introduced in the model between the two assessments (billion euros) . . . 315
6.7.3 Comparison of GDP gains between the ex-ante and the interim assessments when cor-recting for the difference in the budget spent between 2014 and 2020 (million euros on left axis) . . . 316
6.7.4 Results of a forever scenario under “Optimistic” assumptions at EU level (in % deviation w.r.t. reference scenario) . . . 321
7.1.1 Method for the impact assessment of the 34 commitments . . . 336
7.2.1 Relative innovation performance of Member States measured by the SII for 2015. . . 356
7.2.3 The impact of a rise of R&D on knowledge . . . 376
7.2.4 The repercussion on other innovation inputs . . . 376
7.2.5 The impact on economic performance . . . 377
7.2.6 The impact on EU GDP (in % difference from the reference scenario) . . . 379
7.2.7 The impact on total employment in EU (difference from reference scenario in thousands) 380 7.2.8 Impact on annual long term GDP growth rate per country (in deviation from the refer-ence scenario, left) and increase in R&D intensity (in % GDP, right) . . . 385
7.2.9 Impact on Intra-EU trade balance in 2030 (in GDP points) . . . 387
7.2.10Impact on Extra-EU trade balance in 2030 (in GDP points) . . . 388
7.2.11GDP gains and contributions per country in 2030 (in GDP points and in comparison to the reference scenario) . . . 389
7.2.12Impacts on total employment in the different EU countries in 2030 (in thousands and in difference from reference scenario) . . . 390
7.3.1 Evolution of the budget of EU R&I framework programmes from FP1 . . . 413
7.3.2 Size of EU R&I Programmes in the “Realistic” and “Optimistic” scenarios (2014 Euros) . 414 7.3.3 Change in innovation asset investments in GDP points, compared to the situation in the reference scenario . . . 429
7.3.4 Change in innovation asset investments in 2014 constant billion➾, difference with the reference scenario . . . 430
7.3.5 GDP gains in the six scenarios in percentages compared to the reference scenario . . . . 431
7.3.6 Decomposition of the GDP gains in the “Medium” case in the “Realistic” scenario . . . . 432
7.3.7 The new job creations by the innovation Union in EU-27, compared to the reference scenario in thousands . . . 433
7.3.8 New job creations by the innovation Union in EU-27, compared to the reference scenario and in thousands . . . 434
7.3.9 The relation between GDP gains and the deviation of investment in innovation assets for the “Medium” case in the “Realistic” scenario . . . 436
7.3.10The differentiated impacts on GDP of the different categories of commitments . . . 438
7.3.11Impacts on EU-27 GDP in 2040 for the “Medium” case of the “Realistic” scenario . . . . 453
7.3.12Impacts on EU-27 GDP long-term annual growth rate for the “Medium” case in the “Realistic” scenario . . . 454
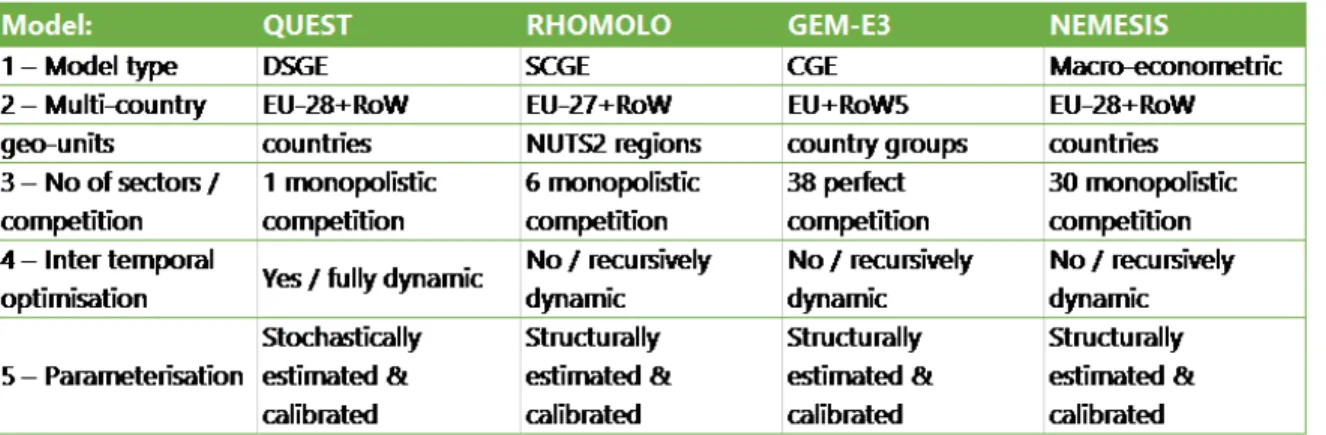
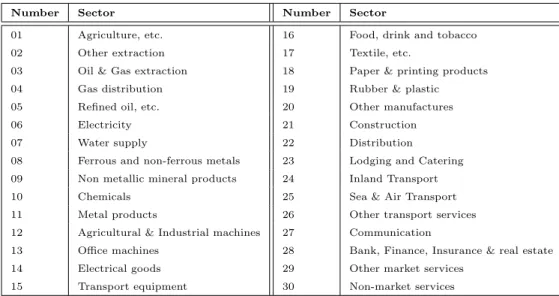
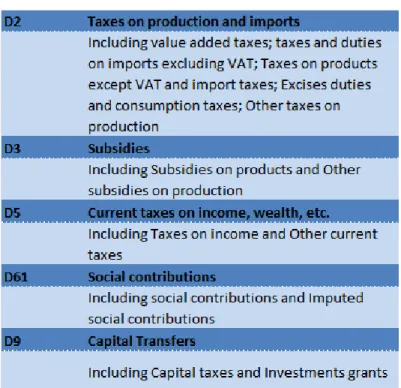
2.3.1 Result of key studies estimating both private and social returns of R&D . . . 58 4.0.1 General characteristics of QUEST, RHOMOLO, GEM-E3 and NEMESIS . . . 145 4.1.1 Value of the main parameters used to calibrate the effects of innovation in QUEST . . . 155 4.1.2 List of sectors modeled in the NEMESIS model . . . 166 4.1.3 Principal taxes and subsidies . . . 168 4.2.1 Annual allocation of EC contribution under the Horizon Europe programme . . . 186 5.3.1 Sum-up of the equations intervening at the “core” of the innovation module of NEMESIS 229 5.3.2 Analytical expression of the equations at the core of the innovation module of NEMESIS 230 5.4.1 List of key parameters intervening in the innovation chain of NEMESIS . . . 239 5.5.1 The first set of analytical tests . . . 247 5.5.2 “Pulling” effects calculated by the model (T1605, T2605, T3605) . . . 250 5.5.3 Substitution elasticity between innovation components and “pulling” effects . . . 253 5.5.4 Substitution elasticity, pulling effects and GDP impacts . . . 254 5.5.5 GDP impacts without pulling effects and role of knowledge externalities . . . 256 5.5.6 The impact of product innovations (GDP) . . . 258 5.5.7 The impact of product innovations (Employment) . . . 259 6.2.1 The co-financing effects in the main thematic of FP7 and H2020 . . . 276 6.2.2 Summary of estimated FP7 effects on R&D budget growth and leveraged funds by TRL 279 6.2.3 The evolution of EU-28 GDP in the NEMESIS reference scenario . . . 283 6.2.4 Evolution of innovation asset intensities in the NEMESIS reference scenario (in % of
6.3.1 The allocation of H2020 budget between basic and applied research . . . 285 6.3.2 Annual allocation of H2020 (in million 2014➾) . . . 285 6.3.3 Geographical allocation of H2020 (in % of total H2020 budget ) . . . 286 6.3.4 Allocation of H2020 fund by sector (Average in EU-28) . . . 287 6.3.5 Summary of H2020 assessment main assumptions . . . 288 6.4.1 Estimated impact on EU sectorial value-added (in % difference from the reference scenario)292 6.4.2 Estimated impact on EU sectorial net exports (Million euros, difference from the
refer-ence scenario) . . . 293 6.4.3 Estimated impact on EU sectorial labour productivity (in % difference from the reference
scenario) . . . 293 6.4.4 Estimated impact on EU sectorial employment (in thousands, difference from the scenario)294 6.4.5 The impact of H2020 on knowledge at country level in 2030 (in % deviation from the
reference scenario) . . . 297 6.4.6 Brief overview of key H2020 interim quantification produced by NEMESIS . . . 298 6.5.1 New crowding-in assumption based on the recalculation of the indirect costs using FP7
methodology and eCORDA data . . . 300 6.5.2 Key assumptions used in the three scenarios . . . 300 6.5.3 Average GDP and employment gains in the three scenarios between 2014 and 2030 . . . 303 6.5.4 Annual average GDP and employment gains between 2014 and 2030 following the
as-sumption retained for the direct crowding-in effect of H2020 . . . 305 6.5.5 Summary of key quantifications of economic impact for H2020 “Pessimistic” and
“Opti-mistic” scenarios (in 2014 prices) . . . 306 6.5.6 Summary of key quantifications of economic impact for H2020 “Optimistic-lower” and
“Optimistic-upper” scenarios (in 2014 prices) . . . 307 6.6.1 Summary of “H2020 forever” main assumptions . . . 309 6.6.2 Results for real GDP of the “H2020 forever” scenario at country level . . . 311 6.7.1 Comparison of the assumptions used in the two assessments . . . 317 6.7.2 Comparison of the EX-ANTE-2012 and PPMI-INTERIM assessments for GDP and
employment for the year 2030 . . . 318 6.7.3 Comparison of the EX-ANTE-2012 and PPMI-INTERIM assessments for GDP and
6.7.4 Comparison with the EX-ANTE-2012 using “Optimistic” assumptions for the period 2014-2030 . . . 322 6.7.5 Comparison with the EX-ANTE-2012 using “Optimistic” assumptions for the year 2030 323 7.1.1 List of Issues and Work-Packages . . . 338 7.1.2 List of commitments considered as “Simple statements” . . . 340 7.1.3 List of commitments considered as “Candidates” . . . 341 7.1.4 List of the IU commitments implemented in the NEMESIS model . . . 342 7.2.1 European innovation systems, synthesis (1/2) . . . 347 7.2.2 European innovation systems, synthesis (2/2) . . . 348 7.2.3 Public policy instruments and their characterization . . . 349 7.2.4 Values of indicators for the eight innovation dimensions for 2015 . . . 357 7.2.5 Linear correlation across countries between the eight categories of innovation indicators
for 2015 . . . 357 7.2.6 Evolution of SII and of the eight innovation indicators categories between 2008 and 2015
(in %) . . . 359 7.2.7 Linear correlation across countries between the evolution of the eight categories of
in-novation indicators on the 2008-2015 period . . . 360 7.2.8 Linear correlation across countries between R&D intensity the eight categories of
inno-vation indicators for 2015 . . . 362 7.2.9 Evolution of private R&D intensity in % GDP in EU countries, 2007-2015 . . . 364 7.2.10Evolution of public R&D intensity in % GDP in EU countries, 2007-2015 . . . 365 7.2.11Evolution of total R&D intensity in % GDP in EU countries, 2007-2015 . . . 366 7.2.12Correspondence between NEMESIS sectors and the NACE rev. 2 (1/2) . . . 368 7.2.13Correspondence between NEMESIS sectors and the NACE rev. 2 (2/2) . . . 369 7.2.14Percentage of missing data for Business Enterprises R&D (BERD) in NACE rev.-2,
period 2007-2014 . . . 370 7.2.15Evolution of Business Enterprises R&D (BERD) at sectorial level between 2007 and
2015 (in % GDP) . . . 371 7.2.16Evolution of public R&D investments by socio-economic objective between 2007 and
2015 (in % GDP) . . . 372 7.2.17Link between Public R&D investments and NEMESIS sectors . . . 373
7.2.18Evolution of GDP in the reference scenario . . . 374 7.2.19Evolution of innovation assets in the reference scenario . . . 375 7.2.20The impacts of EU-28 sectorial value-added (in % deviation from the reference scenario) 381 7.2.21The impacts on EU-28 sectoral employment (in thousands and in difference from the
reference scenario) . . . 382 7.2.22The impact on EU-28 sectorial trade balance (in billion➾ of 2005 and in difference from
the reference scenario) . . . 383 7.2.23Long term impacts on GDP per country (in % diff. from the reference scenario) . . . 384 7.2.24Evolution of R&D intensity in the business sector in Slovenia (in GDP points) . . . 386 7.3.1 Summary table of commitment’s implementation in the NEMESIS model . . . 398 7.3.2 Modification of NEMESIS model to implement Group 1 commitments . . . 400 7.3.3 Evolution of the variable“Knowledge transfers”in the“REALISTIC”and“OPTIMISTIC”
scenarios . . . 402 7.3.4 Modification of NEMESIS model to implement Group 2 commitments . . . 404 7.3.5 Venture capital data from Dealroom and ESMA . . . 405 7.3.6 Assumptions used to implement commitment 11 in NEMESIS . . . 406 7.3.7 Modification of NEMESIS model to implement Group 3 commitments . . . 409 7.3.8 Assumptions used for implementing the commitment 6 in NEMESIS . . . 412 7.3.9 Summary of ESIF finance planned by Member state (2014-2020) . . . 416 7.3.10Summary of the assumptions used to implement the commitments C24/25 in the
NEME-SIS model . . . 417 7.3.11Modification of NEMESIS model to implement Group 4 commitments . . . 419 7.3.12Assumptions used for implementing the commitment 19.1 in NEMESIS . . . 421 7.3.13The gains for EU economy growth rate compared to the reference scenario . . . 432 7.3.14GDP gains per country for 2040 , in percentages compared to the reference scenario . . 435 7.3.15Employment creation per country for 2040 in thousands compared to the reference scenario437 7.3.16The individual impacts of commitments of groups 1 and 2 in the “Medium” case of the
“Realistic” scenario . . . 440 7.3.17The individual impacts of commitments of groups 3 and 4 in the “Medium” case of the
7.3.18The individual impacts of commitments of groups 1 and 2 in the “Medium” case of the “Optimistic” scenario . . . 442 7.3.19The individual impacts of commitments of groups 3 and 4 in the “Medium” case of the
“Optimistic” scenario . . . 443 7.3.20The individual impacts of commitments at country level . . . 446 7.3.21The individual impacts of commitments in the different categories of national systems
of innovation . . . 449 7.3.22The individual impacts of commitments for the innovators groups of the EIS . . . 450
1.1
Context of the research
At the end of the 1990s, the general feeling was that it was the beginning of the “third industrial revolution”. The fast development of internet and of ICT technologies, started to produce important positive effects on the growth rate of factor productivity, after two decades of weak and sluggish evolution.
But scrutinizing this, it was fast evident, from the comparison with the United States, that Europe was lagging far behind in terms of both ICT production and adoption, with reduced impacts on productivity. To take some examples (see Br´ecard et al., 2004, [41], page 10), from OECD data, in 1999 the ICT sector was about two times more developed in the US (4.5% of GDP) than in the EU (2.4%), and the share of ICT investment was about a third of Gross Fixed Capital Formation (GFCF) in the US, against only a sixth in countries such as France or Germany. Comparing the 1980s with the 1990s, the Total Factor Productivity (TFP) revival was about 0.5% in the US between the two periods, while in most European countries, productivity continued to fall. In the case of the US, the highly developed ICT sector permitted growth in productivity in ICT producer sectors. The transformation of the links between firms and customers, from the development of internet and large investment in ICT devices, also provoked strong productivity gains in ICT user sectors. This led to rationalization of production processes and the reduction of transaction costs. It contrasts with the situation in the EU countries, where, despite noticeable exceptions, such as Sweden, Norway, Denmark and Finland, these gains could not materialize.
This evidence that the EU was “missing” the train in this third industrial revolution, and could not fully benefit fully from this virtuous circle between R&D investments, innovations, new technologies and productivity growth, therefore convinced the heads of states and governments of the EU, at the European Council of Lisbon in March 2000, to set a new strategic goal for Europe, “(. . . ) to become the most competitive and dynamic knowledge-based economy in the world, capable of sustainable economic growth with more and better jobs and greater social cohesion” (European Parliament, 2000, [261]).
With the additional observation that R&D research intensity had declined during the last decade; while it had increased sharply in the US and in Japan, to reach close 3% of GDP in 2000 against only 2% in Europe; the Barcelona Council of March 2002 introduced this central element in the strategy “(. . . ) that overall spending on R&D and innovation in the Union should be increased with the aim of
approaching 3% of GDP by 2010” (European Commission, 2002, [?]).
benefit from reaching this 3% R&D target in 2010, the Directorate General for Research and Innovation (DG RTD) of the European Commission (EC), requested, in 2003, a macroeconomic evaluation of the Barcelona objective. This study (see Br´ecard et al., 2004, [41], and 2006, [40]) was made using the NEMESIS model (New Econometric Model for Evaluation by Sectoral Interdependencies and Supply) that was developed by a research consortium led by the laboratory ERASME (´Equipe de Recherche en Analyse des Syst`eme et Mod´elisation ´Economique), belonging to the ´Ecole Centrale de Paris, and the University of Paris-I-Panth´eon-Sorbonne, in France.
The NEMESIS model was built between 2000 and 2002 using funding from the European Com-mission 5th Framework programme (FP) for R&I. Historically, together with the model GEM-E3 that
is managed by the National Technical University of Athens (NTUA), it was the first detailed macroe-conomic model for the EU economy integrating an endogenous representation of R&I, that could be used for the evaluation of EU R&I policies.
While GEM-E3 became progressively specialized, by the university of Athens, in the representa-tion of energy technologies, NEMESIS continued to deepen the representarepresenta-tion of innovarepresenta-tion in every production sector, and was regularly used for the ex-ante, interim and ex-post evaluation of the EC Framework Programmes (FP) for R&I, that are the main instrument of the EU R&I strategy. We can quote for example, in 2005, the ex-ante evaluation of the 7th FP (EC, 2005, [69]; Delanghe and
Muldur, 2007, [98]), that covered the period 2007 to 2013; in 2012, the ex-ante impact assessment of the current programme (EC, 2012 – Annex 5, [115]), Horizon 2020 (2014-2020); in 2017, the ex-post evaluation of FP7, and interim evaluation of Horizon 2020 (PPMI, 2017, [272]; EC, 2017, [71]).
Though NEMESIS acquired this long track record for the evaluation of EC R&I programmes, it was fast evident that the model had its own limitations and could not answer all the questions. There was also a need to diversify the expertise, and develop, or adapt, other models for the specific task of the evaluation of EU R&I policies. There were two others models available for that. The first is the model QUEST III, developed and used by the Directorate General for Economic and Financial Affairs (DG ECFIN), where R&I mechanisms were introduced in the mid-2000s (see Roeger et alii, 2008 [281]). The second was the model RHOMOLO (Regional Holistic Model), that was developed from 2010 by the Directorate General Joint Research Center (DG JRC), in collaboration with the Directorate General for Regional and Urban Policy (DG REGIO), with a version of the model including R&I mechanisms that recently became available (Lecca and Sakkas, 2018, [212]). Then, for the first time in 2018, QUEST and RHOMOLO were used for the assessment of EC framework programmes, with, in 2018,
the ex-ante evaluation of the next programme, Horizon Europe, that was made in complement to the in-depth analysis that was performed with the NEMESIS model (EC, 2018, [72], and Boitier et al., 2018, [34]).
1.2
Subject of the thesis
The subject of this PhD thesis is to describe, as accurately as possible, the R&I mechanisms that NEMESIS, QUEST III and RHOMOLO incorporate, and how the models are used to evaluate the research policies that are introduced and monitored by the General Directorate for R&I (DG RTD) of the EC1.
QUEST III, NEMESIS and RHOMOLO are models belonging to different economic traditions, with different levels of aggregation:
QUEST is a macroeconomic Dynamic Stochastic General Equilibrium (DSGE) model, the most in line with the modern macroeconomic theory. There is one model for every EU(28) country, with microeconomic foundations explicitly derived from inter-temporal profit and utility maximization un-der perfect foresight, that mimics the main features of the general equilibrium setting of the recent theoretical models of economic growth.
NEMESIS is, as QUEST, a model for every EU(28) country, but the two models differ deeply in their modeling approach. NEMESIS is a macro-sectorial model (30 sectors) using neo-Keysesian inspiration. There are adjustment costs, adaptive expectations, wage rigidities and exogenous exchange and interest rates, which prevent the model from describing a general equilibrium, even in the long-run. The macroeconomic track in NEMESIS, is the resultant of bottom-up dynamics from the interaction between very heterogeneous production sectors, and pure macroeconomic forces, such as the influence of the household and public sectors.
RHOMOLO is a spatial model based on the new economic geography theories. It is more detailed geographically, using the general equilibrium modeling of 267 EU regional economies and their interac-tions. The model has also a sectorial dimension, each region containing 10 economic sectors. Like for
1We have limited the focus, in this thesis, to NEMESIS, QUEST III and RHOMOLO, while, at the initiative of the
DG RTD, other models are currently being developed for the analysis of the EU R&I policies, in the context of H2020 research projects FRAME and MONROE. The reason is that, when writing these lines, we did not have any reliable documentation on the R&I mechanisms that thesewill incorporate. We do not present GEM-E3 either, as the scope of this model is limited to energy technologies, that refer to different concepts and mech nisms, than those that are at the core of the NEMESIS, QUEST III and RHOMOLO models.
NEMESIS, the huge scope of RHOMOLO, prevents any forward-looking dynamic, and both models are solved according to a recursively dynamic approach.
Concerning the modeling of innovation, what the three models have in common is that they were inspired by the strong empirical evidence, that investment in R&D was at the origin of major techno-logical innovations, and TFP growth, in advanced industrialized countries over the past decades. On the theoretical side, they all refer also, explicitly or implicitly, to the New Growth Theories (NGT) that emerged from the beginning on the 1990s, with the seminal papers of Romer (1990, [284]), Grossman and Helpmann (1991, [152]), and Aghion and Howitt (1992, [4]). These NGT, echoing the main results of the abundant econometric literature on the link between R&D and productivity, insist on three main points. Firstly, technological innovation results from investments made by profit-seeking firms, motivated by the creation of monopoly rents. Secondly, inter-temporal R&D knowledge externalities, either intra-sectorial or inter-sectorial, national or international, are at the source of increasing returns. This allows them to fight against the law of diminishing returns, like the exogenous technical progress in the previous neoclassical model of economic growth introduced by Solow (1956, [300]) and Swan (1956, [306]). Thirdly, market failures produced by knowledge externalities, and the risky nature of R&I activities, mean that firms will tend, spontaneously, to under-invest in R&D, compared to the social optimum, which reinstates the role of public policy in the area of R&I.
The representation of innovation, in the three models, differs, however, depending on the way they take into account the three points above:
In QUEST III, investments in R&D provide firms with monopoly rents from the invention of new varieties of capital goods, that improve the total factor productivity in the final good sector. Therefore innovations act in the model as process innovations, similarly to the theoretical model proposed by Jones in 1995 (Jones, 1995b, [180]), that was adapted to the multi-country structure of QUEST III, with notably the introduction of international knowledge spillovers between EU countries. The particularity of the representation of innovation in QUEST III is that, following the terminology proposed by Jones, the long-run growth rate of GDP per capita is semi-endogenous. It results from investment in R&D by firms, and from that point of view it is endogenous, but its long-run growth rate cannot be influenced by public policy instruments, such as R&D subsidies of tax credits, that only have temporary effects, and therefore only influence the level of GDP, and not its growth rate.
The situation is different in NEMESIS, where it is assumed, alternatively, that the long-run growth rate of GDP per capita is “fully endogenous”, and can be influenced by policy instruments. The
representation of innovation in the model does not refer explicitly to the NGT literature, but the long-run growth process in the model is similar to the second generation of “fully endogenous” growth models, that have developed in parallel to the semi-endogenous growth approach initiated by Jones, with the seminal contributions of Young (1998, [335]), Aghion and Howitt (1998, [8]), Dinopoulos and Thomson (1998, [101]) and Howitt (1999 [165]). A second important difference between NEMESIS and QUEST III, in the representation of innovation, is that in NEMESIS, investments in R&D result in two types of innovation: there are process innovations that increase TFP, like in QUEST III, but also product innovations that raise the average quality of products. The presence of product innovation in the model is very important, as the econometric literature generally describes higher output and employment impacts for product, than for process innovations. The sectorial dimension of NEMESIS permits the representation of the exchange of knowledge, and the transfer of productivity surplus between production sectors, and between countries, that cause many channels of structural change in the model, where all the sectors, and all the countries, do not grow at the same rate.
In RHOMOLO, the modeling of innovation is still not as developed as in QUEST III and NEME-SIS. The R&I decision of firms is not modeled, and it is assumed that TFP, in the different sectors and regions, grows proportionally to the R&D stocks accumulated from exogenous public and private investments. Innovations are therefore, as in QUEST III, process innovations only. Concerning knowl-edge externalities, there is no inter-regional or inter-national dimension, but there are externalities between sectors, as it is the pool of all private and public R&D investments, that drives the TFP growth in the different sectors. This modeling of knowledge externalities remains, however, quite rudi-mentary. Finally, even if the R&D decision was endogenous in RHOMOLO, as in QUEST III, the long-run growth rate of output per capita could not be influenced by policy instruments in the model, because of the linear relationship it has between the growth rates of TFP, and the growth rate of R&D stocks. The representation of technical change in RHOMOLO therefore also belongs also to the semi-endogenous growth family.
We could finally say, from this succinct introduction to the three models, that “Applied macro modeling is the art of the compromise”, or, in the words of Blanchard, “No model can be all things to all peoples” (2017, [31]).
NEMESIS, that is grounded on empirics, is certainly the model that includes the richest mecha-nisms of technical change, when compared to the empirical literature, with both process and product innovations. There is also the recent extension of the innovation mechanisms of the model to the
role played by investments in ICTs, software and professional training, that are particularly impor-tant when representing innovation in the service sectors. The model also includes, with the various economic activities it represents, many channels of structural change resulting from investments in R&I, such as the reallocation of the labor force in the more progressive sectors. But the sectorial, and “out-of-equilibrium” approach (2014, [13]) that is followed in NEMESIS, does not ensure that the long-run behavior of the model will conform to general equilibrium prerequisite present in QUEST III, in the image of the modern theories of economic growth.
By contrast, for QUEST III, the “compromise” is at the cost of the wealth of detail of the innovation mechanisms, that are restricted by forward-looking expectations, and high theoretical constraints, that imposes the DSGE modeling.
For RHOMOLO, though, the limitations come more from data constraints, and the difficulty in representing certain phenomena, such as knowledge externalities, at a detailed regional level. But RHOMOLO should, a priori, be a very appropriate tool for analyzing, for example, the impact of the share of European Structural and Investment (ESI) funds financing R&I and human capital.
If we add to these differences in the structure of the models, the endogenous, versus, semi-endogenous representation of growth they support, we could certainly not expect that they would provide similar results when evaluating EU R&I policies, but at least that their result would comple-ment each other’s usefully. Therefore this thesis is dedicated to the presentation of the “compromise” that each of these models represents.
1.3
Organization of the thesis
This thesis is organized in three parts with two chapters each.
The first part, “The Facts and the Theories”, exposes the main findings of the empirical and theo-retical works developed, from the fifties, to measure and represent economic growth, with a focus on the role played by R&D investment and its externalities.
On the empirical side, the second chapter, “The Econometric Literature on R&D”, presents the principal concepts and results of the applied literature on R&D: The output elasticities and private rates of return from R&D, R&D spillovers and social returns from R&D, the role of public R&D and the importance of having a sufficient “absorptive capacity” of external research.
model of growth was progressively adapted to endogenize economic growth, with the introduction of monopolistic competition based on R&I investment by profit seeking firms, and the central role played, in that process, by inter-temporal knowledge spillovers.
The second part, “The Macro Models Used by the European Commission”, introduces the macro simulation models that are used by the European Commission for the evaluation of EU R&I policies. Chapter 4, “The Endogenization of Innovation on R&D”, shows how innovation is endogenized in the three Macro models that are currently available. These belong to different economic traditions, with QUEST, that is DSGE, NEMESIS, that is macro-econometric, and RHOMOLO, that is a spatial CGE model. To illustrate this, a comparison of the evaluation by the three models of the next EC Framework Programme for R&I, Horizon Europe, is also proposed.
Chapter 5, “Beyond R&D: A new Frame for NEMESIS”, describes a recent improvement on the innovation mechanisms of NEMESIS, with the concept of ICT as GPT, that was first proposed by Bresnahan and Trajtenberg in 1995 ( [43]). It extends the conceptual framework to the role played by investment in ICT and in other intangibles and not just R&D (Training and software), of particular importance for innovation in service sectors.
Finally the third part, “The Evaluation of EU R&I Policies with NEMESIS”, presents the results of recent EU R&I policy evaluation with the NEMESIS model.
Chapter 6, “H2020 Interim Evaluation”, details the methodology of the interim evaluation of the current EC R&I framework programme (PPMI, 2017, [272]; EC, 2017, [71]).
Chapter 7, “Investigating the Impacts of Innovation Union (I3U)”, enlarges the scope of policy with the results of the H2020 research project I3U2, performed, between March 2015 and September 2018: an
in-depth assessment of the 34 commitments of the Europe 2020’s Innovation Union flagship initiative (see European Commission, 2011, [70]), from three complementary approaches: the “direct” evalua-tion of the individual commitments by data mining and econometric techniques, a semi-quantitative application of the Innovation Systems theory, up to the Macro analysis of the NEMESIS model.
The reader can easily see, from this brief presentation of the organization of the thesis, that it progressively focuses on the case of NEMESIS. They are three main reasons for this:
The first, is that the author of this thesis was, from the beginning in 2000, working with Arnaud Fougeyrollas and Paul Zagam´e, the main creators of the NEMESIS model, and of the endogenous
growth mechanisms it incorporates. This PhD thesis is therefore also a way to highlight all the work that was achieved over this period of now nearly twenty years.
The second, is that the two other models, QUEST III and RHOMOLO, have begun only recently, with the case of Horizon Europe, to be applied to official evaluation of EU R&I policies. This has posed a limit to the possible illustrations of the results for these two models.
The third, is that the recent improvement of the innovation mechanisms of NEMESIS, that extends the range of innovation inputs to investments in ICTs and in other intangibles and not just R&D (Software and professional training), represents, in our opinion a very important development, that could be the subject of a full PhD dissertation. It is the first time that an applied detailed macro model includes such mechanisms. This extension of the model was achieved in a very tentative way, because of the lack of data, of empirics and of solid theoretical background, so must be used with these limitations in mind; it nevertheless considerably widens the range of innovation policies that the model could assess. A lot of innovation occurs today in the service sectors, and from the “servitization” of an increasing part of the industrial sectors, that we see in the emergence of the internet giants, and the case of the GAFA. Therefore, this new version of the model appears to be better adapted to represent innovation in the service sectors, the transformation of the frontier between industry and services, and the specific increasing returns, and inter-temporal externalities, arising from the development of the broadband, and from the investments in ICTs and in a broader range of intangible assets, than R&D alone.
The Econometric Literature on
R&D
In this chapter we describe the main findings in the abundant econometric literature on R&D, innovation and productivity, that developed from the late 1950s, and that motivated the endogenous technical change modeling that was introduced in NEMESIS, and in other macro simulation models for the EU economy.
The objective is not to present an exhaustive survey, but to find the key features that should be present in macro simulation models, when endogenizing technical change and innovation. These features concern the size of the output and Total Factor Productivity (TFP) elasticities from R&D (in different industries and countries), the private and social rates of return from R&D, the role played by R&D spillovers, the impacts of private/public, basic/applied research, and the distinction between product and process innovations.
In the literature, R&D is generally used as a proxy for innovation, whereas R&D is only one input in the complex process leading to innovation, productivity and economic performance. The reason is that there is not much data on innovation inputs and outputs.
For example, data on ICT investment, that is an important driver for innovation in service in-dustries, is still scarce, even if some progress has been achieved with databases such as EU-KLEMS ( [309]). Recent databases, e.g. INTAN-Invest ( [74]), also provide time series, beyond R&D, on other important innovation inputs such as software, training, design, new financial products, mineral exploration and artistic originals, advertising and organizational capital. Other data sources have de-veloped that are increasingly used, such as the CIS surveys1, but these data are qualitative or only
semi-quantitative, and not well-suited for macroeconomic modeling, that is based on time series and data compatible with national accounting formats.
For innovation outputs, the situation is quite similar. There are few quantitative sources of infor-mation for measuring the different types of innovation2(e.g. new processes, new/improved products,
organizational, ..) and the available data are nearly exclusively qualitative (from CIS and similar surveys). Patent data, that exist from over a century and at a very detailed technology level, can be used, as suggested originally by Giliches et al. (1986, ( [149]) and by Griliches (1990, [143]), as good proxies for innovation output. But, if it works for technological innovations by industrial firms, it is less suitable for service industries where innovations are not patentable. Or the bulk of inno-vation, nowadays, occurs in service sectors, that represent about 80% of total value-added in OECD
1See https://cordis.europa.eu/news/rcn/10048/en
2See OECD Oslo manual for a precise definition of innovation:
countries. There are other limits to patent data, such as the fact that process and organizational innovation are generally not patentable. They consequently describe nearly exclusively product-type innovations. Furthermore, all industries do not have the same propensity to patent, which represents another limitation, for example for the purpose of inter-sectorial comparisons.
Despite these limitations, the literature on R&D and productivity has provided rich and diverse results on the way firms innovate, and on the economic performance of their innovations. While most of the studies are on manufacturing industries where R&D investment is concentrated, the methodologies developed also allow for the measurement of the impact of the technological innovations developed by industrial sectors in the user sectors. There are numerous ways to do that, for example by using inter-industrial transaction matrices as in Terleckyj (1974, 1980), or in Sakurai et alii (1996, [288]) in an international setting. For illustration, the latter show, for 10 OECD countries in the period 1970-1980, that “While innovations are developed mainly in a cluster of high technology manufacturing industries, the main acquirers of technologically sophisticated machinery and equipment are a different cluster of industries in the service sector, with technology generation much more concentrated than technology use”.
Starting from the presentation in Hall et alii ( [155]), we first recall the general aim of the studies and present the first methodological issues, important for understanding and interpreting their results. We then turn to the presentation of the key findings of the literature on the most investigated issues already evoked above, that are all central for the endogenization of technical change in macro models. They concern:
1. The size of the output and TFP elasticities resulting from R&D capital. If there exists “excess” -or “above” n-ormal - returns from R&D capital, how large are they, e.g. compared to the returns of physical capital?
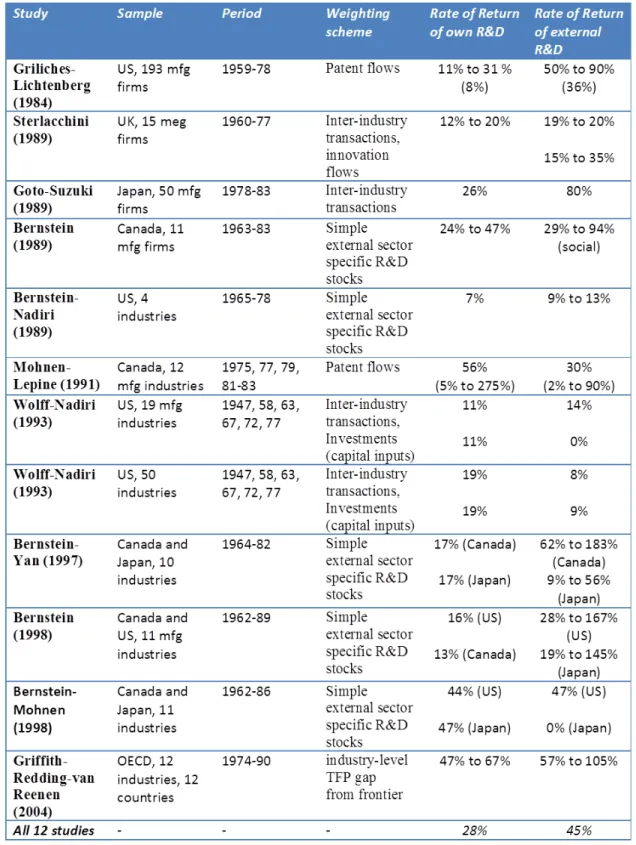
2. The contributions to productivity growth of the two kinds of R&D spillovers distinguished by Zvi Griliches (1979, [141]), the “rent” spillovers, occurring mainly from economic transactions between firms and countries, and the “pure” knowledge spillovers, coming from the accumulation of knowledge over time.
3. The social returns from R&D capital. How to measure them and how large are they?
4. The distinct impacts of public/private R&D, basic/applied research and process/product inno-vations.
2.1
Objectives and first methodological issuesEmpirical literature measuring the contribution of technical progress to economic growth first appeared in the 1950s, with the development of coherent and harmonized systems of national accounts3. At that
time, the development of the production theory and the introduction of the concepts of factors efficiency and total factor productivity, allowed the progress of growth accounting; then the Solow (1957 [301]) study, “Technical change and the aggregate production function”, proposed a first and theoretically well-grounded, empirical measurement of the contribution of technical change to economic growth.
In this breakthrough 1957 study, Solow showed that up to 87.5% of the growth of labor productivity in United States for the period 1909-1949 was attributable to exogenous technical change; but the development of accounting techniques, up to today, by introducing differentiated categories of capital and labor inputs, allow an important reduction in the measured contribution of exogenous technical change to productivity and economic growth. Dale Jorgenson, advocated in that direction (1996 [85]): “(...) with ‘full’ measures of capital and labor inputs (. . . ) exogenous productivity growth accounts only
for 17 percent of growth”.
The development of growth accounting, the main approach used for analyzing productivity growth up to the early 1970s, explained an increasing part of the Solow residual. It is still useful to assess the distinct contributions to productivity growth by the labor force composition, capital deepening and exogenous technical change. But it relies on an exogenous representation of growth, like in the Solow’s 1956 ( [300]) seminal paper, and cannot provide a better understanding of the process of economic growth per se.
In parallel to the development of growth accounting techniques, theoretical and econometric studies tried to open the “black box” of the Solow residual. The main idea was that technical progress, that permitted the fight against the law of “diminishing returns” and acted as an engine of growth in the Solow (1956, ibid ) model, was not “manna from heaven”, as Solow expressed himself in his 1957 paper: “I am using the phrase ‘technical change’ as a shorthand expression for any kind of shift in the production function. Thus slowdowns, speed-ups, improvements in the education of the labor force, and all sorts of things will appear as ‘technical change.’”. The general idea was that all the phenomena that could generate increasing returns and improve the productivity of economic resources participate in what was called “technical change”.
3Follow this link for a recap of the history of national accounting from the pioneering works of Richard Stones at the
On the empirical side, the evidence that investments in research by private firms, by government and by universities, are at the origin of the major technological innovations in advanced industrialized countries over the last decades, motivated the development of an abundant econometric literature, aiming to demonstrate the role played by R&D investments and R&D spillovers, in the process of technical change and economic growth.
The main empirical challenge was therefore, in complement to the the growth accounting framework, to “explain” the specific contribution of the growth of knowledge in the process of economic growth. For that, the general methodology that was adopted, from the early works of the late 1950s, was to link the Solow residual, as measured from growth accounting techniques, econometrically to the investments in research by private firms and by public research units. R&D data, that were fast available with a great level of detail4, were therefore used in these studies as a proxy for technological innovations at
the origin of technological change and TFP growth.
2.1.1
The framework inherited from growth accounting literatureMost of the empirical studies on innovation and productivity start from Solow’s (1957, ibid ) growth accounting framework, based on the production function. The general methodology used by these studies can be presented in a simplified manner by considering, in a first step, that the output is produced with a Cobb-Douglas production function involving an exogenous time trend, eθti.t, and a
set of traditional production inputs, here: 1. Physical capital: Kit., 2. and Labor: Lit. We have therefore: Yit= Ai·Kitαki·L αli it ·eθti.t (2.1.1)
where Ai is a scale parameter, θti, αki,and αli, are elasticity parameters and with, i and t
respec-tively the firm (the industry or the country) and the time indexes5.
4From the successive versions of the OECD ANBERD (Analytical Business and Enterprise Research and Development)
database, see: http://www.oecd.org/sti/inno/anberdanalyticalbusinessenterpriseresearchanddevelopmentdatabase.htm
5In practice, studies at aggregate of national level omit intermediate inputs, such as materials and energy, among
production factors, as in Solow (1957). In this case, the measurement of output that is used is value-added or GDP; while it is production, when the intermediate inputs are introduced in the analysis.