Publisher’s version / Version de l'éditeur:
Vous avez des questions? Nous pouvons vous aider. Pour communiquer directement avec un auteur, consultez la première page de la revue dans laquelle son article a été publié afin de trouver ses coordonnées. Si vous n’arrivez pas à les repérer, communiquez avec nous à [email protected].
Questions? Contact the NRC Publications Archive team at
[email protected]. If you wish to email the authors directly, please see the first page of the publication for their contact information.
https://publications-cnrc.canada.ca/fra/droits
L’accès à ce site Web et l’utilisation de son contenu sont assujettis aux conditions présentées dans le site LISEZ CES CONDITIONS ATTENTIVEMENT AVANT D’UTILISER CE SITE WEB.
Thermal Performance of Exterior Envelopes of Whole Buildings X International
Conference [Proceedings], pp. 1-15, 2007-12-02
READ THESE TERMS AND CONDITIONS CAREFULLY BEFORE USING THIS WEBSITE. https://nrc-publications.canada.ca/eng/copyright
NRC Publications Archive Record / Notice des Archives des publications du CNRC :
https://nrc-publications.canada.ca/eng/view/object/?id=45510f6e-d4b4-4488-9d80-c56966ade193 https://publications-cnrc.canada.ca/fra/voir/objet/?id=45510f6e-d4b4-4488-9d80-c56966ade193
NRC Publications Archive
Archives des publications du CNRC
This publication could be one of several versions: author’s original, accepted manuscript or the publisher’s version. / La version de cette publication peut être l’une des suivantes : la version prépublication de l’auteur, la version acceptée du manuscrit ou la version de l’éditeur.
Access and use of this website and the material on it are subject to the Terms and Conditions set forth at
Simulation of wind-driven rain effects on the performance of a
stucco-clad wall
http://irc.nrc-cnrc.gc.ca
S i m u l a t i o n o f w i n d - d r i v e n r a i n e f f e c t s o n t h e
p e r f o r m a n c e o f a s t u c c o - c l a d w a l l
N R C C - 4 9 4 4 1
T a r i k u , F . ; C o r n i c k , S . M . ; L a c a s s e , M . A .
A version of this document is published in / Une version de ce document se trouve dans: Thermal Performance of Exterior Envelopes of Whole Buildings X International
Conference, Clearwater Beach, FL., Dec. 2-7, 2007, pp. 1-15
The material in this document is covered by the provisions of the Copyright Act, by Canadian laws, policies, regulations and international agreements. Such provisions serve to identify the information source and, in specific instances, to prohibit reproduction of materials without written permission. For more information visit http://laws.justice.gc.ca/en/showtdm/cs/C-42
Les renseignements dans ce document sont protégés par la Loi sur le droit d'auteur, par les lois, les politiques et les règlements du Canada et des accords internationaux. Ces dispositions permettent d'identifier la source de l'information et, dans certains cas, d'interdire la copie de documents sans permission écrite. Pour obtenir de plus amples renseignements : http://lois.justice.gc.ca/fr/showtdm/cs/C-42
Simulation of Wind-Driven Rain
Effects on the Performance of a
Stucco-clad Wall
F. Tariku; S. M. Cornick and M. A. Lacasse
Institute for Research in Construction, NRC Canada, Ottawa, Ontario, Canada
ABSTRACT
A climate sensitivity study was undertaken to analyze the effects of wind-driven rain on the performance of a stucco-clad wall using the advanced hygrothermal model, hygIRC. The performance of the wall is assessed based on whether or not the wall meets prescribed failure criteria. The failure criteria are based on the concurrent occurrence of temperature and relative humidity above thresholds of 10oC and 95% respectively, for ninety consecutive days at any location of wood based material in the wall. The primary variables under consideration are climatic conditions, which are selected based on the moisture index (MI), and the amount of liquid water that penetrates and is deposited inside the wall. The moisture index relates to the severity of a given climate in respect to wall assemblies and is based on the degree of wetting and drying to which a wall can potentially be subjected. A number of simulations are carried out with various combinations of climatic location and internal moisture load.
From the results of simulations, it was observed that neither the total amount of rain intrusion over a year, nor a single significant wind-driven event exclusively determines the performance of the stucco-clad wall. Rather watertighness performance depends on the total balance of wetting and drying potential of a given climate. It is shown that, for specified climates, wind-driven rain, frequency of rain and high relative humidity contribute to the wetting potential, whereas ambient temperature, low humidity, solar and long-wave radiation exchange with the surrounding contribute to the drying potential of the climate. It is also suggested that the wind-driven rain load might give a better indication of the severity of the climatic condition than moisture index for the wall type (stucco-clad wall) considered in this study.
1. INTRODUCTION
The question of adequate level of performance cannot be addressed unless there is some measure of performance, or non-performance by which to assess different claddings or indeed, as is the case in this study, to determine the climate loads that will bring about failure in a given wall system. A pre-condition of failure would constitute the transfer of moisture beyond the sheathing membrane (i.e. in-board of the second line of defense) to moisture sensitive components of the wall assembly. Failure would be based on the existence of a high risk of formation of mold or rot in the components of the wall where there is high moisture accumulation. High risk implies that there coexists a condition for mold growth or rot formation sufficiently long and severe to permit the development of either mold or rot on the wood-based elements of the wall assembly. The length of time would be dependent on the type of material, its moisture content and temperature profile over time. It has been shown that wood-based elements having moisture contents in excess of 20% (wt.) concurrently at temperatures exceeding 10°C would most likely form mold (95% chance) within a period of 90 consecutive days in this condition (Baker 1969; Carll and Highley 1999; Nofal and Morris, 2003). The germination and growth rates of mold in relation to hygrothermal boundary conditions (temperature and relative humidity), substrate conditions and exposure period are increasingly become an area of interest in both experimental (Black and Straube, 2007) and numerical modeling (Sedlbauer, 2002) research. The moisture content and temperature profile of the component over time
would likewise be dependent on the nominal configuration of the wall assembly, the interior boundary conditions and the climate loads to which it would be subjected.
The intent of this work is to analyze the effect of wind-driven rain on the performance of a stucco-clad wall assembly built in climate zones defined by the moisture index (MI) for a range of values of MI. The moisture index has been defined in (Cornick et al. 2001) as a basis for its use in the National Building Code Canada (2005). This climate sensitivity study is undertaken using the IRC’s advanced hygrothermal model, hygIRC.
2. DESCRIPTION OF THE HYGROTHERMAL MODEL
A detailed description of the advanced hygrothermal model used in this study was previously published by Karagiozis (1993, 1997), Salonvaara and Karagiozis (1994) and Hens (1996). Here, a brief description of the mathematical model is presented. The model solves, simultaneously, the three interdependent transport phenomena of heat, air and moisture in a building component. The mathematical model is based on building physics and comprises a set of partial differential equations that govern the individual flows. The corresponding governing equations are as follow:
Moisture balance:
(
v w)
(
w p vw
u
K
g
D
w
p
t
ρ
ρ
δ
∂
+ ∇ ⋅
+
= ∇ ⋅
∇ +
∇
+
∂
r
r
&
)
m
s (1) Heat balance:(
,)
(
)
(
)
l o a p a v p v icef
T
c
u
c T
T
L
p
L
w
t
t
ρ
∂
+ ∇ ⋅
ρ
= ∇ ⋅
λ
∇
+
∇ ⋅
δ
∇
−
∂
+
∂
∂
r
&
sQ
(2)Air mass balance:
(
ρ
au
)
0
∇ ⋅
r
=
(3)Momentum balance (Darcy equation)
a
k
u
η
= −
∇
r
P
(4)0
a ak
P
ρ
η
−∇ ⋅
∇
=
(5) where:w
=moisture content (kg/m3);u
r
=air velocity (m/s);ρ
v=water vapor density (kg/m3
); =liquid water permeability (s);
K
w
ρ
=density of water (kg/m3);g
r
=acceleration due to gravity (m/s2); =moisture diffusivity (mw
D
2/s);
δ
p=vapor permeability (s);p
v=vapor pressure (Pa);m
&
s=moisture source(kg/m3);
c
=effective heat capacity (J/kg.K);ρ
o=dry density of the material (kg/m3);T
=temperature (oC);a
ρ
=density of air (kg/m3);c
p a, =specific capacity of air (J/kg.K);λ
=effective thermal conductivity (W/m.K); =latent heat of evaporation/condensation (J/kg); =latent heat of freezing/melting (J/kg);=fraction of water frozen (-);
v
L
L
icel
f
Q
&
s=heat source (W/s.m3);k
a=air permeability (m2); and
η
=dynamic viscosity (kg/ms).The driving potentials of moisture transport, Equation (1), are vapor pressure and moisture content. The advanced model includes two important moisture transport mechanisms, in addition to diffusion process: water vapor transport by convection and liquid water transport by gravity as expressed by the second and third terms of the left hand side of the equation, respectively. The model has also the capability of handling volumetric moisture sources or sinks as represented by the last term in the right hand side of the equation. Temperature is the driving potential for the heat balance equation, Equation (2). The transfer of heat by convection and diffusion are represented by second (l.h.s) and first (r.h.s) terms of the equations, respectively. The heat source or sink associated with phase changes are represented by the second (evaporation/condensation) and third (freeze-thaw) terms of the right hand side of the equation. Any other internal heat source or sink is given by the last term of the of the right hand side of the equation. The mass balance equation for incompressible fluid is given by Equation (3). In a building physics application, the air is considered as incompressible due to very low airflow speeds, and low pressure and temperature changes. The Darcy equation, Equation (4), is a reduced form of the Navier-Stokes momentum equation for flow in a porous media. Combing the mass balance, (Equation(3)) and momentum balance (Equation (4)) equations gives Equation (5).
3. HYGROTHERMAL MODELING
Outputs derived from the simulation software include transient states of moisture content, temperature and airflow distribution in the calculation domain for the applied time-varying boundary and prescribed initial conditions. The application of the model has been demonstrated in a number of publications, including: Karagiozis et al. (1996), Djebbar et al. (2002), Mukhopadhyaya et al. (2006). The model has been validated with well controlled laboratory experiments (Maref et al. 2000; Kumaran and Wang 2002; Tariku and Kumaran 2002), and a field experiment in which a wall is exposed to real environmental conditions (Tariku and Kumaran 2006).
In this paper, the hygrothermal performance of a stucco-clad wall system subjected to time varying internal and external boundary conditions, as well as an additional time varying internal moisture source is investigated. The internal moisture load, which simulates wind-driven rain intrusion into the wall, was determined by considering the local climate, topography, building geometry and defect type, and was introduced in a similar way as the experimental methodology provided by Lacasse et al. (2003) or that developed by Teassdale-St-Hilaire et al. (2003), except that the predefined water is injected in the exterior rather than interior surface of the sheathing board, and the drying and wetting phenomena is monitored for an extended period of time. The primary variables under consideration are climatic conditions, which are selected based on the MI (shown in Table 1), and the amount of liquid water that penetrates and deposited inside the wall. The main input parameters that are required to simulate the dynamic response of the wall system are: the wall configuration, hygrothermal properties and initial conditions of each layer, indoor and outdoor boundary conditions as well as the internal moisture source. These parameters are described below.
3.1 Wall configuration
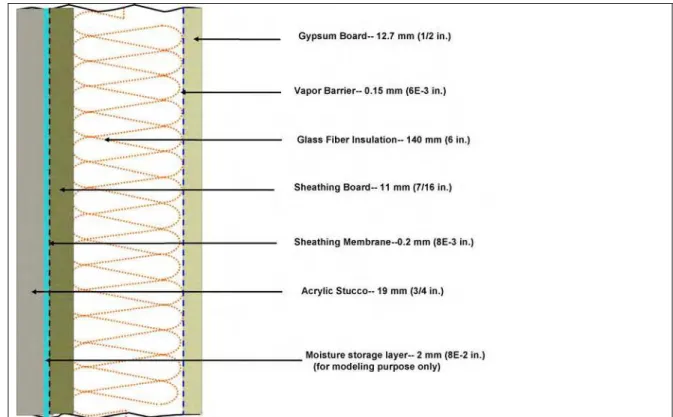
For this study a 2 by 6-in. (38 by 140-mm) stucco-clad wall system is considered. As shown in Figure 1 below, the wall comprises the following layers from exterior to interior, in sequence: Acrylic stucco (19 mm), Moisture storage layer (not a true “wall layer” only for modeling purpose, 2 mm), Sheathing membrane (asphalt-impregnated building paper, 0.2 mm), Sheathing board (OSB, 11 mm), Insulation (Glass fiber, 140 mm), Vapor barrier (Polyethylene, 0.15 mm / 6 MIL) and Interior finish (Gypsum board, 12.7 mm).
The moisture storage layer, located at the innermost section of the stucco cladding and having a 2 mm thickness, is contrived for modeling purposes to reproduce the effect of moisture deposition and retention in the interstitial space and as well, permit moisture transfer to occur at the interface. The hygrothermal properties of the moisture storage layer are the same as the cladding material, stucco, with the exception that the maximum moisture storage capacity is higher than that of stucco. In this multilayer system, adjacent layers are assumed to be in a perfect contact and their hygrothermal properties are taken from the MEWS and ASHRAE research projects (Kumaran et al. 2002a, 2002b). These include: density, water vapor permeability, liquid diffusivity, sorption-isotherm and moisture retention, heat capacity, thermal conductivity, and air permeability.
Figure 1. Schematic diagram of stucco wall cross-section under study.
3.2 Initial and boundary conditions
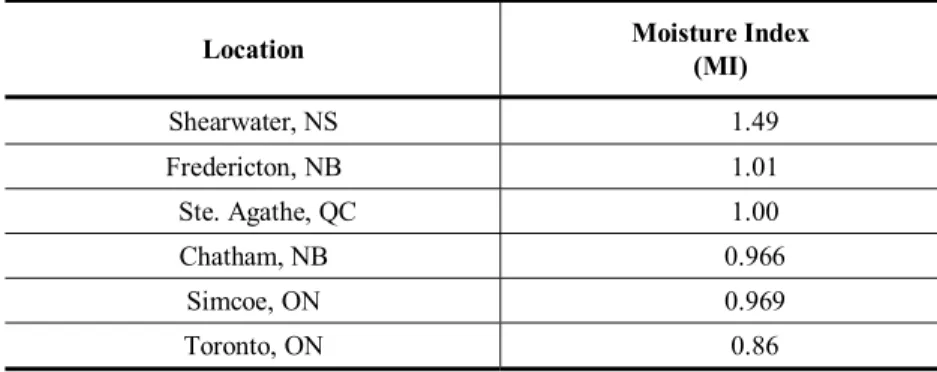
In the simulation, the wall is exposed to “real” weather conditions on the outside surface and controlled temperature and relative humidity conditions on the indoor surface. The hourly weather data that comprises temperature, relative humidity, wind speed, wind direction, global radiation, diffuse radiation, reflected radiation, rain and cloud index of selected regions are taken from IRC’s existing climate database. The selected six geographic locations, shown in Figure 2, at which the stucco-clad wall performance is investigated are listed in Table 1. All locations, with the exception of Shearwater, have MI close to one. Shearwater is chosen because it provides a location for which MI is greater than one and against which the response of cladding systems at other locations can be compared.
Table 1. Geographic Locations Considered
Location Moisture Index
(MI) Shearwater, NS 1.49 Fredericton, NB 1.01 Ste. Agathe, QC 1.00 Chatham, NB 0.966 Simcoe, ON 0.969 Toronto, ON 0.86
For each location, the dynamic response of the stucco wall system is simulated over a period of three years. This approach is similar to that used in the MEWS project (Cornick et al. 2002) for which additional information can be found in Cornick and Dalgliesh (2003) and Cornick et al. (2003). The three years are selected from the available weather data for the location based on the annual wind-driven rain load. The selected years are assembled in “average-wet-wet” year sequence for the simulation. The first year is used to condition the wall, and the final two years are used as a basis for analysing the hygrothermal response of the wall assembly.
The indoor temperature and relative humidity are set, respectively, to 21oC and 30% during the winter and 24oC and 50% in the summer. These settings are based on ASHRAE recommendations for conditioned space (ASHRAE 2003). The heat and moisture fluxes to which the internal boundary surface is subjected are calculated using constant values of heat and mass transfer coefficients of 8 W/m2K and 5.8E-8 s/m, respectively. The heat and moisture fluxes applied to the exterior surface of the wall are calculated using variable heat and mass surface transfer coefficients. The heat transfer coefficient is a function of wind speed, and the mass transfer coefficient is deduced from the heat transfer coefficient using the Lewis relation (ASHRAE 2005). The initial conditions for all layers of the wall are assumed to be 21oC and 50% for temperature and relative humidity, respectively.
3.3 Relating the Internal moisture source to climate loads
This internal moisture source represents liquid water that might conceivably be trapped between the cladding and sheathing membrane due to the ingress of wind-driven rain beyond the cladding. This moisture load is uniformly distributed across the thickness of the moisture storage layer, and expressed as the amount of water in kilograms deposited in a unit volumetric space of the moisture storage layer in an hour (kg/m3.hr). The quantity of deposited water is related to the percentage of wind-driven rain that impinges the wall (estimated based on Straube and Burnett (2000) simplified method), and calculated on an hourly basis from the assembled weather data. For a given location the internal moisture load is increased, as required for simulation purposes, in specified proportions, i.e. 0.5, 1, 2, 3, 4% of wind driven rain, until the internal moisture load causes the wall to fail (i.e. met the failure criteria).
4. SIMULATION RESULTS
A series of hygrothermal simulations were performed with the objective of providing information on the performance of a stucco-clad wall system subjected to various climate loadings, its response to water intrusion due to wind-driven rain, and the likelihood of failure given the response to climate loads. The initial strategy was to consider a specific geographic location, which provides a definitive climatic load, and increase the amount of moisture intrusion in the interstitial space between the stucco-clad and sheathing membrane in step-wise fashion until the failure criteria was met. A control volume with high moisture load was used for analyzing and interpreting the simulation results. This particular control volume was chosen after examining the hygrothermal conditions of all control volumes of wood based components during the entire simulation period. With this approach the onset of failure at any cross-section of the component could be identified and thereafter analyzed.
The failure criterion adopted in this study was the concurrent occurrence of daily average temperature and relative humidity for any location of wood-based material in the wall assembly above 10oC and 95%,
respectively, for a period of 90 consecutive days. Given the nature of the wall configuration, the layer of interest in respect to failure of wood-based components of the assembly is the sheathing board, in this instance, a 11-mm thick oriented strand board (OSB). This criterion is based on the assumption that a wall whose performance matches the criteria provides a favorable hygrothermal condition for mold growth as was previously described in the Introduction.
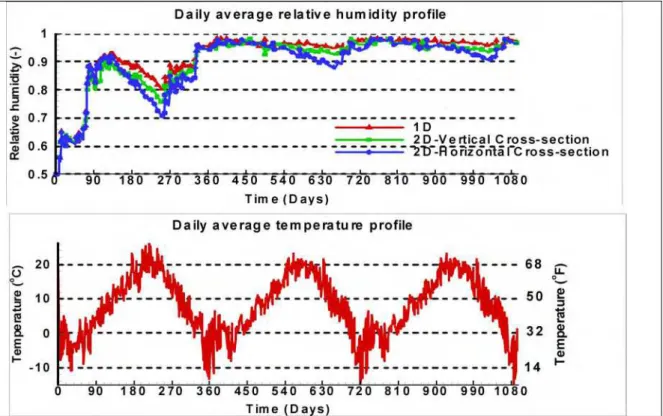
Preliminary simulations were first carried out to investigate the dimensionality of the problem. This was done by comparing the simulation results of the one- and two-dimensional modeling of the wall using the same modeling input parameters. The two-dimensional version of the model was used for two computational domains shown in Figure 3: vertical and horizontal cross-sections of the wall. As shown in the Figure 4, the relative humidity profile of a control volume of the sheathing board with high moisture content and just behind the stud (referring to the horizontal cross-section of the wall) is relatively dryer than the other two cases (one-dimensional and two-dimensional analysis of the vertical cross-section). This is because the moisture from the wetted sheathing board is redistributed through the stud by capillary liquid flow, thereby reducing the moisture content in the sheathing board. Whereas for the other two configurations, the drying process was slow given that the insulation (glass fiber) is not a capillary active media and the only means of drying the sheathing board is through vapor diffusion. Hence, based on the simulation methodology adapted in this work, this implies that the worst-case scenario in which the sheathing board could retain high moisture content and thus favor mold growth, is one that focuses on the interior face of the sheathing board in contact with the insulation rather than the stud. Figure 4 also shows that there is no significant difference between the one-dimensional and two-dimensional analysis of the vertical cross-section of the wall in the predictions of relative humidity in the critical part of the sheathing board. The reason could be due to the fact that the principal load on the exterior of the wall is wind-driven rain, which creates high moisture gradients in the horizontal direction, but no significant heat and moisture gradient in the vertical direction. The limited moisture movement in the second-dimension (vertical direction) could also be due to the low moisture transfer properties (liquid and vapor permeability) of the sheathing board. As suggested in these preliminary simulation results, the problem could just as well be represented as a one-dimensional problem. Consequently, a series of one-dimensional iterative simulation procedures were carried out for each location.
Figure 3. Vertical and horizontal cross-sections of a Stucco clad wall; shown in the left and right, respectively.
Figure 4. Comparison of simulation results (relative humidity and temperature of the critical section of OSB) of a stucco-clad wall with one- and two-dimensional models
having the same input parameters.
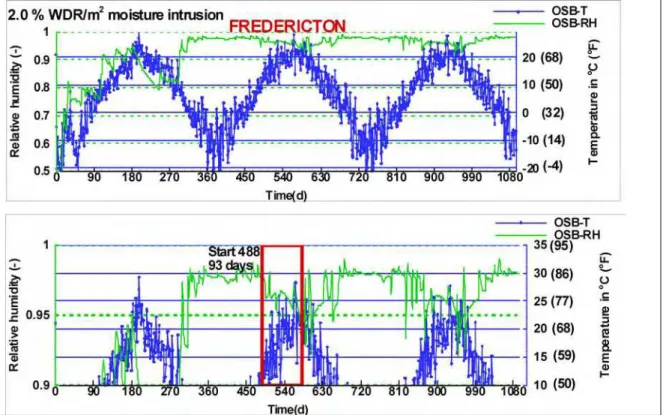
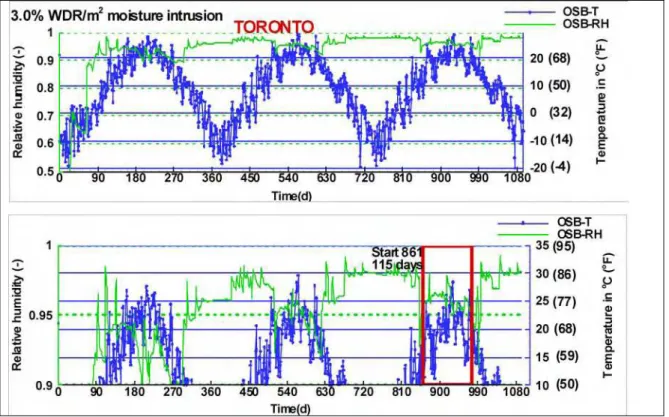
Although a number of iterative simulations were performed for each location, only the final simulation results are presented for which wall failure is evident from the plot of these results. For each of the six locations, the temperature and relative humidity time history of a section of OSB (a control volume which is found to be critical compared to the rest of OSB), when the stucco wall is assumed to have failed to manage the introduced water, and consequently satisfied the failure criteria, are presented in Figure 5-10.
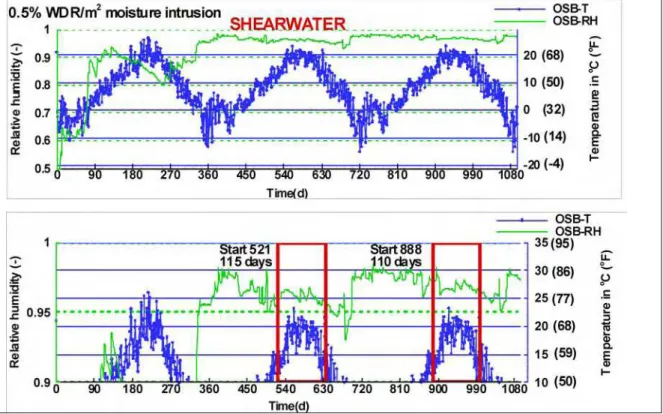
The upper figure provides the full range of values of average daily hygrothermal response over time (3-years; ca. 1080 days) in terms of relative humidity (left axis-green line) and temperature (right axis-blue line). The lower figure, shows a reduced set of data over the same time frame for which only values of temperature above the 10oC threshold and corresponding values of relative humidity are shown. Hence in the lower figure the relative humidity ranges between 90 and 100% and the temperature between 10oC and 35oC. The line demarking the limit above which the relative humidity meets the failure criterion (i.e. 0.95) is shown with a green dotted line. The parallel vertical red lines (forming a box) represent the time period in which both the temperature and relative humidity criterion for failure are met. The start and duration of this period is indicated, as is the number of days over which the criterion is met. As a means of interpreting the data, the failure criterion is met if the relative humidity response occurring within the limits of the “red box“ also lies above the green dotted line. That is, there are at least 90 consecutive days for which the wood-based component has been subjected to conditions of at least 10oC and 95 % RH.
Figure 5. Temperature and relative humidity responses of a wall exposed to Shearwater climate condition and an internal moisture source of 0.5% wind-driven rain load.
Figure 6. Temperature and relative humidity responses of a wall exposed to Chatam climate condition and an internal moisture source of 1% wind-driven rain load.
Figure 7. Temperature and relative humidity responses of a wall exposed to Fredericton climate condition and an internal moisture source of 2% wind-driven rain load.
Figure 8. Temperature and relative humidity responses of a wall exposed to Ste Agathe climate condition and an internal moisture source of 3% wind-driven rain load.
Figure 9. Temperature and relative humidity responses of a wall exposed to Toronto climate condition and an internal moisture source of 3% wind-driven rain load.
Figure 10. Temperature and relative humidity responses of a wall exposed to Simcoe climate condition and an internal moisture source of 4 % wind-driven rain load.
As the results show the stucco wall assembly subjected to the climate of Shearwater fails in the second year given that 0.5% of the wind-driven rain (WDR) managed to be deposited in the interstitial space between the cladding and sheathing membrane. The failure is repeated in the third year as well. The same wall subjected to the climate of Chatham fails in the second year when the amount of water intruded is 1% of the WDR. In Fredericton, Ste Agathe, Toronto and Simco, the wall fails at 2, 3, 3 and 4% WDR, respectively. A summary of the critical moisture loadings causing failure in the six respective locations is given in Table 2.
Table 2. The Percentage of Wind-Driven Rain at which the Wall Met the Failure Criterion
Location MI Percentage of wind-driven rain
(%WDR) Shearwater, NS 1.49 0.5 Chatham, NB 0.97 1 Fredericton, NB 1.02 2 St. Agathe, QC 1.00 3 Toronto, ON 0.86 3 Simcoe, ON 0.97 4 5. DISCUSSION
As presented in Table 3, simulations of the stucco-clad wall indicate failure in Shearwater with only 0.5% of wind-driven rain intrusion. For this location, and up to the time when failure occurs, the wall is subjected to a total water deposition of 5.0 liters and a maximum moisture load for a single rain event of 137 ml/hr. However, the same wall in Ste. Agathe can accommodate a total moisture load of 18.2 liters and maximum moisture input of 251 ml/hr over this period. This suggests that the failure in Shearwater occurs at a lower percentage of wind-driven rain intrusion because of the cumulative effects of small and medium sized rain events that are frequent enough to prevent sufficient drying between events. Hence, there is an increasing trend in moisture uptake in the critical components over the simulation period. Moreover the simulation results implies that neither the amount nor the maximum water intrusion exclusively determines the performance of the wall, but rather the drying potential of the climate in which the wall is built has more significant influence. The net effect of the dynamic loading on the external surface of the cladding is the balance of the wetting and drying potentials of the climate, and the characteristic response of the wall to the indoor and exterior boundary conditions. Hence, for a given climate, wind-driven rain, frequency of rain and relative humidity contribute to the wetting potential, whereas ambient temperature, solar and long-wave radiation exchange with the surroundings contribute to the drying potential.
Table 3. Summary of Moisture Loading at the Time of Failure
Location MI Failure at % of WDR Total Moisture Input (l) Maximum Moisture Input (ml/hr) Shearwater 1.49069 0.5 5.0 137 Chatham 0.96648 1 5.8 135 Fredericton 1.01592 2 7.9 150 Ste. Agathe 1.00267 3 18.2 251 Toronto 0.86052 3 16.6 356 Simcoe 0.96982 4 11.4 783
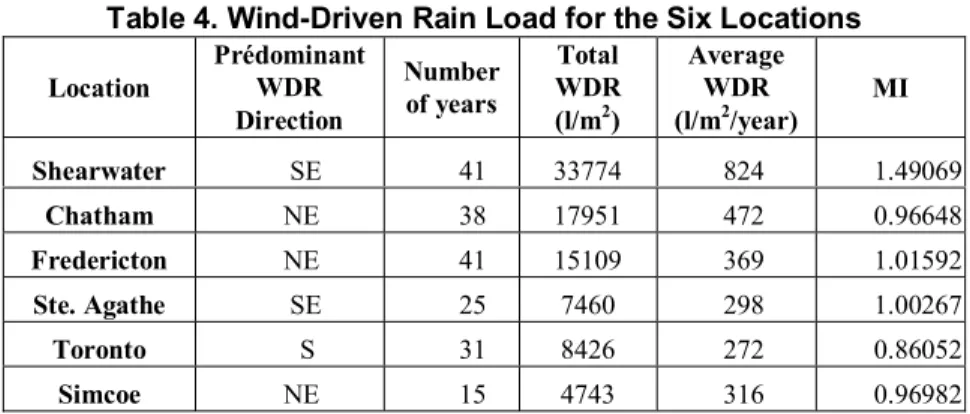
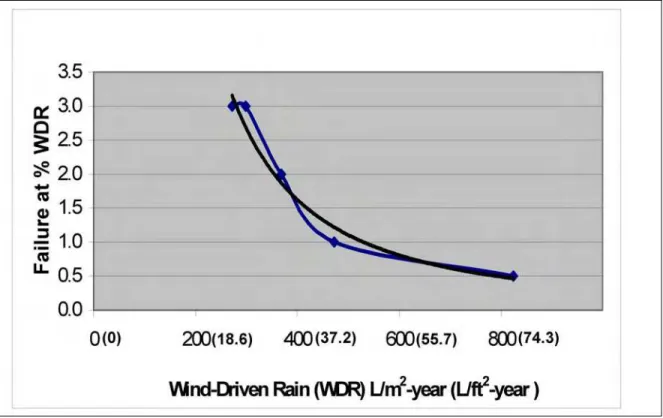
Table 4 provides the predominant direction of wind-driven rain for the location, the total and average wind-driven rain loads, and the corresponding moisture index for the six locations. The total and average wind driven rain loads are for the predominant direction, and calculated by considering all the available weather data (years) for the location. Using the simulation results and the information in Table 4, a relationship between wind-driven rain load and the amount of moisture loading that causes the stucco-clad wall to fail is shown in Figure 11. The average wind-driven rain load correlates more closely to the failure indicator (quantity of water that brings about failure) as compared to the moisture index, Figure 12. Indeed, the relationship between wind-driven rain and the failure indicator can be expressed by a power function, and provides a means to determine, for a given location (i.e. known wind-driven rain load derived from weather data) and specific wall assembly (in this case, a stucco-clad wall assembly) the critical amount of water that can bring about failure as a percentage of wind-driven rain load (or percentage of defect area). In contrast, and as shown in Figure 12, the relationship between the failure indicator and the moisture index is not as well defined. For example, Chatham (MI = 0.97), which has a lower moisture index than Fredericton (MI = 1.02), fails at a lower moisture load (1%-WDR) than Fredericton (2%-WDR). The same argument holds true for Toronto and Simcoe. This suggests that for the wall type considered in this study, a criteria for failure based on wind-driven rain load might provide a more consistent indication of the severity of climatic conditions than has the Moisture Index.
Table 4. Wind-Driven Rain Load for the Six Locations Location Prédominant WDR Direction Number of years Total WDR (l/m2) Average WDR (l/m2/year) MI Shearwater SE 41 33774 824 1.49069 Chatham NE 38 17951 472 0.96648 Fredericton NE 41 15109 369 1.01592 Ste. Agathe SE 25 7460 298 1.00267 Toronto S 31 8426 272 0.86052 Simcoe NE 15 4743 316 0.96982
On the basis of the relationship shown in Figure 11, it might be possible to predict the likelihood of adequate performance of a stucco-clad wall at a given location knowing a location’s average wind-driven rain load. For example, when considering wall design, if 1% of the wind-driven rain load is water intrusion, the corresponding critical average wind-driven rain load, derived from the relationship, is 472 L/m2-year. In locations where the average wind-driven rain is less than the critical value, the stucco-clad wall might satisfy the design criteria. Based on this design criteria, stucco-clad walls built in Fredericton, Ste. Agathe, Toronto and Simco would likely function adequately, whereas the wall with the current configuration might not be suitable in Chatham and Shearwater.
Figure 11. Relationship between wind-driven rain and percentage of WDR causing failure.
6. CONCLUSIONS
In this work, the hygrothermal performance of a 2 by 6 in. (38 by 140-mm) stucco-clad wall system was assessed using a hygrothermal simulation model to determine the response of the wall to various climatic conditions. Its performance is measured based on its drying potential to the applied internal and external boundary conditions, and its ability to manage drying with an additional internal moisture source. The moisture redistribution from the area of interest, where the intruded wind-driven rain was deposited, can well be represented with a one-dimensional model since the moisture diffusion in the lateral direction is not found to be significant because of the low vapor and liquid permeability of the sheathing board (OSB).
After iterative simulations it was found out that Shearwater and Simcoe were the most and least critical locations, respectively, among the six geographic locations considered. The stucco wall in Shearwater failed at 0.5% followed by Chatham at 1%, Fredericton at 2%, Ste. Agathe and Toronto at 3% and finally Simcoe at 4% of wind-driven rain intrusion. From the simulation results, it was observed that neither the total amount nor a single big event of wind-driven rain intrusion exclusively determined the performance of the stucco wall. It rather depends on the total balance of wetting and drying potential afforded by the climate. It was also suggested that the wind-driven rain load might give a better indication of the severity of the climatic condition than moisture index for the wall type considered in this study.
A relationship derived from the results of the simulations that relates wind-driven rain load and the failure indicator may provide a means to determine, for a given location (i.e. known wind-driven rain load derived from weather data) and specific wall assembly (in this case stucco-clad wall assembly) the critical amount of water that can bring about failure as a percentage of wind-driven rain load (or percentage of defect area). In locations where the wind-drive rain load is higher, extra care should be taken to reduce the defect area, which might allow a greater amount of water intrusion from wind-driven rain.
7. REFERENCE
ASHRAE. 2005. 2005. ASHRAE Handbook—Fundamentals, Chapter 5-Mass Transfer. Atlanta: American Society of Heating, Refrigerating and Air-Conditioning Engineers, Inc.
ASHRAE. 2003. 2003. ASHRAE Handbook—Applications, Chapter 3 - Commercial and Public Buildings. Atlanta: American Society of Heating, Refrigerating and Air-Conditioning Engineers, Inc.
Baker, M.C. 1969. Decay of wood, Canadian Building Digest, 111, pp. 4 (CBD-111).
Black, C. and Straube, J. 2007. Mould Growth Experiments of Full Scale Wood Frame Wall Assemblies. 11th Building science and technology conference, Banff, Calgary.
Carll, C. G. and Highley, T. L. 1999. Decay of wood and wood-based products above ground in buildings.
Journal of Testing and Evaluation 27(2):150-158.
Cornick, S.M.; Chown, G.A.; Dalgliesh, W.A.; Djebbar, R.; Lacasse, M.A.; Nofal, M.; Said, M.N.; Swinton, M.C. and Tariku, F. 2001. Defining climate regions as a basis for specifying requirements for precipitation protection for walls, Ottawa : Canadian Commission on Building and Fire Codes,
National Research Council of Canada, pp. 36 (NRCC-45001).
Cornick, S.M.; Dalgliesh, W.A.; Said, M.N.; Djebbar, R.; Tariku, F. and Kumaran, M.K. 2002. Report from Task 4 of MEWS Project - Task 4-Environmental Conditions Final Report, Research Report,
Institute for Research in Construction, National Research Council Canada, 113, pp. 110.
Cornick, S.M. and Dalgliesh, W.A. 2003. A Moisture index to characterize climates for building envelope design. Journal of Thermal Envelope & Building Science 27(2): 151-178.
Cornick, S.M.; Djebbar, R. and Dalgliesh, W.A.. 2003. Selecting moisture reference years using a moisture index approach. Building and Environment, 38(12):1367-1379.
Djebbar, R.; Kumaran, M.K.; Van Reenen, D. and Tariku, F. 2002. Use of hygrothermal numerical modeling to identify optimal retrofit options for high-rise buildings. 12th International Heat Transfer
Conference, Grenoble, France, pp. 165-170.
Hens, H. 1996. Heat, Air and Moisture Transport, Final Report, Vol. 1,Task 1: Modeling. International Energy Agency Annex 24, Laboratorium Bouwfysica, K. U.-Leuven, Belgium
Karagiozis, A.N. 1993. Overview of the 2-D hygrothermal heat-moisture transport model LATENITE.
Internal IRC/BPL Report, IRC/NRC, National Research Council of Canada
Karagiozis, A.N. 1997. Analysis of the hygrothermal behavior of residential high-rise building components.
Karagiozis, A.N.; Salonvaara, M.; Kumaran, M.K. 1996. Numerical simulation of experimental freeze conditions in glass-fiber insulation. Building Physics in the Nordic Countries, Espoo, Finland, pp.
455-465.
Kumaran, M.K.& Wang, J. 2002. How well should one know the hygrothermal properties of building materials ? , A Thermal and Moisture Transport Property Database for Common Building and
Insulating Materials, Appendix I, ASHRAE Research Project 1018-RP Final Report.
Kumaran, K.; Lackey, J.; Normandin, N.; van Reenen, D.; Tariku, F. 2002a. Summary Report from Task 3 of MEWS Project at the Institute for Research in Construction - Hygrothermal Properties of Several Building Materials. Research Repor-IRC-RR-110, Institute for Research in Construction, National
Research Council Canada, pp. 73.
Kumaran, K.; Lackey, J.; Normandin, N.; Tariku, F.; van Reenen, D. 2002b. A Thermal and Moisture Transport Property Database for Common Building and Insulating Materials, Final Report—ASHRAE
Research Project 1018-RP, pp.229
http://resourcecenter.ashrae.org/store/ashrae/newstore.cgi?itemid=8222&view=item&categoryid=177& categoryparent=177&page=1&loginid=4469
Lacasse, M.A.; O'Connor, T.; Nunes, S.C.; Beaulieu, P. (2003), Report from Task 6 of MEWS Project : Experimental Assessment of Water Penetration and Entry into Wood-Frame Wall Specimens - Final Report, Research Report, Institute for Research in Construction, National Research Council Canada, 133 p., February 01, 2003 (RR-133)
Maref, W.; Lacasse, M.A.; Kumaran, M.K. and Swinton, M.C. 2002. Benchmarking of the advanced hygrothermal model-hygIRC with mid-scale experiments. eSim 2002 Proceedings, Montreal, Canada
pp. 171-176, September 11-13.
Mukhopadhyaya, P.; Kumaran, K.; Tariku, F. and var Reenen, D. 2006. Application of hygrothermal modeling tool to assess moisture response of exterior walls. Journal of Architectural Engineering, 12(4):178-186.
National Building Code of Canada 2005. National Research Council Canada, Ottawa, 2005.
Nofal, M. and Morris, P.I. 2003. Criteria for unacceptable damage on wood systems. Japan-Canada
Conference on Building Envelope, Vancouver, Canada, pp. 1-14, June 01.
Salonvaara, M.H. and Karagiozis, A.N. 1994. Moisture transport in building envelopes using an approximate factorization solution method. Second Annual Conference of the CFD Society of Canada.
Toronto, Canada, pp. 317-326.
Sedlbauer, K. 2002. Prediction of Mould Growth by Hygrothermal Calculation. Journal of THERMAL ENV. & BLDG. SCI. 25(4): 321-336.
Straube, J.F. and Burnett, E.F.P. 2000. Simplified Prediction of Driving Rain Deposition. Proc of
International Building Physics Conference, Eindhoven, September 18-21, pp. 375-382.
Tariku, F. and Kumaran, K. 2002. Experimental and analytical investigations on the drying process undergone by aerated concrete, A Thermal and Moisture Transport Property Database for Common
Building and Insulating Materials, Appendix II, ASHRAE Research Project 1018-RP Final Report.
Tariku, F. and Kumaran, K. 2006. Hygrothermal modeling of aerated concrete wall and comparison with field experiment. 3rd International Building Physics Conference, Montreal, Canada, pp. 321-328,
August 27-31.
Teasdale-St-Hilaire, A. Derome, D. and Fazio, P. 2003. Development of an experimental methodology for the simulation of wetting due to rain infiltration for building envelope testing. Proc of the second
International Building Physics Conference: Research in Building Physics, Leuven, Belgium, September 14-18, pp. 455-462.