READ THESE TERMS AND CONDITIONS CAREFULLY BEFORE USING THIS WEBSITE.
https://nrc-publications.canada.ca/eng/copyright
Vous avez des questions? Nous pouvons vous aider. Pour communiquer directement avec un auteur, consultez la
première page de la revue dans laquelle son article a été publié afin de trouver ses coordonnées. Si vous n’arrivez pas à les repérer, communiquez avec nous à [email protected].
Questions? Contact the NRC Publications Archive team at
[email protected]. If you wish to email the authors directly, please see the first page of the publication for their contact information.
NRC Publications Archive
Archives des publications du CNRC
This publication could be one of several versions: author’s original, accepted manuscript or the publisher’s version. / La version de cette publication peut être l’une des suivantes : la version prépublication de l’auteur, la version acceptée du manuscrit ou la version de l’éditeur.
Access and use of this website and the material on it are subject to the Terms and Conditions set forth at Cost-Effective Open Plan Environments : The State of the Science
https://publications-cnrc.canada.ca/fra/droits
L’accès à ce site Web et l’utilisation de son contenu sont assujettis aux conditions présentées dans le site LISEZ CES CONDITIONS ATTENTIVEMENT AVANT D’UTILISER CE SITE WEB.
NRC Publications Record / Notice d'Archives des publications de CNRC:
https://nrc-publications.canada.ca/eng/view/object/?id=8c26fe21-862f-4e03-b6fe-5788e8ec02b2 https://publications-cnrc.canada.ca/fra/voir/objet/?id=8c26fe21-862f-4e03-b6fe-5788e8ec02b2
C , O S T - E F F E C T I V E
O P E N
P L A N
E N V I R O N M E N T S
T H E S T A T E O F T H E S C I E N C E
NOV 24 j997t
S e m i n a r
O t t a w a , O c t o b e r 1 7 t h , 1 9 9 7
Are office space savings
TABLE OF CONTENTS
Cost-effective Open-Plan Environments
...
1 Dr. Guy R. NewshamOpen Office Acoustics and Workplace Design
...
7 Dr. John S. BradleyThe Effect of Office Landscape on Ventilation
...
13 and Indoor Air Quality in Open-Plan OfficesDr. C. Y. Shaw
...
Cost-effective Lit Environments 19
Dr. Jennifer A. Veitch
Fire Safety in Office Buildings: The Impact of Office Landscape
...
25 Dr. Guyl2ne ProulxSatisfaction and Performance in Office Environments
...
3 1Cost-effective Open-Plan Environments (COPE)
Developing a design tool for cost-effective office design Dr. Guy Newsham
The Changing Office Landscape
Dramatic changes in office design and furnishings are occurring all over North America. These changes have captured the attention of the mainstream media, and many
organisations are considering following the trend. Whether labelled "space
optimisation", "hotelling", or "hot desking", the changes have a basic theme in common: reduced personal workspace for individuals. The reasons for this trend are compelling:
A desire to reduce occupied floor space and its associated costs; and,
A belief that a physical change can effect an organisational change that will increase productivity.
Professionals in all aspects of the building industry recognise the dangers in this process: remodelling the office landscape also has the potential to degrade the office environment. ~ n e c d o i e s tell of workers who feel crowded and lack orivacv. Reduced indoor air quality, unacceptable thermal conditions, poor lighting quality and elevated noise levels are all reported.. such conditions lead to occupants who
complain, get sick and are in fact productive, having a detrimental effect on an organisation's bottom line that far outweighs any cost benefits achieved by the office remodelling.
DILBERT reprinted by Permission of United Feature Syndicate. Inc.
DILBERT by Scott Adams, O 1995 United Features Syndicate
Increasing Occupant Density: The effect on Indoor Environment and Worker Satisfaction
When occupant density is increased, it is likely that some, if not all, aspects of the physical environment will deteriorate, see Table 1. As a consequence of the degradation of the indoor environment, and the well-known psychological effects of crowding and loss of privacy, occupant satisfaction will suffer. It is commonly accepted that
University of Illinois study found that workplace charactehstics accounted for 34 % of the variance in discretionary withdrawal ("on-site absenteeism"), 31 % of the variance in work satisfaction, and 24 % of the variance in turnover [Oldham & Fried, 19871. The US Environmental Protection Agency estimates that 60 million working days are lost in the US each year due to problems with the quality of the indoor environment [Paul, 19961.
Table I . Impact of increasing occupant density on the office environment.
Environment Aspect Consequences
IAQ & Ventilation More pollutant sources, more barriers to air flow ~ h e i m a l Comfort ~ncreaied internal gains, more barriers to air flow Lighting Quality Increased shadowing, reduced daylight
Acoustics More noise sources, closer proximity to noise sources Fire Risk More combustibles, increased evacuation time
Further, researchers in the health sciences, extrapolating from work done in different building types, have good reason to believe that increasing occupant density will lead to increased incidence of respiratory disease [Fisk & Rosenfeld, 1997; Nardell, 19971. Influenza and more serious diseases such as TB are transmitted via the airborne transport of particles. The common cold, perhaps the most important respiratory disease in terms of lost productivity, is transmitted primarily through physical contact, but airborne transmission has also been implicated. Clearly, having more people in the same space reduces the length of the transmission pathways, leading to a greater chance of catching the disease.
Since salaries and employee training comprise around 90 % of business operating costs, the financial consequences of a dissatisfied workforce will far outweigh any savings associated with reduced office space. Saving money on office accommodation to the detriment occupant satisfaction risks being "penny wise andpound foolish".
Therefore, the building ownerloperator cognisant of true cost-effectiveness should take measures to improve the indoor environment and increase occupant satisfaction. There will, of course, be a cost involved in making these improvements. However, the good news is that according to a recent report from the Lawrence Berkeley National
Laboratory, investments in improving the indoor environment payoff 20 to 50 fold [Fisk & Rosenfeld, 19971.
Challenges
While few would argue with the qualitative argument developed above, there are a number of fundamental challenges in developing a quantitative design tool:
1. We don't have an extensive knowledge of how office larldscape affects the office indoor environment.
2. We don't have a comprehensive predictive 111odel of how the oflict- laricls~ape ~ n d
indoor environment affect occupant satisfaction.
The COPE project will address each of these challenges and will embody its findings in a decision-making tool proving for rational, cost-effective officing decisions.
Description of Project Work
The project will proceed through a series of logical steps as outlined below. Each step will be tackled using scholarly
literature reviews, field studies, laboratory evaluations, focussed subject studies, and computer modelling.
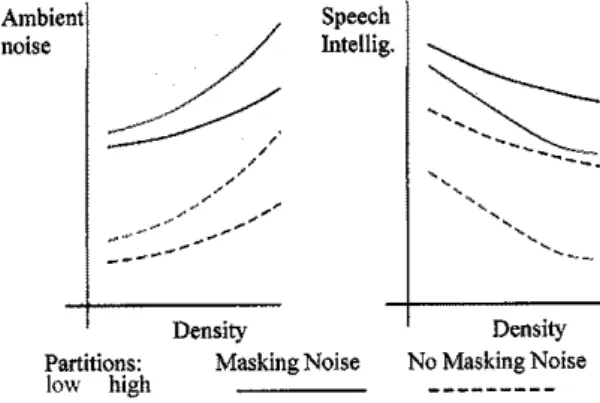
1. Derive quantitative scales for each indoor environment aspect, and a method of evaluating an indoor environment against that scale. For example, criteria for acoustic quality might be ambient noise level and speech intelligibility.
2. Quantify the indoor environment consequences of changing occupant density and other office landscape features (e.g., Figure 1). This process will help identify which aspects of the indoor environment are most affected by changes in office landscape, and would thus deserve more attention in
Intellig.
,' ,,'
'. .
---
--_
Density Density
Partitions: Masking Noise No Masking Noise low high
- - - -
- - -Figure I . Ambient noise andspeech intelligibility vs. occupant density, partition height and use of
masking noise (hypothetical).
Worker (with Worker Satisfac.
---
-.
pnvacy) Density DensityMasking Noise No Masking Noise
- -
- - -
- - - -later project stages. Figure 2. Satisfaction with acoustics andprivacy
3 . Evaluate the effect of increasing vs. occupant density and use of masking noise
density on occupant satisfaction. (hypothetical).
Both the effects of the indoor environment and psychological factors such as privacy and crowding will be considered (e.g., Figure 2). Other outcomes of relevance to the COPE evaluation model, e.g., self-
reported productivity and health Energy
effects, will be noted, where available. 4. Evaluate remedial technologies to
Density Density
address the identified negative indoor Figure 3, Various costs with the
environment with the imtallation of a successful masking noise system
goal of increasing occupant vs. density andpartition height (hypothetical).
satisfaction. Technologies will be
compared on their ability to improve the indoor environment and occupant
satisfaction, atid on their relative costs (c.~., Figures 1,2
,
and 3). Relevant physisnl interactions will be considered. For example, increasing the outside airflow ratemight improve IAQ and thermal comfort but result in higher energy costs and more noise. Would a better difiser layout allow for lower flow rates with lower noise and decreased energy requirement? How about individual desk fans?
Deliverables
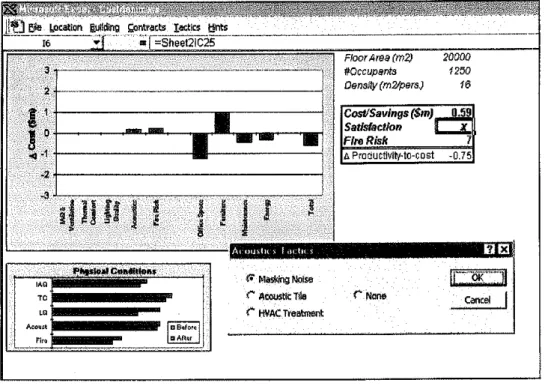
-
The COPE Evaluation ToolThe principal project deliverable will be the COPE evaluation tool, a tool allowing building owners and operators to make informed choices concerning cost-effective open- plan office strategies. Inputs to the model will be various building characteristics, geographical location, local costs, personnel costs, etc. Figure 4 illustrates how the main screen of such a tool might look (all data are hypothetical and for discussion purposes only). At the top left is a bar chart comparing all relevant costs including space rental, furniture, energy, maintenance, and the cost of remedial measures for improving the indoor environment; the panel at the bottom right indicates that masking noise generators are being considered as a method of improving the acoustic environment. At the bottom left is a bar chart predicting the indoor environment and fire risk conditions before and after offlce redesign (in the example, occupant density has been increased from 19 m21person to 16 m21person). At the top right is a panel showing overall predicted savings, and occupant satisfaction - the decision-maker can compare these numbers,
together with supporting references on self-reported productivity, health effects, and other information, and decided if the proposed office redesign is truly cost-effective.
I I
Figure 4. Hypothetical main screen for the COPE design tool.
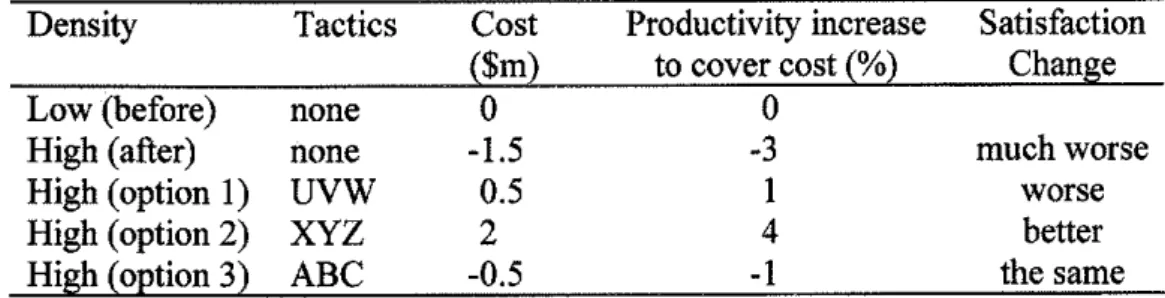
For discussion purposes, Table 2 summarises hypothetical examples of the costs and benefits of several officing strategies, as they might be output from the evaluation model.
Table 2. Hypothetical outputfiorn the COPE evaluation model.
Density Tactics Cost Productivity increase Satisfaction ($m) to cover cost (%) Change
Low (before) none 0 0
High (after) none -1.5 -3 much worse
High (option 1) UVW 0.5 1 worse
High (option 2) XYZ 2 4 better
High (option 3) ABC -0.5
-
1 the sameOn line 2 of Table 2, we see that increasing the density with no remedial attention to the indoor environment will save $1.5 million overall. For the particular personnel costs, productivity could go down by 3 % and there would still be an overall saving. The user must make the final costbenefit decision based on the prediction that satisfaction will be "much worse" than it was before the change in density. In option 1, the indoor
environment is improved using technologies UVW. There would now be an overall cost of $0.5 million (technologies cost money), requiring a productivity increase of 1 % to recover these costs. But how likely is this if the satisfaction is still "worse"? In option 2, the indoor environment is improved using technologies XYZ. There would now be an overall cost of $2 million, requiring a productivity increase of 4 %to recover these costs, but satisfaction is now "better" than it was before the increase in density. Option 3 looks like a good solution. It achieves a space reduction, saves money overall, and is predicted to have an occupant satisfaction rating no worse than the initial low density case.
Conclusion -The Built Environment Jigsaw Puzzle
The problem of defiing the effect of the built environment on organisational
productivity is akin to the challenge of completing a large and complex jigsaw puzzle, in which only a few of the pieces are already in place. To make matters worse, the built environment jigsaw has a number of unique complications. The pieces are not found exclusively in one box but in many, boxes labelled: engineering,
psychology, architecture, and health. Within each of these boxes we find that the pieces are jumbled, some of the pieces are in the wrong box, some of them are just plain wrong, some are duplicated, and some are missing entirely. Previous puzzle-solvers have tended to be narrow in their approach, and have looked only in one of the boxes to try and solve the puzzle. The
COPE project, wit11 its truly n~ultidisciplinary approach, will open up all Llie boxes. COPE will sift through the pieces to find the good pieces and put them in order -the literature and meta-analyses
tasks
of the project. Further, COPE will manufacture some or the missing pieces and place them in the p u ~ d e - the original research in thelaboratory and field work tasks of the project.
Will COPE solve the entire puzzle? No. But we expect COPE, by focussing on the worker satisfaction aspect of organisational productivity, to do the equivalent of completing a large fraction of the puzzle's perimeter. As anyone who enjoys solving jigsaw puzzles knows, getting the perimeter in place is a crucial step towards solving the
whole puzzle. Is such a step worthwhile? The entire puzzle -elucidating the impact of the built environment on organisation productivity - is worth around $500 billion to the North American economy, in the value of products sold to improve productivity, and in the productivity payoff to the organisations who invest in an improved built environment. Viewed in such terms, we think the COPE project is well worth the investment.
References
Fisk, W. & Rosenfeld, A. 1997. Improved productivity and health from better indoor environments. Center for Building Science News, Summer, p. 5. Lawrence Berkeley National Laboratory.
Nardell, E. A. 1997. Environmental control of drug resistant tuberculosis in industrial and developing countries. Proceedings of Healthy BuildingsnAQ 97,1, pp. 301
-
314, Washington DC, USA.Oldham, G. R. & Fried, Y. 1987. Employee reactions to workspace characteristics. Journal of Applied Psychology 72 (I), pp. 75
-
80.Paul, R. 1996. Building healthy and productive offices. htt~>://www.huworth- ,furn.codbuildir~a.htm. Haworth Inc.
Open Office Acoustics and Workplace Design Dr. John S. Bradley
[email protected] Overview
Noise ~roblems are one of the leadine sources of dissatisfaction exoressed in ~ o s t -
-
occupancy evaluations. Unwanted noise is annoying and distracting, and can lead to a reduction in overall job satisfaction and task productivity, and further reinforces the private office as a corporate status symbol. The acoustical design of open office space to achieve a productive work environment is a delicate balance between blocking, absorbing and masking unwanted speech sounds and controlling excessive ambient noise. While open office space is the focus of this review, there are other related types of spaces that make up the office environment and that each have their own special acoustical needs. Meeting rooms must have very low ambient noise levels and optimum room acoustics to maximize the efficiency of communication. For closed offices it is necessary to pay attention to the construction details of partitions so that an adequate level of acoustical privacy is obtained.Ambient Noise )
Ambient noise is a critical concern.in all types of office spaces. Maximum acceptable levels of ambient noise depend on the intended use of the space. It is very important that ambient noise levels in meeting rooms are very low to avoid interfering with the speech sounds that listeners want to hear. However, in open plan offices, a modest level of
neutral ambient noise can be helpful because it tends to mask unwanted speech sounds from neighbouring workstations.
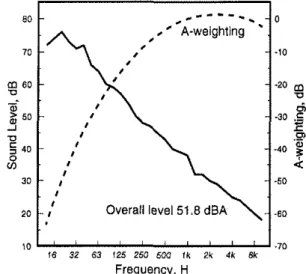
70 -10 Because of the meaning associated with
speech sounds, even quite low levels of
m 60 -20
v speech can be quite distracting.
There are several procedures for rating
v
5 40 ambient noises. The simplest approach is
4 the 'A' frequency weighting that weights
I
30 -so the lower frequencies as less important,
Overall level 51.8 dBA similar to our own hearing. The noise
soectrum shown in Figure 1 has an overall
10 L-weighted sound level of 5 1.8 dBA.
16 32 61 125 250 500 I k 2k d h Bk
Frequency. H Several more sophisticated indoor noise-
rating procedures are based on the sound
Figure I . Noise spectrum and A-weighting levels in a number of different frequency
Contour. bands. Figure 2 shows the octave band
sound levels of the same noise as in Figure 1 and the RC noise rating contours
[ASHRAE, 19931. Using this procedure leads to an RC rating of 40R which indicates that the speech frequency bands average about 40 dB and that there is an excess of
'Rumbly' low frequency sound compared to a more neutral spectrum. That is, the rating is not a single number but combines
Overall level: 51.8 dBA
a number with a letter describing the expected spectral quality of the sound. Both the RC and NCB [Beranek, 19891 systems are relatively new and extend to quite low frequencies. However, the older NC [Beranek, 19711 and NR [Bums, 19681 systems are perhaps still the most widely used. Even more complex systems have been used to more accurately rate the 16 32 83 125 250 5M) l k 2k 4k 8k perceived loudness and noisiness of
Frequency, Hz sounds. None of the procedures commonly
~i~~~~ 2, octave hand noise spectrum and RC used to rate ambient noise in rooms is the
rating contours. result of a systematic research study that
included controlled subjective tests. Therefore, it is not at all clear which is the best predictor of the annoyance or
acceptability of noises or even the expected interference with speech communication. This lack of clarity has held back the process of developing acoustical designs to optimize worker satisfaction and performance.
Speech Privacy in Open Offices
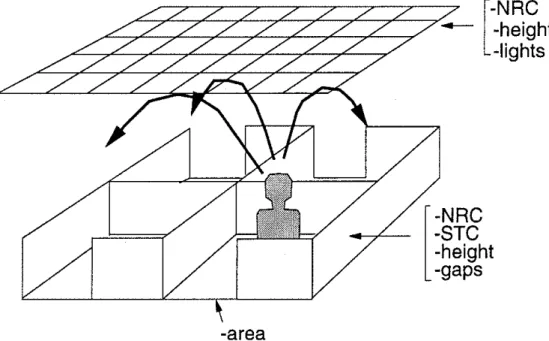
In open plan offices, speech sounds from adjacent workstations can be annoying and can distract people from their work activities. To achieve acceptable speech privacy, an open plan office must be designed to block and absorb as much unwanted speech sound as possible. Any significant compromise to these design requirements will make it impossible to obtain an acceptable open office environment. Figure 3 symbolically illustrates the problems.
Screens and cellular office furniture must block the direct propagation of speech sounds between workstations. This is normally assessed from measurements of the sound transmission loss of these elements [ASTM, 1990a1, and is usually reduced to the Sound Transmission Class (STC) [ASTM, 19871 single number rating. An STC of 15 or more is usually recommended for office screens.
Screens must also be high enough to minimize the diffracted sound energy that bends around the screens. Thus higher screens are more effective barriers to the speech sounds. It is also important that screens and furniturc systcms form complete barriers and do not have gaps either between panels or between panels and the floor.
The other dominant sound path is due to reflections from the ceiling. It is therefore very important that the ceiling he highly sound absorbing. Sound absorption tests [ASTM,
1990bl of ceiling tiles are typically reduced to the single number Noise Reduction Coefficient (NRC) rating, which can have values of 0.9 or more for highly absorptive ceilings.
-area
Figure 3. Open ofice component parameters influencing speech privacy.
Finally, it is important that all other large surfaces are sound absorbing to minimize reflected sound. Floors must be carpeted, screens and furniture systems should have absorbing surfaces, and other large surfaces such as walls should also be treated. Highly absorbing office screens typically have NRC values of 0.8 or better.
Even when everything possible is done to block and absorb unwanted speech sounds, acceptable speech privacy may not be obtained. It is often necessary to add moderate levels of neutral masking noise from loudspeakers in the ceiling void. Although this increases the total level of the noise, it is less distracting because of its neutral spectrum and because it masks or covers up the more distracting speech sounds. If the level of the masking noise is increased above about 48 dBA however, it is not helpful because people tend to raise their voices creating more noise and annoyance.
Unresolved Issues and the Impact of Current Officing Trends
We have a reasonably good understanding of the effects of each component of an open office on the resulting speech privacy. However, there is not complete agreement on ootimum values of the design Darameters of each comoonent of the office and we have no " L
integrated design procedure for evaluating the expected speech privacy of a complete office design. It is thus difficult to quantitatively evaluate new designs. Similarly, in a - renovation situation we cannot easily determine which component most critically limits the overall speech privacy, and hence we cannot prescribe the most cost-effective improvement. For example, in some cases the ceiling tiles may be the weak link, while in others higher screens might be the most effective improvement.
Several new developments will make it more difficult to obtain acceptable acoustical conditions in open offices. Proposals for smaller workstation footprints will bring workers closer together and make achieving acceptable speech privacy an even greater
j
challenge. New philosophies for stronger team interaction recommend lower barriers and new more open furniture designs. These can only lead to reduced speech privacy and
i
j
more distractions from individual tasks. Voice activated computers already exist and users now talk to their computers rather than type relatively noiselessly. This creates more potentially disturbing speech sounds. On the other hand, developing active noiseI
i control technology may make it possible to create localized areas of quiet for workers in
open plan offices.
There are several other issues related to ambient noise. There is only rough agreement on acceptable noise level criteria for either natural sound sources or added electronic
masking noise. The lack of agreement on the best rating procedure for indoor ambient noises makes it difficult to be precise about acceptable criteria and impossible to accurately rate unwanted noises.
Recent IRC Acoustics Research
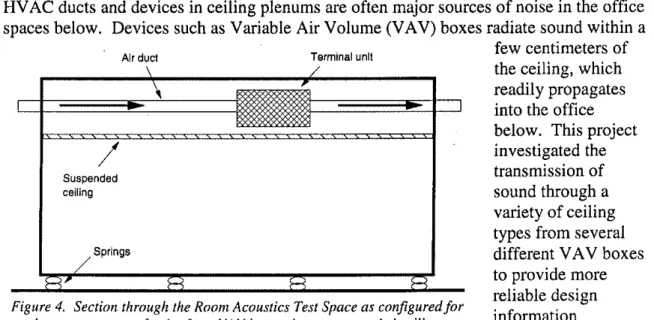
Transmission of HVAC noise through office ceilings
HVAC ducts and devices in ceiling plenums are often major sources of noise in the office spaces below. Devices such as Variable Air Volume (VAV) boxes radiate sound within a
Air ducl ... Terminal unlt few centimeters of
the ceiling, which readily propagates into the office below. This project investigated the / Suspended ceiling Springs transmission of sound through a variety of ceiling types from several different VAV boxes
I
,/I
F-i H H to provide more
reliable design
Figure 4. Section through the Room Acoustics Test Space as configured for
the measurement ofnorse from VAV boxes above a susoended ceiline. information
[Warnock, 19971.
Measurements were made in IRCs Room Acoustics Tests Space shown in Figure 3. This is an acoustically and vibrationaly isolated test space that is easily re-configured to suit a wide range of different tests.
Annoyance of sounds with varying rumble
Noises with significant amounts of low frequency sound are said to be 'rumbly' in quality nod sutll p i i ~ r ~ ~ i ~ l c n t low ficquct~cy ti~llttllt tail
make
those soullds
more annoying.HVAC system noises frequently have a 'rumbly' character and this low frequency sound often fluctuates with time creating a very disturbing time varying noise. Unfortunately there are no standard noise measures to rate the added disturbance caused by such level fluctuations. This project examined the added annoyance by systematically varying the
i
low frequency content, as well as the amplitude and frequency of level fluctuations. All of these factors influenced the relative annoyance and the results were used to devise
I
suggestions for including these factors in noise rating procedures [Bradley, 19941.Sound propagation into an open office from an atrium
IRCs Atrium project has looked at all aspects of the indoor environment in several atrium spaces. Acoustical measurements, as part of this project, included an investigation of sound propagation from a
large atrium into adjacent
open office space. These receivers
measurements were made possible by using IRCs sophisticated Room
Acoustics Measurement ...
software [Bradley, 1996al. ... The section through the
atrium shown in Figure 4. illustrates the extent of the measurement positions that were used. In spite of the lack of full height barriers between the open office
and the atrium, noises from Figure 5. Section through atrium and adjacent open o f i c e
the atrium were areas showing test sound source and measurement locations. significantly reduced in
level in the open office area. Simple calculation techniques were found to accurately predict the measured attenuations [Bradley, 1996bl.
Conclusions
The identified important acoustical issues, related to achieving productive office environments, include:
Verifying ambient noise criteria for various types of spaces. Determining the preferred rating system for indoor ambient noises. Establishing the required properties of open office components. Developing an integrated open office design procedure.
References
ASHRAE. 1993. Handbook of Fundamentals, pp. 7 - 9. American Society of Heating Refrigerating and Air Conditioning Engineers, Atlanta, Georgia..
ASTM. 1987. Classification for rating sound insulation, E413-87. American Society for Testing and Materials, Philadelphia.
ASTM. 1990a. Standard test for laboratory measurement of airborne sound transmission loss of building partitions, E90-90. American Society for Testing and Materials,
Philadelphia.
ASTM. 1990b. Standard test for sound absorption and sound absorption coefficients by the reverberation room method, C423-90a. American Society for Testing and Materials, Philadelphia.
Beranek, L.L. 1971. Noise and Vibration Control, p. 565. McGraw Hill, New York. Beranek, L.L. 1989. Balanced noise criterion (NCB) curves. J. Acoust. Soc. Am., 86 (2), pp. 650 - 664.
Bradley, J.S. 1994. Annoyance caused by constant-amplitude and amplitude modulated sounds containing rumble. Noise Control Engr. J., 42 (6), pp. 203 - 208.
Bradley, J.S. 1996a. Optimizing the decay range in room acoustics measurements using maximum length sequence techniques. J. Aud. Eng. Soc., 44 (4), pp. 266 - 273.
Bradley, J.S. & Atif, M. 1996b. Monitoring Results of an Enclosed Atrium Space, Part
111: Acoustic Performance. IRC Contract Report A3538.B.A~. Burns, W. 1968. Noise and Man, p. 115. John Murray, London.
Warnock, A.C.C. 1997. Sound Transmission through Ceilings from Air Terminal Devices in the Plenum. ASHRAE contract report RP755.
The Effect of Office Landscape on Ventilation and Indoor Air Quality in Open-Plan Offices
A Review of Relevant IRC Work
Dr. C.Y. Shaw [email protected]
Introduction
Adequate ventilation, satisfactory thermal comfort conditions, and acceptable indoor air quality together with proper lighting and acoustic conditions are essential for providing a safe, productive and satisfactory indoor environment for the occupants. As seven out of every ten employees work in office buildings, providing an acceptable indoor
environment in such buildings is particularly important for employers in both the public and private sectors.
In office buildings, the HVAC system is responsible for providing ventilation and thermal comfort. The performance of the system depends mainly on its capacity to provide an adequate ventilation rate, and its ability to deliver the ventilation air to occupied areas and to remove the contaminants generated by occupant activities, furnishings and building materials. As guidelines for designing and constructing HVAC systems for office buildings are well established, the systems in most office buildings are properly designed and installed. However, problems can arise in some buildings when the conditions are changed significantly from the original design conditions. One example is to increase the number of office workers in an open plan office by reducing the floor area of each
workstation and rearranging partitions. As many organizations are considering such a plan to reduce operating costs, there is a need to systematically examine the effects on the safety, satisfaction and productivity of the affected workers.
Possible Effects of Office Landscaping
An increase in occupant density in a workplace increases the office furniture, equipment and occupant activities in the space. It will also lead to some rearrangement of office furniture. The expected immediate result will be an increase in the contaminant generation rate in the work space which will have an adverse effect on the indoor air quality level. To remove the contaminants, most building engineers will increase the ventilation rate. Such a measure may improve the indoor air quality but the resultant high air speeds may also produce cold draughts to adversely affect the thermal comfort
condition. In addition, a rearrangement of office furniture can affect the performance of the existing HVAC system by altering the distribution of the ventilation air. Discussions with building engineers indicate that little or no information is available to help them upgrade and assess the existing HVAC systems to accommodate changes in the number or layout of workstations.
Studies indicate that the ventilation rates of most buildings meet or exceed the ASHRAE recommendation of 10 U s per person. This was set in the absence of information about the emission rates of building materials and furnishings, and their effects on the overall contaminant concentration. To verify the validity of this recommendation it is necessary to know the emission characteristics of the workstation furnishings. It is also necessary to have a tool to predict the overall contaminant concentration in the workplace based on the emission rates of the office furniture. In addition, methods are required to verify the prediction by measuring the concentration in the workplace directly.
This paper reviews some of the IRC's recent work related to office buildings which are relevant to the points discussed above. It includes the following three topics:
1. The methods for assessing IAQ and thermal comfort in a workplace.
2. The effect of workstation layout on the ventilation conditions in the workplace.
3. The emission characteristics of workstation furnishings.
Methods for Assessing IAQ and ~ h e r m a l Comfort in Workplaces
IRC has developed a protocol for assessing the indoor air quality conditions in office buildings [Shaw et al., 1991a; Shaw et al. 1991bl. This protocol can be used to assess the effects of increasing occupant density or rearranging workstations on the indoor air quality and ventilation conditions in the workplace. The protocol includes the assessment of the performance of the HVAC systems and the measurement of the chemical
contaminants in the workplace.
HVAC Systems
The performance of the HVAC systems is assessed on the basis of air change rates, air distribution patterns, and thermal comfort conditions in the occupied areas. The recommended methods of measurement are discussed below.
Air Change Rates -- Air change rates are measured using the tracer gas decay method. This method involves the injection of a small amount of SF6 tracer gas into the supply air ducts of the building's HVAC systems and the measurement of the subsequent tracer gas concentrations at several locations in the workplace and in the main return duct. The air change rate is obtained by plotting the logarithm of the measured concentrations at each sampling location against time in hours. The data are then fitted with a straight line and the slope of the line is the air change rate expressed in air changes per hour (ach).
Air Distribution -- For assessing air distribution within a workplace, a small amount of SF6 is injected at a particular location to create a point source. Immediately following injection, tracer gas samples are taken (at 10-minute intervals) at the main return duct and at several locations in the workplace. The tracer gas concentrations of each sampling location are then plotted against time. The time in which the concentrations at all
sampling locations reach approximately a single level can be used to assess the performance of the air distribution systems.
Thermal Comfort -- Thermal comfort is evaluated by the method outlined in ASHRAE Standard 55-1992. The thermal comfort conditions at various locations in the workplace are evaluated by recording room temperature (dry-bulb), mean radiant temperature, air velocity, and relative humidity. Each parameter should be measured at three elevations above floor level: 7 cm (ankle level), 75 cm (seated waist level), and 185 cm. The
measurements should be repeated during office hours at two-hour intervals for a period of eight hours.
Chemical Contaminants and Particulate Matter
Carbon Dioxide -- C 0 2 concentrations are monitored continuously at several locations. Samples are pumped from the sampling locations to the COz analyzer.
Formaldeh~de -- Spot checks of formaldehyde concentrations at locations throughout the workplace are conducted using a portable analyzer with an electrochemical voltammetric sensor.
Volatile Organic Comoounds (VOC) -- For measuring the VOCs, air samples at the workplace are collected at various locations, using three-layer glass sorption tubes packed with silanized glass beads; Tenax and synthetic charcoal and analyzed later at the
laboratory. The analysis yields both the total VOC (TVOC) level in the sample, and identifies and quantifies individual components.
Suspended Particulates -- Suspended particle concentrations (number, total mass, respirable mass) are monitored using two aerodynamic particle sizers.
Effects of Air-diffuser Layout on the Ventilation Conditions of a Workstation For office buildings with an open-plan layout, some workstations may be overventilated and others may be inadequately ventilated, even though the total ventilation (outdoor air supply) rate may be adequate. This is because the designer seldom knows the
workstation layout when designing the ventilation system. Also, workstation layouts may be changed as the use of the space changes. To ensure that every workstation is
-
-
adequately ventilated, building managers and designers need some guidelines for planning workstation layouts. To develop such guidelines, it is necessary to know the ~ l l f l u e ~ ~ c e of various design parameters, sbch as the types and design layouts of supply air registrrb and return air grilles on the performance of a HVAC system in a workstation. Tests were conducted in one of two interconnected ventilation test rooms to measure air distribution patterns, air change efficiency (or air-exchange efficiency, as used by other researchers), and ventilation efficiency (or contaminant removal efficiency) within and around a mock-up workstation for different layouts of supply air registers. Severi
different layouts and two types of air diffusers were tested to compare their ability to distribute ventilation air to a workstation located inside an enclosed office [Shaw et al.,
1993a; Shaw el al., 1993bl.
The results indicate that all seven difiser layouts were found to distribute the supply air within the workstation and in the surrounding area equally well. In addition, tests
conducted on gap heights at the base of workstation partitions found they had little effect on air-distribution patterns in the workstation. Contaminant-removal effectiveness, however, was improved for layouts that directed the supply air toward the contaminant source.
The results of this study suggests that if a single ceiling air diffuser is used, it is not necessary to place it at the centre of the workstation to achieve maximum air distribution efficiency. The ceiling-mounted air diffuser can be located anywhere within the
workstation. This means that air-diffuser layout may be more flexible than originally believed. This in turn would allow for more choices in terms of open-plan workstation placement, enabling businesses to make better use of existing floor space. Further work is required to ensure that the result is applicable to open-plan office with multiple workstations and air diffusers; the effect of partition height also remains to be investigated.
Workstation Emissions
Provision of acceptable IAQ in an energy-efficient manner depends on two things: contaminant-source control and effective ventilation. Both require an understanding of the emission characteristics of building materials and furnishings. The emissions from building materials and furnishings can
affect the indoor air quality level in a workplace. Yet little is known about how material emissions contribute to indoor pollution.
Workstation emissions tests conducted in IRC's state-of-the-art facilities produced valuable information about which volatile organic compounds (VOC's) were emitted by a test workstation, their concentrations, and how ventilation strategies are likely to affect concentrations of individual VOC's and total volatile organic compounds (TVOC) over time.
Using the full-scale stainless steel test
chamber (Figure I), with its dedicated Figure 1. IRC's Material Emissions Chamber.
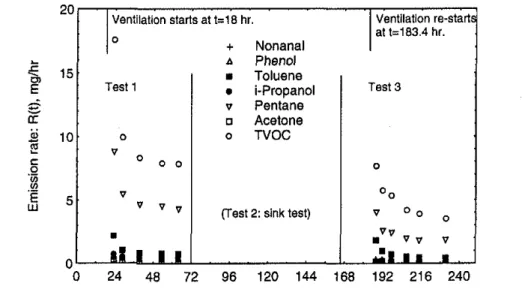
system simulating realistic room conditions [Shaw & Zhang, 19971, a series of tests was conducted to investigate the sources of emissions and the "sink" characteristics of an office workstation system. (Sink refers to the phenomenon of materials absorbing
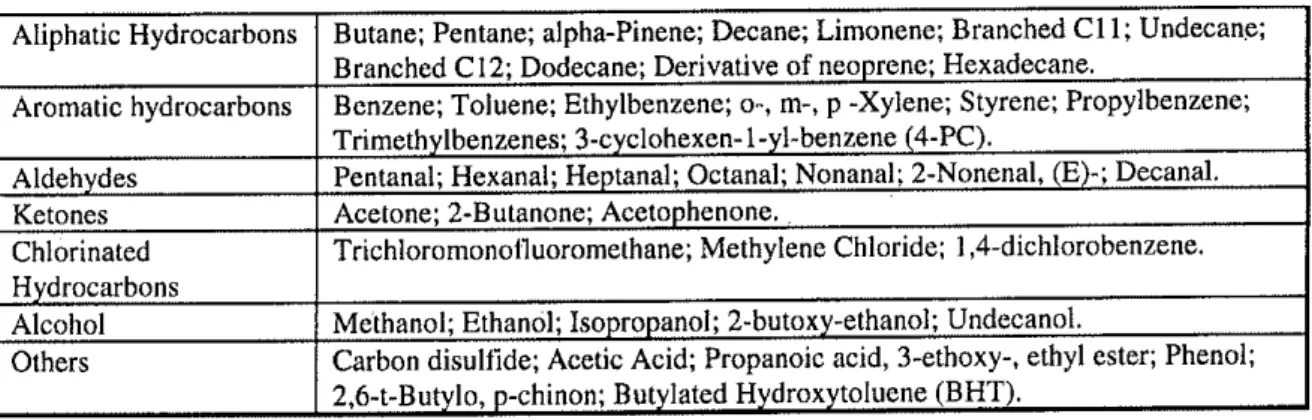
contaminants that have been emitted in a room or space and eventually re-emitting them.) To confirm the validity of the data gathered, tests were also conducted in a real building with the same type of workstation, which consisted of soft-wall partitions, desks, drawers, bookcases, an adjustable chair, a side chair and a piece of carpet [Zhang et al., 19971. Of the 45 compounds that the workstation was found to emit (Table I), the six most abundant were: Acetone, Pentane, i-Propanol, Toluene, Phenol and Nonanal. Two distinct emission periods were identified: an initial, short (10 hour) period following the start of ventilation during which emission rates were high but diminished quickly; and a subsequent quasi steady state period, during which the emission rates diminished very slowly or stayed almost constant (Figure 2).
Table I . VOCs emitted from the test office workstation
In addition, the chamber tests demonstrated that the workstation created a significant sink effect for several compounds often found in buildings.
Aliphatic Hydrocarbons Aromatic hydrocarbons
Follow-up testing in the real building showed that Nonanal, Toluene and Acetone remained detectable eight months after workstation installation, which corresponded to the chamber test results.
Butane; Pentane; alpha-Pinene; Decane; Lirnonene; Branched C11; Undecane; Branched C12; Dodecane; Derivative of neoprene; Hexadecane.
Benzene; Toluene; Ethylbenzene; o-, rn-, p -Xylene; Styrene; Propylbenzene; Trimethylbenzenes; 3-cyclohexen-1-yl-benzene (4-PC).
The emission data together with a computer model which is currently being developed at
R C
will allow designers to predict the overall contaminant concentration in theworkplace and to explore trade-off between increasing ventilation and using furnishings with low emission potentials for meeting pre-determined indoor air quality target.
1
Ketones Chlorinated Hydrocarbons Alcohol OthersAcetone; 2-Butanone; Acetophenone.
Trichlorornonoiluoromethane; Methylene Chloride; 1,4-dichlorobenzene. Methanol; Ethanol; Isopropanol; 2-butoxy-ethanol; Undecanol.
Carbon disulfide; Acetic Acid; Propanoic acid, 3-ethoxy-, ethyl ester; Phenol; 2,6-t-Butylo, p-chinon; Butylated Hydroxytoluene (BHT).
20
(Test 2: sink test) Ventilation starts at 6 1 8 hr. 0 + Nonanal 15 E 0
c?
5
10. F C 0 .- $2 Test 3 0 Ventilation re-start at t=183.4 hr.Time since the chamber was closed: t, hr
Figure 2. Measured emission rates of VOCs from an office workstation.
A Phenol References Test 1 o v O 0 0
Zhang, J. S., Kanabus-Kaminska, M., Shaw, C. Y., Lusztyk, E., Magee, R. J., Brouzes, M. A,, Nong, G. & Wang, J. Characterizing the emissions of volatile organic compounds from a workstation system. Proceedings of Healthy BuildingsLAQ 97.3, pp. 521 - 526, Washington DC, USA. m Toluene i-Propanol v Pentane o Acetone o N O C
Shaw, C. Y., Magee, R. J., Shirtliffe, C. J. & Unligil, H. 1991a. Indoor air quality
assessment in an office-library building: part I - test methods.
ASHRAE
Transactions, 97 (2), pp. 129 - 135.Shaw, C. Y., Magee, R. J., Shirtliffe, C. J. & Unligil, H. 1991b. Indoor air quality assessment in an office-library building: part 11 -test results.
ASHRAE
Transactions,97
(2), pp. 136 - 145.
Shaw, C. Y., Zhang, J. S., Said, M. N. A,, Vaculik, F. & Magee, R. J. 1993a. Effect of air diffuser layout on the ventilation conditions of a workstation: part I- air distribution patterns.
ASHRAE
Transactions, 99 (2), pp. 125-
132.Shaw, C. Y., Zhang, J. S., Said, M. N. A., Vaculik, F. & Magee, R. J. 1993a. Effect of air diffuser layout on thc ventilation conditions of a workstation: part
II
- air change efficiency and ventilation efficiency.ASIIRAE
Transactions, 99 (2),pp.
133 - 143. Shaw, C. Y. & Zhang, J. S. 1997. A full-scale chamber for material emission studies. 4th Canada-Japan Housing R&D Workbhop.Cost-Effective Lit Environments
Dr. Jennifer A. Veitch [email protected]
Lighting the Modern Office
Office conditions have changed a lot in the past thirty years. Figure 1 shows an office of the 1930's, where most of the work was on the desktop, using paper and pen. Fluorescent lighting, the mainstay of office lighting since the 1930s, mostly consisted of regular arrays of recessed lighting systems with the lamps covered by prismatic acrylic lenses. These direct lighting systems provided bright walls and very bright horizontal surfaces. Bright working surfaces were believed to be important to maintain task visibility. The concern with providing good visibility was
justified: It was not uncommon for people Figure 1 1930S. ofice space (Johnson Wax
to spend many hours a day reading third- building by Frank Lloyd Wright). generation carbon copies, or faint pencil on
paper.
Today, almost every office worker spends at least part of the day working on a computer. This change in
technology has profound implications for office lighting. Instead of a piece of PaDer on a horizontal surface. these
A
-
employees read from a self-luminous, I
vertical, glass screen. The lensed lighting systems that provided good horizontal illumination on desks
suddenly became sources of unwanted
-
screen reflections. Screen glare canreduce the visibility of the material on Figure 2 Computerized ofice, early 80's the screen, with consequences ranging
from the inconvenient to the disastrous, depending on the importancc of the task and the extent of the problem. For example, stock traders need to read, precisely and quickly, the stock prices on their monitors.
However, the paperless office is still a long way away! In addition to computer-based work, most people review documents on paper. Laser printers have reduced the difficulty of many visual tasks in offices, but poor-quality faxes can still be visually challenging.
Lighting systems for offices today must provide good glare control on vertical surfaces, and yet provide adequate light on desktops. In addition, good lighting will provide good facial modelling, which will permit clear recognition and interpretation of the nonverbal signals that are an important part of human communication.
Consensus-Based Lighting Recommendations
North American lighting recommendations for lighting specifiers and designers emerge from the Illuminating Engineering Society of North America. The current document relevant to office lighting is E S N A RP-1 [1993], American National Standard Practice for OfJice Lighting. Table 1 provides a summary of these recommendations. They are
intended to provide adequate light on the desk surface to read documents, while reducing the degree of screen glare on computers. Luminance ratio limits are intended to prevent excessive contrasts between light and dark.
Table I . Summary of lighting recommendations from IESNA, RP-1
Illuminance Max. ceiling task: task: wall Ceiling Other on desk luminance surround luminance maximin considerations (lux) (cdim2) luminance ratio luminance
ratio ratio
300-500 preferred: 3:l 1 0 : l o r pref.4:l V C P > 7 0 (200- 850 @ 55" 1:lO accept Reflectances &
300 angle . 40:l max 1O:l finishes
general; accept: outside Maintenance
300-450 850 @ 65O field of
These lighting recommendations are the result of a consensus process; they represent the coIIected wisdom of the members of the IESNA Office Lighting Committee. Their link to scientific research is weak [Boyce, 1987; Veitch & Newsham, in press-a].
Lighting Design Challenges from Office Redesign
Pressure to reduce the space allocation to each individual in an open-plan office can have implications for the selection and layout of lighting systems in the space. This is
especially true when much of the illumination is provided using ceiling-mounted lighting systems. For instance, after the office space is reconfigured, lighting systems that did not cause screen reflections in VDTs might be in the worst possible place for the new
workstations. This would reduce screen visibility and make it more difficult to work. Advance planning by a lighting designer can help to predict the places in which this problem might occur. One solution is to provide ambient lighting from movable fixtures attached to systems furniture, or freestanding, together with task lighting on work
surfaces (Figure 3).
Sufficient electrical supply in the right locations will permit computer equipment to be oriented to reduce screen reflections and to avoid bright glare sources straight in iront of the worker. Smaller workstations offer fewer alternatives in this regard. Screen
reflections make work more difficult; direct glare causes discomfort and is believed to be a cause of eyestrain and headache (Figure 4). If equipment cannot be placed in such a way as to eliminate screen reflections or direct glare, then other means of glare control should be considered: For example, a diffuser on top of a parabolic louver will reduce the brightness of bare fluorescent lamps visible through the louver. Filters mounted on the computer screen are another potential solution.
Figure 3. Partition-mountedfulrures in combination with task lighting.
The introduction of more partitions and tall storage units can leave some workstations in shadow. The desktop light levels on the shadow side may be lower than acceptable limits, although the levels on the bright side
might be suitable for reading the titles of books on shelves. Solutions to these problems need to balance the needs of occupants on both sides of the partition. Task lighting would be one way to deliver additional light onto shaded work surfaces, but can result in undesirably high contrast between the brightness of the task area and the surroundings.
Increasing occupant density will mean that
fewer people have direct access to windows. Figure 4. Example of VDT screen glare.
This would reduce the effectiveness of
daylighting within the space, particularly if high partitions are in use that block daylight penetration. Lower partitions (as deployed in some new officing strategies to facilitate communication between team
members) are one possible solution, although they will reduce privacy. Another possibility might be to use an exterior light shelf to reflect daylight farther into the space (Figure 5). Light shelves and light pipes allow daylight farther into buildings, but do not provide all the amenities of windows. People generally prefer to have window access because it provides a connection with outdoors,
with information about the time of Figure 5. A lightshelfis used to reflect daylight
The develovment and adovtion of enerev codes poses an additional challenge for office
-.
-
lighting design, by placing limits on the allowable energy load for lighting.ASHRAEiIESNA Standard 90.1, Energy efficient design of new buildings except new low-rise residential buildings [ A S H ~ E , 19891, and the Canadian Energy Codefir New Buildings [Canadian Codes Centre, 19951 both limit acceptable lighting power densities for offices to approximately 14 w/m2. These codes will apply if the building is new or if there has been a substantial change-of-use.
IRC Lighting Quality Research
The development of energy codes and standards in the late 1980s led to renewed fears in the lighting community that reduced energy for lighting would lead to poorer quality lighting. This was demonstrably the case during the 1970s energy crisis, in which
delamping was the predominant energy-saving strategy. Advances in lighting technology have given rise to new alternatives for energy savings, but in the absence of any
agreement about how to assess lighting quality there was little reason for confidence that these new technologies would prevent a repeat of earlier problems. The National
Research Council of Canada responded to this concern with the project "Experimental Investigations of Lighting Quality, Preferences, and Control Effects on Task Performance and Energy-Efficiency", which began in October 1994. The project is sponsored by Canadian Government organisations, Canadian electrical utilities, and a number of lighting equipment manufacturers. Its objectives are:
To characterise office lighting quality under different lighting designs, at lighting power densities (LPD) typical of existing conditions and of current and proposed energy codes and standards.
To relate the task performance of office workers to lighting quality.
To determine the effect of the individual control over office lighting on worker satisfaction and performance.
Results from one experiment, pertaining to the first two objectives are presently available mewsham & Veitch, 1997; Veitch & Newsham, in press-b], and an experiment
addressing the last is under way. The first experiment took place in the Indoor Environment Research Facility in Building M-24 on our Montreal Road Campus, which is configured as a windowless open- plan office space containing six workstations (Figure 6). Three Ottawa-area lighting designers created nine lighting designs for the space. Temporary office workers
(292 in total), recruited from a local
Each person worked for one day under one of the nine lighting conditions; thus, they were unaware that the experiment concerned lighting until the end of the day. Their tasks during the day, selected to provide measureable results of elements of office work,
included typing, proofreading, reading, writing, and questionnaire measurements of satisfaction with the lighting and other features.
The results can provide guidance to solutions of common office lighting problems. For example, the experiment confirmed that lighting systems designed for computer offices do indeed allow better performance of computer-based tasks. Lighting systems with parabolic louvers were rated as being less glaring than those with prismatic lenses, exactly as they are designed to do. Generally speaking, performance on computer-based tasks was better when the lighting system incorporated parabolic louvers than when prismatic lenses were used. In addition, the participants who worked under parabolic- iouvered lighting systems reported that theirpersonal productivity that day had been about 8% higher than the level reported by the people who worked under prismatic lensed lighting systems.
Lighting systems that incorporated a combination of task and ambient illumination were given higher satisfaction and lighting quality ratings than other systems. Because the tasklambient combination is frequently chosen as a strategy to achieve energy savings in addition to those achieved by lamp and ballast changes, this is good news. When
carefully designed, energy-efficient lighting can be high quality, too.
Implications for Cost-effectiveness
The recent NRC work on lighting quality is revolutionary in that it documents the behavioural effects of meaningful changes in lighting systems. The effects reported are small to medium in size, but they cover important behaviours for officer workers and their employers; compensation costs for occupants are considerably higher than the costs of new lighting systems. Further work in this area will provide data to permit
comparisons of a wider range of lighting and indoor environment options in terms of their effects on occupants. These effects can be compared to the costs of implementation, which will assist decision makers to determine the most cost-effective choices.
References
ASHRAEIIESNA. 1989. Energy efficient design of new buildings except new low-rise residential buildings, ASHRAEIIES standard 90.1. American Society of Heating, Refrigeration and Air Conditioning Engineers, Atlanta.
Boyce, P. R. 1987. Lighting research and lighting design: Bridging the gap. Lighting Design and Application, 17 (5), pp. 10-12,50-51; and, 17 (6), pp. 38-44.
Canadian Codes Centre. 1995. National energy code for buildings (Public Review No. 1.0). National Research Council Canada, Ottawa.
IESNA. 1993. American national standard practice for office lighting (ANSUIESNA RP-1 1993). Illuminating Engineering Society of North America, New York.
Newsham, G. R. & Veitch, J. A. 1997. Energy-efficient lighting options: Predicted savings and occupant impressions of lighting quality. Proceedings of CLIMA 2000 Conference, Brussels, Belgium.
Veitch, J. A. & Newsham, G. R. In press-a. Determinants of lighting quality I: State of the science. Journal of the illuminating Engineering Society.
Veitch, J. A. & Newsham, G. R. In press-b. Lighting quality and energy-efficiency effects on task performance, mood, health, satisfaction and comfort. Journal of the Illuminating Engineering Society.
Fire Safety in Office Buildings: The Impact of Office Landscape Dr. Guyl&ne Proulx
[email protected] Fire Safety in Office Buildings - A n Introduction
Loss of property and life in fires in North American office buildings is relatively small compared to losses in other building classes. The reasons for this are many. First, fire safety systems such as alarms and sprinklers are widespread and well maintained. Secondly, evacuation drills are routinely rehearsed, often with dedicated fire wardens. Thirdly, office buildings generally contain no children or seniors, the most vulnerable members of society in a fire emergency. Fourthly, occupants are awake during
occupancy, and can thus respond quickly to warn others, contain the fire, or evacuate if necessary.
This relatively good picture is only maintained through investment in fire safety systems and training, and adherence to good operating practice. Evacuation times can only be kept down by providing occupants with training, early warning, and clear views along exit routes. Exit routes and stairwells should be unobstructed, and adequately sized for the number of people expected to use them. Distances to exits should be as short as possible. The fire load (density of combustible materials) should be minimized to slow down the rate of spread of a fire.
The potential for property damage is probably greatest during unoccupied hours, when a fire's development may go unnoticed for a lengthy period. The value of property within office buildings is rising rapidly - the rise of the information-based economy means that a business's assets reside in a filing cabinet or disk drive, not on the shop floor. Further, the modern office occupier has made a large investment in information technology
hardware, principally computers. Computers and the information they generate are assets very vulnerabIe to heat, smoke, and water damage from sprinkler systems.
The Impact of Increasing Occupant Density and other Office Landscape Features The adoption of higher occupant densities in office buildings may detrimentally affect fire safety, threatening human life and an organization's bottom line. Costs can be increased in several ways:
1. Increased property losses based on an increased risk of a fire occurring, and an increased loss estimate should a fire occur.
2. Increased insurance rates
3. Increased investment in fire safety systems as demanded by local fire authorities. Occupant density can compromise fire safety through several mechanisms. First, the fire load (or density of combustible materials) would increase. A higher fire load means a greater chance of a fire occurring, and a greater chance of that fire becoming severe.
Second, an occupant's speed of movement during an evacuation would be slower: there would be more occupants headed for the same, fixed number of exit routes. Third, the use of more partitions to define more workstations and corridors can impede movement and wayfinding. Each of these factors is considered in more detail below.
Fire Load
The total fxe load of a space generally increases linearly with the number of occupants. Each occupant requires a chair and a desk, filing cabinets, bookshelves, books and files, paper, and office equipment such as computers and printers. Further, occupants carry in personal belongings such as bags and clothing, and decorative elements for their workstation. In putting more occupants into a space, it is likely that partition walls will be installed to define work areas and ensure privacy. These partition walls
themseIves also contribute to the fxe load of the building. An increase in fire load increases the chance that a fire will start. because sparks
Figure 1. IRC simulation offlre spread in an open-plan office. from electrical faults, discarded cigarettes etc. are more likely to find fuel. Once a fxe does start, there will be more materia1 to fuel the fire, increasing its severity. Further, the combustible elements will be more densely located, increasing the potential of fire spread from one area to the next.
Speed of Movement
The speed of movement of occupants evacuating a building is an important factor in assessing fire safety for a building. Studies show that adding occupants to a floor increases evacuation time [Proulx et al., 1996aJ. Higher occupant density means more people trying to use the same corridors to reach an exit. Slower moving evacuees may cause "bottlenecks".
More important is the speed
of
movement in the stairwells. As all the occupants have to be channeled into a limited number of stairwells, the increased density of occupants in the stairs will slow the flow of evacuees and increase the overall evacuation time.Space Design and Wayfinding
Increasing occupant density requires a redesigning of the office floor plan. A common solution is to simply install more partition walls to defme additional workspaces. Conventional partition walls have a height from of 1.7 to 2 m, a height which limits the field of vision of most people standing in a corridor created by partition walls. A reduced field of vision makes it more difficult to identify the location of the closest exit and the best route to it. Remember that the evacuation routes are often not the familiar way out of the building. This problem is likely to be more serious for visitors to the building, or to recently arrived employees.
In addition, open-plan offices that use partition walls to define workspaces tend to become maze-like in their spatial organization with longer evacuation paths (see Figure
2). It is very important to avoid dead-end corridors, multiple turns and narrow corridors that restrict long range vision.
Figure 2. The effect of workspace layout on evacuation distance
It is critical that a reconfiguration of the floor plan is accompanied by a reconfiguration of the emergency lighting, so that the newly created exit routes are clearly marked.
While fire statistics suggest that the risk to life in office building fires is negligible, there is no evidence that the operation of office buildings at higher occupant densities would not increase evacuation time to such a degree that life was endangered. Neither is there evidence that risk to property would not be substantially elevated. The above arguments suggest that a detailed investigation is warranted.
Potential Positives
Increased occupant density does meail hicreased vigilance: there are more eyes to look for signs of fire, more noses to smell smoke. Early detection is a key factor in reducing losses due to fire. Secondly, the increase in occupant density is accompanied in some organizations by a greater adoption of "teamspace". Teamspace is designed to facilitate
greater communications between team members, and features lower partition heights. A
lowering of partition height means improved visibility in an emergency. Reducing Fire Risk
Clearly, technologies to reduce fire risk must focus on four things: Reducing evacuation time
Improving wayfinding Reducing fire load Improving fire protection
Potential solutions are shown in Table 1.
Table 1. Potential technologies and techniques to reduce fire risk in office buildings.
Evacuation Time Reduction \Vuyfindinx Improvement
Carciul plnnnlng of ex11 routcs . Impro\ed space organl/auon Emergency lighting improvement Improved signage
Adding exits and stairwells Use of photoluminescent materials Nominating fire wardens to prompt movement - Alarms with voice information
Creating areas ofruiuye Butter train~ng ant1 frequent dr~lls
. - -. . . - -. . . . Fire Lond Reduction Fire Protection In~provcment
Use of fireproof materials Create more fire-resistant compartments Use of fireproof storage systems Increase number of sprinkler heads Limit the quantity of combustibles Use of quick response detectors
There is obviously no shortage of potential solutions to reduce fire risk. The problem is determining the cost-effectiveness of each solution in any given situation. Tools to assess the cost-effectiveness of fire safety features in the context of open-plan office design do not yet exist. However, IRC is well placed to develop such tools.
IRC's Prior Relevant Research
IRC researchers have developed an internationally used methodology for studying building evacuation drills [Proulx et al., 1996bl. The method involves using multiple video cameras to record the movement of individuals. The times for individuals to respond to an alarm, move to the staimell, and traverse each flight of stairs are recorded. The data are analyzed in order to seek relationships between the various timings and demographic groupings, building characteristics, and ambient fire safety measures. This methndnlngy has heen applied in studies of evacuation drills in apartment buildings and large office buildings [Proulx et a]., 1996al. In the two office buildings studied, evacuation was completed in under five minutes. However, occupant density in these buildings was very low, at 33 to 42 m2 per person. Another study in a 57 storey office tower in Toronto found that a complete evacuation took over 15 minutes.
These field studies of evacuation have been used to validate IRC's Occupant Evacuation Model [Hadjisophocleous et al., 19971. The tool models the movement of individuals within the building, and uses the building geometry and occupant characteristics to determine evacuation times (see Figure 3). The model is currently capable of tracking up to 12,000 occupants of various demographic groupings. Preferred evacuation routes are determined by familiarity with the building, the length of the various optional routes, and the location of the f r e and smoke. The effects of queuing at doorways and other
bottlenecks are considered, and the option of seeking refuge at unaffected floors rather than evacuation to the building exterior is also available.
Figure 3. Evacuation model of a semi-open floor. Circles represent occupants, squares represent points ofpassage.
The Occupant Evacuation Model itself is only one part of a larger software tool called FiRECAMTM
.
FiRECAM was developed by IRC in collaboration with outside partners, such as Public Works and Government Services Canada, the Department of National Defence, and Victoria University of Technology in Australia. FiRECAM models the development of a fire from start to finish, including smoke movement, occupant response, and fire department response models (see Figure 4); all these models are based onmeasured data. Both property loss and risk to life are determined. FiRECAM is an ideal tool for studying the effect of occupant density and other office landscape features on the risk to life and property during a fire emergency. Further, this unique tool allows the comparison of the cost-effectiveness of different fire safety measures to be determined.
Conclusions
Current risk to life in the event of a fire in a large office building
in
North America is negligible. However, the effect of occupant density and other office landscape features is unknown, and may increase the risk to a meaningfil level.By concentrating valuable assets and increasing the fire load, an increase in occupant density poses a tangible threat to property.
Technologies to alleviate both increased risk to life and property are available, but a comprehensive study of their cost-effectiveness is lacking.
I
Evacuationt
Fire DepartmentEffectiveness
Fire Spread
I
Smoke Hazardb/
Element Failure Probability
I
PI
Smoke Property Loss Expected Risk to Economic Model
Movement Evaluation Life
4
t
4
Design Fire Fire Growth Number of
Deaths Generation
A
Figure 4. Flow diagram showing the various modules of the FiRECAM TM tool.
References
Hadjisophocleous, G. V., Proulx, G. & Liu, Q. 1997. Occupant Evacuation Model for Apartment and Office Buildings. IRC Internal Report No. 741. Institute for Research in Construction, Ottawa.
Proulx, G., Kaufman, A. & Pineau, J. 1996a. Evacuation time and movement in office buildings. IRC Internal Report No. 71 1. Institute for Research in Construction, Ottawa. Proulx, G., Laroche, C. & Pineau, J. 1996b. Methodolgy for evacuation drill studies. IRC Internal Report No. 730. Institute for Research in Construction, Ottawa.