READ THESE TERMS AND CONDITIONS CAREFULLY BEFORE USING THIS WEBSITE.
https://nrc-publications.canada.ca/eng/copyright
Vous avez des questions? Nous pouvons vous aider. Pour communiquer directement avec un auteur, consultez la première page de la revue dans laquelle son article a été publié afin de trouver ses coordonnées. Si vous n’arrivez pas à les repérer, communiquez avec nous à [email protected].
Questions? Contact the NRC Publications Archive team at
[email protected]. If you wish to email the authors directly, please see the first page of the publication for their contact information.
Archives des publications du CNRC
Access and use of this website and the material on it are subject to the Terms and Conditions set forth at Maunakea spectroscopic explorer 2018
Hill, Alexis; Flagey, Nicolas; McConnachie, Alan; Szeto, Kei
https://publications-cnrc.canada.ca/fra/droits
L’accès à ce site Web et l’utilisation de son contenu sont assujettis aux conditions présentées dans le site LISEZ CES CONDITIONS ATTENTIVEMENT AVANT D’UTILISER CE SITE WEB.
NRC Publications Record / Notice d'Archives des publications de CNRC: https://nrc-publications.canada.ca/eng/view/object/?id=8539d22c-49f5-46c4-be05-c202fa2264b1 https://publications-cnrc.canada.ca/fra/voir/objet/?id=8539d22c-49f5-46c4-be05-c202fa2264b1
MAUNAKEA
SPECTROSCOPIC
Maunakea Spectroscopic Explorer 2018
Alexis Hill Nicolas Flagey Alan McConnachie
Maunakea Spectroscopic Explorer 2018 ISBN 9781732873100
LCCN 2018961660 ©2018 MSE, CFHT Corp.
Table of Contents
Table of Figures ... 6
Glossary of Acronyms ... 11
Preface... 13
Purpose and Scope ... 13
A Note on the Structure of the Maunakea Spectroscopic Explorer 2018 book ... 13
Credits and Acknowledgements ... 13
Contributors ... 14
1. Executive Summary ... 15
2. Overview: What is MSE? ... 18
2.1. The Science Case: Exploring the Composition and Dynamics of the Faint Universe ... 19
2.2. Science Opportunities: MSE as Part of the Facility Landscape ... 24
2.3. Science Capabilities ... 26
2.3.1. From Science to Requirements ... 26
2.3.2. Key Capabilities ... 28
2.3.3. MSE Compared with Other Multi-object Spectrographs... 30
2.4. The MSE Observatory ... 33
2.4.1. Observatory Layout ... 33
2.4.2. Site Considerations ... 35
2.4.3. Science Operations... 35
2.4.4. Survey Selection ... 37
3. MSE System Design ... 39
3.1. Design Philosophy... 40
3.2. Design Constraints ... 40
3.3. System Design ... 40
3.4. Major Trade Studies and Design Choices ... 43
3.4.1. Enclosure Design Selection ... 43
3.4.2. Telescope Optical Configuration Trade Study ... 44
3.4.3. Development of Multiplexing Strategies ... 46
3.4.4. Fiber Positioning System Down-select ... 49
3.4.5. Fiber Transmission System Trade Study ... 49
3.5. System Performance and Performance Budgets ... 52
3.5.1. MSE Sensitivity ... 52
3.5.2. Sensitivity Budgets and Upcoming Trade Studies... 53
3.5.3. Observing Efficiency ... 58
3.5.4. Calibration budgets ... 58
4. Observatory Subsystem Description ... 60
4.1. Observatory Building and Facilities (OBF) ... 60
4.1.1. Observatory Building and Facilities Overview... 60
4.1.2. Outer Building (OB) and Inner Pier (PIER) ... 62
4.1.3. Thermal Management (THE) ... 65
4.1.4. Utilities (UTI) ... 66
4.1.5. Handling and Accessibility (ACC) ... 67
4.1.6. Shops and Labs (SHO)... 67
4.1.7. Other Spaces and Facilities (OTSp) ... 68
4.2. Enclosure (ENCL) ... 69
4.2.1. Enclosure Overview ... 69
4.2.2. Enclosure Functions ... 70
4.2.3. Enclosure Structure (STR) ... 70
4.2.4. Enclosure Control System (ECS)... 78
4.2.5. Enclosure Safety System (ESS) ... 78
4.3. Telescope (TEL) ... 80
4.3.1. Telescope Overview... 80
4.3.2. Telescope Functions... 85
4.3.3. Telescope Mount Structure (MSTR) ... 86
4.3.4. Primary Mirror Optics System (M1)... 95
4.3.5. Wide Field Corrector and Atmospheric Dispersion Corrector (WFC/ADC) ... 102
4.3.6. Prime Focus Hexapod System (PFHS) ... 106
4.3.7. Instrument Rotator (InRo)... 109
4.3.8. Telescope Optical Feedback System (TOFS) ... 111
4.3.9. Telescope Safety System (TSS) ... 115
4.4. Science Instrument Package (SIP) ... 116
4.4.1. Science Instrument Package Overview ... 116
4.4.3. Positioner System (PosS) ... 118
4.4.4. Fiber Transmission System (FiTS) ... 124
4.4.5. Low and Moderate Resolution Spectrographs (LMR)... 129
4.4.6. High Resolution Spectrographs (HR) ... 135
4.4.7. Science Calibration System (SCal) ... 142
4.5. Observatory Execution System Architecture (OESA) Overview ... 144
4.5.1. Observatory Execution System Architecture Functions ... 145
4.5.2. Observatory Control Sequencer ... 145
4.5.3. Telescope, Instrument, and Facility Control Sequencers ... 146
4.5.4. Data Management System ... 147
4.5.5. Common Software (CSW) ... 147
4.5.6. Computing Services ... 148
4.6. Program Execution System Architecture (PESA) ... 149
4.6.1. Queue-Scheduled Observing (QSO) ... 150
4.6.2. Data Reduction, Validation, and Distribution... 150
5. Moving Forward to the Preliminary Design Phase ... 152
5.1. Partnership ... 152
5.2. Growth through Science ... 153
5.3. Progress through Engineering ... 153
5.4. Preliminary Design Phase Governance ... 154
5.5. Preliminary Design Phase Execution Plan ... 154
5.6. Project Office Roles and Responsibilities ... 155
5.7. Education and Public Outreach Program ... 156
Table of Figures
Figure 1: Exterior views of CFHT (ventilation modules open) and MSE (ventilation modules closed). ... 16
Figure 2: Left panel: Cone plot showing an illustrative MSE survey, in comparison with other notable benchmark galaxy surveys. Cones are truncated at the redshift at which L* galaxies are no longer visible. Right panels: Lookback time versus cosmic star formation rate (right axis) using the parameterization of Hopkins & Beacom (ApJ 2006: 651, 142). Grey lines indicate the wavelength of OII 3727Å. Also indicated on this wavelength scale is the wavelength coverage of the major highly multiplexed spectrographs in development. These are offset according to their system’s étendue (left axis). The light cone demonstrates the range of MSE for extragalactic surveys, using a homogeneous set of tracers at all redshifts. ... 20
Figure 3: Main panel shows the relative flux of a synthetic spectrum of a metal-poor red giant star at the moderate MSE spectral resolution of R~6000, along with some of the strong-line stellar diagnostics accessible at this resolution. Highlighted regions show the normalized flux in three windows, observable with the high-resolution mode of MSE. A magnified region of the UV window shows examples of the species that will be identified at high resolution. MSE chemical tagging surveys will identify species by sampling a large and diverse set of nucleosynthetic pathways and processes. ... 21
Figure 4: Recovery of line-of-sight velocity dispersion (left) and dark matter density (right) profiles as a function of stellar spectroscopic sample size for dwarf galaxies, demonstrating the need for extensive datasets with MSE. Shaded regions represent 95% credible intervals from a standard analysis of mock data sets consisting of radial velocities for N=102, 103, and 104 stars (median velocity errors of 2km/s), generated from an equilibrium dynamical model for which true profiles are known (thick black lines). ... 22
Figure 5: Some of the most notable next generation facilities that, together with MSE, will help define the international network of astronomical facilities operational beyond the 2020s. ... 24
Figure 6: Etendue vs. wavelength coverage for the upcoming wide-field MOS facilities listed in Table 3... 31
Figure 7: Comparison of the survey speeds of the three 8–10 m class wide-field MOS capabilities in design or under construction. ... 32
Figure 8: Current anticipated timelines of the wide-field MOS facilities listed in Table 3. Bounded boxes indicate the duration or lifetime of the survey or facility, and the absence of a vertical solid line indicates that the facility has no clear end date. Several of the facilities will operate initially for a set period of years, with the expectation that their lifespan will be extended beyond the nominal end date. This figure was inspired by a similar figure created by J. Newman. ... 32
Figure 9: MSE Observatory architecture. ... 34
Figure 10: Phases of the science operations. ... 36
Figure 11: The Product Breakdown Structure for MSE. This chart shows all the major physical elements of MSE and their relation to each other. ... 39
Figure 12: Observatory activities organized into five activity groups. ... 41
Figure 13: Functional Architecture Diagram with first- and second-level functional blocks. ... 41
Figure 14: Enclosure styles. From left to right: CFHT, Subaru, Keck, Gemini. ... 43
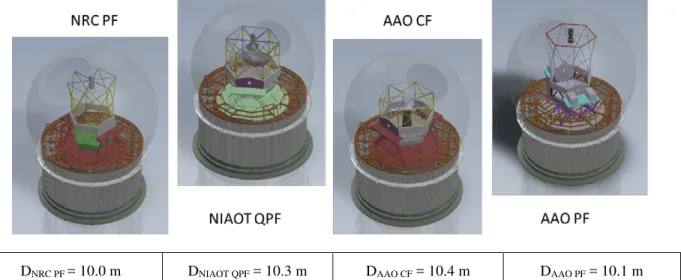
Figure 15: MSE calotte enclosure concept. ... 44
Figure 16: Primary mirror and optical configuration trade study. ... 45
Figure 17: Prime focus and non-prime focus primary mirror options. ... 45
Figure 18: CAD models and effective diameters, D, of the optical configurations in the trade study. ... 46
Figure 19: Phi-theta positioner system—individual unit and positioner array. ... 47
Figure 20: Tilting spine positioner system—operating principle and positioner array. ... 48 Figure 21: Results of the fiber diameter sensitivity analysis for high resolution (left) and low resolution
(right). Top panels—The red curve shows the Moffat function corresponding to the median delivered IQ for MSE. Blue curves represent the time-averaged source profiles. For high
resolution, only point sources have been considered. For low resolution, average galaxy profiles have been considered, in addition to the PSF variations. Bottom panels—The relative time taken to reach a given SNR as a function of fiber radius, for the flux distributions in the top panel and
assuming sky-limited targets. ... 50
Figure 22: The required sensitivity of MSE during a one-hour exposure, under median seeing conditions expressed in SNR per resolution elements (left) and limiting magnitude (right). On each side, the top, middle, and bottom panels show the low, moderate, and high spectral resolution settings, respectively. The red lines show the requirements, and the blue lines show estimates of performance, as of the end of the Conceptual Design phase. Line segments correspond to the different arms of the spectrographs. ... 53
Figure 23: IQ contributors—Seeing (66%), WFC/ADC (16%), and M1 (18%) ... 56
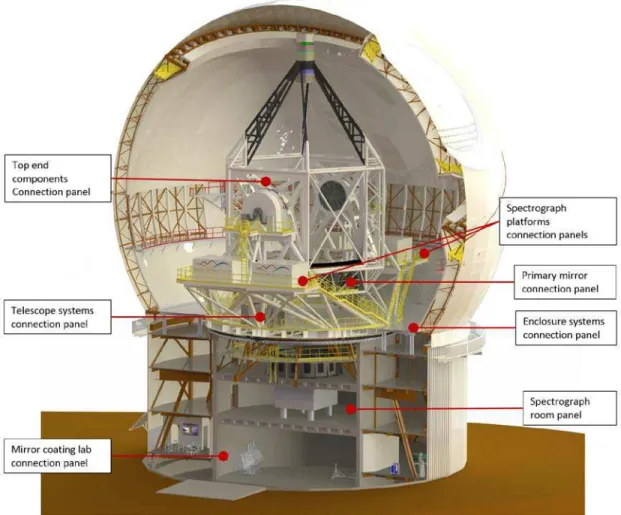
Figure 24: MSE Observatory Building and Facilities, layout ... 61
Figure 25: OBF Product Breakdown Structure... 62
Figure 26: OBF structural components—Outer Building and Inner Pier ... 62
Figure 27: Inner Pier modification—New concrete haunch... 63
Figure 28: Outer Building modifications and retrofits. ... 64
Figure 29: Outer Building modification—buckling-restrained braces. ... 64
Figure 30: Thermal management strategies implemented in OBF and Enclosure ... 66
Figure 31: Utilities distribution on the Telescope—Red dots show provisional main connecting panel locations ... 67
Figure 32: Enclosure with major components shown, with cap structure (left) and without (right). ... 69
Figure 33: Enclosure PBS ... 70
Figure 34: Enclosure rib and tie structure—MSE (left) and CFHT (right), under construction. ... 71
Figure 35: Enclosure aperture positions by cap rotation. ... 72
Figure 36: Shutter seal operation. ... 73
Figure 37: Enclosure seals—exterior (left) and interior (right) ... 74
Figure 38: Enclosure access walkways and platforms ... 75
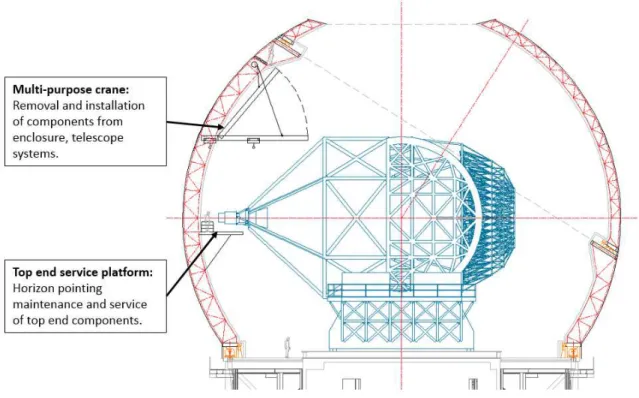
Figure 39: Top-end service platform enables access to the telescope’s top end at horizon pointing... 76
Figure 40: Azimuth mechanisms—drive wheels (top), CFHT bogies (bottom) ... 77
Figure 41: Cap drive bogies attached on base structure top ring girder. ... 78
Figure 42: Telescope—structural components and payload. ... 80
Figure 43: Top-end assembly components. ... 81
Figure 44: Telescope stay-in, RTEL=15.5 m, and Enclosure stay-out, RENCL = 15.8 m, radii. ... 82
Figure 45: M1 and WFC/ADC (left); WFC/ADC (center)—Lens 1 to Lens 5, with Lens 2 providing atmospheric dispersion correction; ADC action (right)—the entire WFC rotates about the point C1, as the global tilt via PFHS, while L2 rotates about point C2. ... 83
Figure 46: Field of view at the prime focus. ... 84
Figure 47: Telescope Product Breakdown Structure ... 85
Figure 48: Telescope Mount Structure (MSTR) layout ... 87
Figure 49: Telescope mount yoke configuration—elevation structure (left) and azimuth structure (right). ... 88
Figure 50: Altitude or elevation structure—yoke concept (left) and rocking chair concept (right). ... 88
Figure 51: Telescope elevation structure structural components. ... 89
Figure 52: Telescope spiders and top end. The right-hand figure shows the four welded joints (black lines) between the top-end interface ring and the spiders: two of the welded joints incorporate two spiders each (at 3 and 9 o’clock), while the other two joints have only one spider each (at 6 and 12 o’clock); the middle figure shows a typical section. ... 90
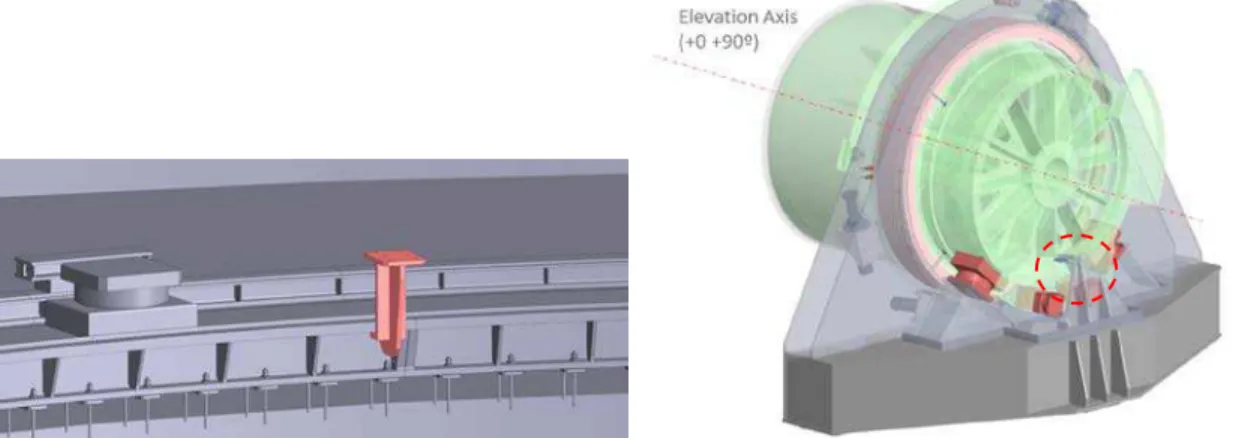
Figure 53: Telescope seismic restraints. Azimuth restraint acting on azimuth track (left), elevation restraint within the dashed circle (right). ... 91
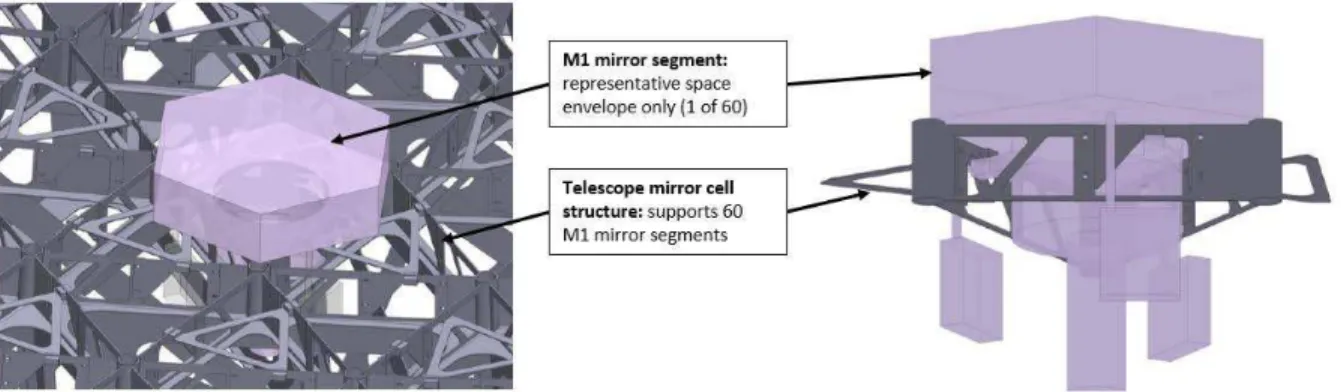
Figure 54: Telescope structure: M1 cell. ... 91
Figure 55: Attached position of the mirror segment assembly (shown as purple space envelope) relative to the mirror cell can be adjusted. ... 92
Figure 56: Telescope azimuth structure vertical and lateral load paths ... 92
Figure 57: Telescope seismic isolation system between azimuth floor (top) and central bearing. ... 93
Figure 58: Telescope azimuth axis mechanisms ... 94
Figure 59: Telescope elevation mechanism ... 95
Figure 60: Diagram of the primary MSE mirror segments with the 60 Segments numbered and arranged in six identical sectors (A–F). ... 97
Figure 61: Examples of M1 designs clockwise from top left: Keck segment display (half coated) on handling cart, GTC segments on handling carts, ELT segment support structure at the vendor assembly facility, TMT segment and its support assembly on display at SPIE. ... 98
Figure 62: PSA block diagram of the assemblies. Green blocks represent the SSA, pink blocks the M1CS, and blue blocks the PMA. ... 99
Figure 63: Keck segment-handling system—Enclosure-mounted, segment-handling crane with segment lifting-fixture (top), segment secured on lifting fixture on top of M1 (middle), and segment lowered to handling cart on the observatory floor (bottom). ... 101
Figure 64: WFC/ADC Opto-mechanical design—(1) Optical barrel support, (2) Light baffle, (3) L1 cell set assembly, (4) L2 cell set assembly, (5) L3 cell set assembly, (6) L4 cell set assembly, (7) L5 cell set assembly, (8) Optical barrel spacer L1–L2, (9) Optical barrel spacer L2–L3, (10) Optical barrel spacer L3–L4, (11) Optical barrel spacer L4–L5. ... 103
Figure 65: WFC lens cell assembly, typical: (1) L1 cell base ring, (2) L1 cell clamp ring, (3) Lens 1, (4) L1 cell-athermalized radial restraint assembly, (5) L1 cell radial pad, (6) L1 cell axial pad. ... 105
Figure 66: WFC lens cell design concept, typical—Left-hand panel illustrates overall setting assembly: (1) L1 cell assembly, (2) L1 spacer ring, (3) L1 set setting ring, (4) Lens setting clamp, (5) Lens setting adjustment vertical, (6) Lens setting adjustment horizontal, (7) Lens setting guide horizontal. ... 105
Figure 67: L2 mechanism options—hexapod (left) and linkage assembly (right). The linkage assembly uses a single actuator to move L2 on a prescribed trajectory, guided by three horizontal cam followers (A, B, and C), and two vertical cam followers (D and E), which constrain the rotation of L2. ... 106
Figure 68: PFHS assembly with illustrative payload in orange—(1) Payload attachment spacer, (2) Hexapod top ring, (3) Top ring joint, one per actuator, (4) Actuator, six total, (5) Bottom ring joint, one per actuator, (6) Hexapod base ring. ... 107
Figure 69: Example of the Symetrie JORAN hexapod. ... 108
Figure 70: Instrument Rotator concept, with torque motor mechanism – (1) Payload attachment spacer, (2) Stator support, (3) Rotor support, (4) Stator, (5) Rotor, (6) Brake and encoder system, (7) Precision rotation bearing ... 109
Figure 71: InRo – Example of a dedicated, integrated, low-voltage torque motor, made by PHASE MOTION CONTROL, for rotator application. ... 110
Figure 72: Left side view of the origin of misalignment in the Zemax simulation and (right) top view of the nominal locations and sizes of the Acquisition and Guide Cameras with 1k x 1k CCD guide camera in the telescope-delivered circular field of view. ... 112
Figure 73: Phasing and Alignment Camera optical layout ... 114
Figure 74: PAC opto-mechanical layout—the top of gray disk (solid color) represents the interface plane for the optical bench and the semi-transparent gray box represents the allowable space envelope. ... 114
Figure 75: Components of Science Instrument Package. ... 116
Figure 76: Focal plane arrangement—full field coverage with distribution of LMR fibers (pink) and HR fibers (blue). ... 117
Figure 78: PosS components in the MSE telescope structure—Positioner array and control electronic cabinets are located at the top end (top right) and the metrology system is located in the empty
central M1 segment location (bottom right). ... 119
Figure 79: Sphinx fiber positioner module—Each module carries 76 spines, with 57 LMR and 19 HR fibers (bottom right), two adjacent spine assemblies (left) and a close-up of the piezo actuator (top right). ... 120
Figure 80: 57 Sphinx positioner modules mounted onto the reference support structure in the Triskele pattern. ... 121
Figure 81: Positioner patrol areas and field coverage—LMR (left) and HR (right). ... 122
Figure 82: FiTS cable routing—LMR fibers (blue lines) and HR fibers (red lines). The colored boxes illustrate the conceptual locations of the spectrographs. ... 124
Figure 83: GRACES fiber optic link ... 125
Figure 84: PosS (left) and FiTS (right) at the top end: (1) Positioning system (simplified), (2) fiber combiner, (3) helical tubes, (4) loop boxes, which share space with the electronic PosS cabinets. ... 126
Figure 85: Cable schematic: the photons enter the fibers in the Prime Focus Assembly from the right. See below for descriptions of components 1–7. To feed multiple spectrographs, additional fiber slit blocks can be added after each loop box (component 6). ... 126
Figure 86: Left: Curved slit block from AAT/HERMES (Note: Magnification optics will not be used in MSE). Right: V-grooves and strain-relief concepts for a straight slit input unit, as proposed by HAA. ... 127
Figure 87: Ring test for FRD measurement and the corresponding processed image. ... 128
Figure 88: FRD results according to input beam f# with candidate Polymicro fiber, using the ring test. ... 128
Figure 89: LMR spectrographs on instrument platforms, three units per platform, the middle unit with cover removed. ... 129
Figure 90: Spectral resolution as a function of wavelength for all configurations. Bold horizontal lines indicate the science requirements at both low (red) and moderate (purple) spectral resolutions (solid lines for optical channels, dashed lines for NIR channels). ... 130
Figure 91: Layout of the LMR with major elements highlighted. ... 131
Figure 92: Representative spot diagrams versus field position and wavelength for LMR spectrograph optical design. ... 132
Figure 93: Throughput as a function of wavelength for low spectral resolution. ... 132
Figure 94: Throughput as a function of wavelength for moderate spectral resolution. ... 132
Figure 95: (Left) Simulated far-field image at the fiber output for an on-axis untilted fiber, showing beam cut-off, with collimator acceptance speeds of f/2.083 (magenta circle) and f/1.97 (orange circle). (Center) The corresponding radial intensity profile through the same beam (black) and for tilted fibers. The radial positions of the beam cut-offs at the same collimator speeds of f/2.083 (magenta) and f/1.97 (orange) are also shown. The corresponding collimator overfilling light losses for an untilted fiber are 4.5% and 2.2%, respectively. (Right) The selected collimator speed of f/2.083 corresponds to a circular primary mirror diameter of 10.42 m. ... 133
Figure 96: The optical layout of HR, with major elements highlighted. ... 136
Figure 97: The image quality of HR, as represented by spot diagrams across the field for the blue working windows. ... 137
Figure 98: The throughput of the HR in each of the three channels (top panels) and in the three working windows in each channel (bottom panels). ... 138
Figure 99: Proposed fiber layout at the slit. The directions of views (b) and (c) are indicated in (a). ... 139
Figure 100: The f/2.05 off-axis collimator design. ... 139
Figure 101: HR disperser configuration for each of the three channels. ... 140
Figure 102: HR camera lenses and detector. Aspheres are marked by an asterisk. ... 141
Figure 104: OESA Product Breakdown Structure ... 145
Figure 105: Common control system architecture ... 146
Figure 106: PESA Product Breakdown Structure. ... 149
Glossary of Acronyms
AAO Australian Astronomical Observatory ACC Handling and Accessibility
ADC Atmospheric Dispersion Corrector ADRP Automatic Data Reduction Pipeline AGC Acquisition and Guide Cameras AlON Aluminium OxyNitride
API Application Programming Interface ApJ Astrophysical Journal
APS Alignment and Phasing System AR Anti-Reflection
CFHT Canada-France-Hawaii Telescope CMP Comprehensive Management Plan CNRS Centre National de la Recherche
Scientifique
Coat Mirror Coating System CoDP Conceptual Design Phase CpS Computing Services
CRAL Centre de Recherche Astrophysique de Lyon
CSW Common Software
DAD Data Archives and Distribution DIMM Differential Image Motion Monitor DMS Data Management System
DRP Data Reduction Pipeline DRS Design Reference Survey DSC Detailed Science Case
DT-INSU Division Technique de l’INSU ECMS Environmental Conditions Monitoring
System
ECS Enclosure Control System ELT Extremely Large Telescope EM EnVision Maunakea ENCL Enclosure
EPO Education and Public Outreach ESPaDOnS Echelle Spectro Polarimetric Device for
the Observation of Stars ESS Enclosure Safety System ETC Exposure Time Calculator FCSe Facility Control Sequencer FEA Finite Element Analysis
FIRE Feedback in Realistic Environments FiTS Fiber Transmission System FRD Focal Ratio Degradation
FTO FiberTech Optica
GMT Giant Magellan Telescope GRACES Gemini Remote Access Echelle
Spectrograph
GTC Gran Telescopio Canarias GUIs Graphical User Interfaces
HAA Herzberg Astronomy and Astrophysics HIRES High Resolution Echelle Spectrometer HR High Resolution
ICS Instrument Control System ICSe Instrument Control Sequencer IFU Integral Field Unit
IIA Indian Institute of Astrophysics InRo Instrument Rotator
IQ Image Quality
LMR Low and Moderate Resolution LMT Large Millimeter Telescope Alfonso
Serrano
LSST Large Synoptic Survey Telescope LUT Lookup Table
M1 Primary Mirror Optics System M1CS M1 Control System
MCS Mount Control System MG Management Group MOS Multi-Object Spectrograph MSA Mounted Segment Assembly MSE Maunakea Spectroscopic Explorer MSTR Telescope Mount Structure
NAOC National Astronomical Observatories of China
ngVLA next generation Very Large Array NIAOT Nanjing Institute of Astronomical Optics
and Technology
NIHAO Numerical Investigation of a Hundred Astrophysical Objects (project)
NOAO National Optical Astronomy Observatory NRC National Research Council
OAD Observatory Architecture Document OB Outer Building
OBF Observatory Building and Facilities OCD Operations Concept Document OCSe Observatory Control Sequencer ODR Observatory Data Repository
OED Observing Element Database OESA Observatory Execution System
Architecture OF Observing Field OM Observing Matrix
OMG Observing Matrix Generator
ORD Observatory Requirements Document OS Observing Sequence
OSS Observatory Safety System OTSp Other Spaces and Facilities PAC Phasing and Alignment Camera PBS Product Breakdown Structure PCS Phasing Camera Systems PDP Preliminary Design Phase PEAS Procedure Executive and Analysis
Software
PESA Program Execution System Architecture PFHS Prime Focus Hexapod System
PIER Inner Pier
PMA Polished Mirror Assembly PO Project Office
PosS Positioner System
PSA Primary Segment Assemblies PSF Point Spread Function QSO Queue-scheduled Observing r- rapid neutron capture
RTV Room Temperature Vulcanizing s- slow neutron capture
SCal Science Calibration System SCW Service Cable Wrap
SDSS Sloan Digital Sky Survey sGRB short Gamma Ray Burst SH Shack-Hartmann SHO Shops and Labs
SHS Segment Handling System SIP Science Instrument Package SKA Square Kilometer Array SNR Signal-to-Noise Ratio SoU Statement of Understanding SPA Science Products Archive SRD Science Requirements Document SSA Segment Support Assembly
STEM Science, Technology, Engineering and Mathematics
STR Structure
SWG Science Working Groups TCSe Telescope Control Sequencer TEL Telescope
THE Thermal Management System TMT Thirty Meter Telescope
TOFS Telescope Optical Feedback System TSS Telescope Safety System
UAM Universidad Autónoma de Madrid USTC University of Science and Technology of
China
UTI Utilities System UVic University of Victoria WBS Work Breakdown Structure WFC Wide Field Corrector
Preface
Purpose and Scope
This is the Maunakea Spectroscopic Explorer 2018 book. It is intended as a concise reference guide to all aspects of the scientific and technical design of MSE, for the international astronomy and engineering communities, and related agencies. The current version is a status report of MSE’s science goals and their practical implementation, following the System Conceptual Design Review, held in January 2018.
For a complete description of the science case for MSE, intended for the astronomy community, please see The Detailed Science Case for the Maunakea Spectroscopic Explorer.1
A Note on the Structure of the Maunakea Spectroscopic Explorer 2018 book
The book is divided into five chapters: Chapter 1 contains the Executive Summary.
Chapter 2 focuses on the science case and science capabilities of MSE, including the highlights of the layout of the MSE Observatory and the science operations model. It answers the question: what will MSE do and what will it look like?
Chapter 3 focuses on the overall system design, and highlights important design decisions, which affect the system and major sub-systems. It answers the question: why does MSE look the way it does?
Chapter 4 provides detailed descriptions of the conceptual designs of all MSE’s major subsystems. It answers the question: how does MSE work?
Chapter 5 presents a concise overview of the plan for moving MSE forward to the next
Preliminary Design Phase and beyond and contains the relevant programmatic information.2 It
answers the question: how do we plan to bring MSE to fruition?
Credits and Acknowledgements
The MSE 2018 book represents several years of work on the development of the conceptual design of MSE. This work includes significant engineering contributions from participants based in Canada, France and Hawaii, as well as in Australia, China, India, and Spain, all coordinated from the MSE Project Office, located at the CFHT Headquarters in Waimea, Hawaii. The
authors and the MSE collaborators recognize the cultural importance of the summit of Maunakea to a broad cross section of the Native Hawaiian community.
The MSE 2018 book contains a summary of a large amount of scientific and engineering documentation, produced by the Project Office and the international team, which led to the System Conceptual Design of MSE in 2018.
1https://arxiv.org/abs/1606.00043
2 Please refer to the MSE Prospectus, http://mse.cfht.hawaii.edu/docs/mse-science-docs/prospectus/MSE_prospectus_3-6-18_spreads.pdf for the project schedule and cost.
Contributors
Anthony, Andre Hall, Patrick Prada, Francisco Ariño, Javier Ho, Kevin Rai, Corinne Babas, Ferdinand Horville, David Ricard, Coba Bagnoud, Gregoire Hu, Hongzhuan Roberts, Jennifer Baker, Gabriella Irusta, David Rodgers, J. Michael Barrick, Gregory Isani, Sidik Rodgers, Jane Bauman, Steve Jahandar, Farbod Ruan, Federico Benedict, Tom Kaplinghat, Manoj Russelo, Tamatea Berthod, Christophe Kielty , Collin Salmom, Derrick Bilbao, Armando Kulkarni, Neelesh Sánchez, Justo Bizkarguenaga, Alberto Lahidalga, Leire Saunders, Will Blin, Alexandre Laurent, Florence Scott, Case Bradley, Colin Lawrence, Jon Sheinis, Andy Brousseau, Denis Laychak, Mary Beth Simons, Douglas Brown, Rebecca Lee, Jooyoung Smedley, Scott Brzeski, Jurek Liu, Zhigang Tang, Zhen Brzezik, Walter Loewen, Nathan Teran, Jose Caillier, Patrick López, Fernando Thibault, Simon Campo, Ramón Lorentz, Thomas Thirupathi, Sivarani Carton, Pierre-Henri Lorgeoux, Guillaume Tresse, Laurence Chu, Jiaru Mahoney, Billy Troy, Mitchell Churilov, Vladimir Mali, Slavko Urrutia, Rafael Crampton, David Manuel, Eric van Vuuren, Emile Crofoot, Lisa Martínez, Sofía Venkatesan, Sudharshan Dale, Laurie Mazoukh, Celine Venn, Kim
de Bilbao, Lander Messaddeq, Younès Vermeulen, Tom de la Maza, Markel Sainz Migniau, Jean-Emmanuel Villaver, Eva Devost, Daniel Mignot, Shan Waller, Lew Edgar, Michael Monty, Stephanie Wang, Lei Erickson, Darren Morency, Steeve Wang, Jianping Farrell, Tony Mouser, Yves Williams, Eric Fouque, Pascal Muller, Ronny Wilson, Matt Fournier, Paul Muller, Rolf Withington, Kanoa Garrido, Javier Murga, Gaizka Yèche, Christophe Gedig, Mike Murowinski, Rick Yong, David Geyskens, Nicolas Nicolov, Victor Zhai, Chao Gilbert, James Pai, Naveen Zhang, Kai Gillingham, Peter Pawluczyk, Rafal Zhelem, Ross González de Rivera, Guillermo Pazder, John Zhou, Zengxiang Green, Greg Pécontal, Arlette
1.
Executive Summary
Maunakea Spectroscopic Explorer (MSE) is a planned 10-m class, wide-field, optical and near-infrared facility, designed to enable transformative science, while filling a critical missing gap in the emerging international network of large-scale astronomical facilities. MSE is completely dedicated to multi-object spectroscopy of samples of between thousands and millions of
astrophysical objects. It will lead the world in this arena, due to its unique design capabilities: it will boast a large (11.25 m) aperture and wide (1.52 sq. degree) field of view; it will have the capabilities to observe at a wide range of spectral resolutions, from R2500 to R40,000, with massive multiplexing (4,332 spectra per exposure, with all spectral resolutions available at all times), and an on-target observing efficiency of more than 80%. With these unrivalled
capabilities, MSE will collect a number of spectra equivalent to an entire SDSS Legacy Survey every eight weeks.
MSE will unveil the composition and dynamics of the faint Universe and is designed to excel at precision studies of faint astrophysical phenomena. This will enable unique and transformative science. Among other science cases, MSE will reveal the emergence of the Periodic Table of the elements; it will provide the premier facility for astrophysical exploration of the nature of dark matter; it will chart the growth of supermassive black holes, and discover the connection of galaxies to the large-scale structure of the Universe. MSE will also provide critical follow-up for multi-wavelength imaging surveys, such as those of the Large Synoptic Survey Telescope, Gaia, Euclid, the Wide Field Infrared Survey Telescope, the Square Kilometre Array, and the Next Generation Very Large Array. This new generation of facilities is beginning to collect enormous datasets of billions of new faint objects, datasets which will grow exponentially over the coming decade. MSE provides essential optical and near-infrared spectroscopic follow-up for millions of these faint sources. In this respect, MSE enables a synergy between wide-field imaging surveys and pointed follow-up by the Thirty Meter Telescope, the Giant Magellan Telescope, and the (European) Extremely Large Telescope, by providing the essential filtering of the immensely large survey datasets. MSE has extensive science overlaps and complementary capabilities compared to most of the upcoming generation of astronomical facilities, and the strategic importance of MSE cannot be overstated.
The scientific impact of MSE will be made possible and affordable by upgrading the existing Canada-France-Hawaii Telescope (CFHT) infrastructure on the Maunakea summit, Hawaii. CFHT is located at a world-class astronomical site with excellent free-atmosphere seeing (0.4 arcseconds median seeing at 500 nm). The Mauna Kea Science Reserve Comprehensive Management Plani for the Astronomy Precinct explicitly recognizes CFHT as one of the sites that will be redeveloped. CFHT is an iconic 3.6-m telescope with four decades of operational experience and a legacy of discovery on Maunakea. MSE will build on the experience of CFHT and incorporate the latest technical advancements made by other top astronomical facilities. In order to minimize environmental and cultural impacts to the site, as well as minimizing cost, MSE will replace CFHT with an 11.25 m aperture telescope, while retaining the current summit facility footprint.
Figure 1: Exterior views of CFHT (ventilation modules open) and MSE (ventilation modules closed).
The rotating CFHT enclosure will be replaced by a Calotte enclosure that is only 10% larger than the current size, leaving the foundation and much of the remaining infrastructure intact. Building renovations and structural upgrades will be internal, so the outward appearance of MSE will remain very much unchanged from that of CFHT (Figure 1). Inside, however, a modern
observatory will perform cutting-edge science at one of the best astronomical sites in the world, with access to three quarters of the entire night sky.
MSE is designed to take advantage of the proven site on Maunakea, which allows for an extremely sensitive, wide-field, and massively multiplexed facility. These design attributes are the key ingredients that will enable researchers to efficiently conduct large surveys of faint astronomical objects. At the MSE focal surface, 4,332 light-collecting input fibers are packed into a hexagonal array. The fibers are precisely positioned to a submillimeter accuracy, within six microns of error, in order to maximize the amount of light injected from science targets into the input fibers, which collect and transmit light to banks of spectrographs tens of meters away. The exquisite seeing allows the fiber diameters to be kept small,3 thus keeping the size and cost of the spectrographs attainable. One bank of spectrographs receives light from 3,249 fibers from the focal surface and is switchable between the collection of low resolution spectra at R2500 and moderate resolution spectra at R6000, covering the optical to near-infrared wavelength range of 0.36–1.8 microns. Concurrently, the other bank of spectrographs receives light from 1,083 fibers from the focal surface and is dedicated to collecting the high resolution spectra in targeted optical wavelength windows within the wavelength range of 0.36–0.5 microns at R40,000 and 0.5–0.9 microns at R20,000. All resolution modes have simultaneous full field coverage, and the massive multiplexing results in many thousands of spectra per hour and over a million spectra per month, available to the MSE user community. An Integral Field Unit (IFU) system has been incorporated into the design, as an upgrade path for a second generation capability for MSE. Aside from the physical infrastructure, MSE’s success is enabled by efficiently scheduled and executed surveys, by the quality of the data collected, and by MSE’s ability to make the science products available to survey teams in a timely and efficient manner. MSE will devote
3 85 micron diameter, 0.8 arcseconds, for the high resolution spectrographs and 107 micron diameter, 1.0 arcseconds,
approximately 80% of available time to executing large, homogeneous legacy surveys, which require several years to complete. More focused strategic programs, which require smaller amounts of observing time and typically lead to more rapid publications, will occupy the remaining 20% of observing time. Proposals for both types of programs will be solicited from the MSE user community at regular intervals, and the selection process will be determined using the MSE partnership governance model. MSE is operated solely in a queue-based mode,
requiring sophisticated scheduling software. Data is made available to the survey team immediately, and to the whole MSE community on a short timescale. All data and derived products will have a proprietary period, set by the MSE partnership.
CFHT has been a long-term leader in engaging with the community through innovative public outreach programs for the promotion of science, technology, engineering, and mathematics (STEM), culture, and the environment. As a member of the Maunakea Observatories and international astronomical communities, MSE will continue CFHT’s legacy of community engagement within the partnership. Community engagement will be an integral part of MSE’s outreach activities throughout the life of the new observatory.
ihttp://www.malamamaunakea.org/management/master-plan
2.
Overview: What is MSE?
MSE is the realization of a long-held ambition: to provide dedicated, large-aperture, wide-field multi-object spectroscopy at optical and near-infrared wavelengths. It is designed to meet the diverse needs of various fields of astronomy, needs which are all centered on a single capability. MSE will be at the hub of the international network of astronomical facilities in the 2020s and beyond. It enables transformative, standalone science and enriches everything from our
understanding of the formation of the elements of the periodic table to the nature of dark matter; from the growth of supermassive black holes and the connection of galaxies to the large-scale structure of the Universe. A detailed summary of the science capabilities of MSE is provided in Table 1.
This chapter presents an overview of the science that has driven the development and detailed design of MSE (Section 2.1). It describes how MSE complements other front-line facilities (Section 2.2) and provides a summary of the key capabilities of the observatory, particularly with respect to other multi-object spectroscopic instruments (Section 2.3). It concludes with a top-level overview of the design of MSE, which highlights key design elements, and includes a discussion of the anticipated operational model of the facility that will enable partners to conduct vast spectroscopic surveys of the Universe (Section 2.4).
2.1. The Science Case: Exploring the Composition and Dynamics of the Faint Universe
MSE will unveil the composition and dynamics of the faint Universe and is designed to excel at precision studies of faint astrophysical phenomena that are beyond the reach of 4-m class spectroscopic instruments. It will be the premier astronomical facility for understanding the nature and evolution of matter in the Universe, whether that mass is baryonic or in the dark sector. It will trace the astrophysical emergence of the periodic table of the elements over cosmic time and determine the allowed properties of the dark matter particle, through a suite of
coordinated observations of dynamical probes across all mass scales.
The science case for MSE is described at length in “The Detailed Science for the Maunakea Spectroscopic Explorer” (DSC, May 2015).4 The impacts of MSE will be felt across astrophysics
including characterization of exoplanetary hosts; in-situ chemical tagging of thick disk and halo stars; tomographic mapping of the interstellar and intergalactic media; linking of galaxies to the large-scale structure of the Universe (Figure 2); the growth of supermassive black holes over cosmic time; exploration of the variable Universe in the era of multi-messenger astronomy; and next generation cosmological surveys probing the nature of dark energy. The wealth of science areas impacted by MSE will ensure its lasting legacy and the data produced will provide a rich repository for exploration and discovery. In the following sections, we will highlight some headline science connected with MSE, but the reader is referred to the DSC for a comprehensive description of all the major science topics driving the design of the facility.
Figure 2: Left panel: Cone plot showing an illustrative MSE survey, in comparison with other notable benchmark galaxy surveys. Cones are truncated at the redshift at which L* galaxies are no longer visible. Right panels: Lookback time versus cosmic star formation rate (right axis) using the parameterization of Hopkins & Beacom (ApJ 2006: 651, 142). Grey lines indicate the wavelength of OII 3727Å. Also
indicated on this wavelength scale is the wavelength coverage of the major highly multiplexed
spectrographs in development. These are offset according to their system’s étendue (left axis). The light cone demonstrates the range of MSE for extragalactic surveys, using a homogeneous set of tracers at all redshifts.
MSE and the emergence of the periodic table of the elements
Understanding when, where, and how the chemical elements were created remains one of the grand unanswered questions in astronomy, and is a primary motivation for building MSE. Some 13.8 billion years ago, the Big Bang produced all the hydrogen and most of the helium in the Universe, as well as trace amounts of lithium. All the other chemical elements—the oxygen that we breathe, the calcium in our bones, and the iron in our blood—were forged in stars. While the nuclear processes governing the production of the elements and isotopes from helium to uranium are generally understood, the astrophysical locations and details of the stellar nucleosynthesis continue to be debated.
Figure 3: Main panel shows the relative flux of a synthetic spectrum of a metal-poor red giant star at the moderate MSE spectral resolution of R~6000, along with some of the strong-line stellar diagnostics accessible at this resolution. Highlighted regions show the normalized flux in three windows, observable with the high-resolution mode of MSE. A magnified region of the UV window shows examples of the species that will be identified at high resolution. MSE chemical tagging surveys will identify species by sampling a large and diverse set of nucleosynthetic pathways and processes.
Chemical elements and their formation sites, along with stellar evolution timescales, provide a useful diagnostic tool which acts as a chronometer, allowing us to study the milestones of galaxy formation and the origin of the solar system’s chemical abundances. For example, the recent detections of a gravitational wave signal from a neutron star merger and an associated short gamma ray burst (sGRB) have provided possible clues to the solution of the pertinent problem of the production sites of the “rapid neutron capture” (r-)process elements. Though neutron star mergers can produce robust r-process synthesis all the way up to the heaviest elements, such as uranium and thorium, they still fail to adequately explain the observed chemical evolution trends. The presence of abundant r-process elements at low metallicities requires a short merging time, which is not easily compatible with sGRB timescales, or with the r-process trends observed at higher metallicities. There are also some indications of an intermediate neutron-capture process, operating at timescales between the r-process and the “slow neutron capture” (s-) process. The production of neutron-capture elements through an intermediate process provides a more coherent explanation of the origin of some stars (CEMP-r+s stars).
MSE will chart the evolution of the chemical elements over cosmic time. The most chemically ancient stars in the Galactic halo and surrounding ultra-faint dwarf galaxies are of particular importance in understanding the formation of the elements in earliest times. These objects are relics that date back to the epoch of reionization and provide remarkable laboratories that permit us to explore the chemical and physical conditions of the earliest star-forming environments in the Universe, and the very first metal-enrichment events. While these ancient objects are
incredibly valuable (they are fossils that preserve the signatures of the first generations of stars), they are also incredibly rare.
MSE has an unparalleled competitive advantage in its ability to reveal the origin of the chemical elements. It is imperative to identify chemical species, which trace a variety of nucleosynthetic pathways. Many chemical species—including some unique tracers—have signatures in the
blue/near-UV region of the spectrum, and here MSE has very high (R40K) spectral resolution and good throughput (in part due to its large aperture). These capabilities are essential to the detection of potentially very weak lines, in areas of the spectrum that are rich in other features (see Figure 3). Enormous multiplexing is required to build statistical datasets, from which the clustering of stars in chemical space can be mapped. From these datasets, the rarest of all stars— those that are chemically ancient—can be identified and forensically analyzed in significant numbers. Through these studies, MSE will reveal the epochs and timescales associated with the formation of the different nucleosynthetic groups, thus enabling transformative progress in mapping the emergence of the periodic table of the elements.
MSE and astrophysical probes of dark matter
Figure 4: Recovery of line-of-sight velocity dispersion (left) and dark matter density (right) profiles as a function of stellar spectroscopic sample size for dwarf galaxies, demonstrating the need for extensive datasets with MSE. Shaded regions represent 95% credible intervals from a standard analysis of mock data sets consisting of radial velocities for N=102, 103, and 104 stars (median velocity errors of 2km/s), generated from an equilibrium dynamical model for which true profiles are known (thick black lines).
Astronomical observations have provided overwhelming evidence that about 80% of the matter density in the Universe takes the form of “dark matter,” yet dedicated searches for a dark matter particle in the laboratory, in space, and at colliders have yielded no results thus far. MSE will become the premier astronomical facility to advance the decades-old quest for the dark matter particle.
While it is still possible to find viable dark matter candidates in supersymmetric extensions of the Standard Model, the theories have widened, to include models in which dark and normal matter are present in different sectors, which are very weakly coupled to each other. Many
possibilities concerning “hidden sector” dark matter, both thermally and non-thermally produced, are currently being investigated. Many of these theories can be tested in the lab: using, for
example, models in which the dark matter is produced through its couplings to normal matter. MSE, however, will be essential for the large swathes of parameter space that can only be observed using astrophysical probes.
Analogous to Standard Model particles, dark matter in hidden sectors can be light (e.g., warm or fuzzy dark matter) or have large self-interaction cross sections (such as hydrogen self-scattering or proton-neutron scattering) including energy loss mechanisms (inelastic scattering). These fundamental properties of the dark matter particle can only be verified using astrophysical probes, through their influence on structure formation at small scales. The key astrophysical probes are the densities of dark matter halos in the central regions of halos (roughly 1–10% of the virial radius) and the properties of the satellites of massive halos (such as the satellites of the Milky Way). Collectively, these probes are often labeled “small-scale structures,” and can be accessed by MSE via precision measurements of the radial velocities of large numbers of tracer particles: stars, star clusters, and galaxies.
Recent computing advances have led to a better understanding of the impact of stellar feedback on the structure of galaxies, including their dark matter content. Many groups have found that feedback can change dark matter distribution dramatically. For example, two major
collaborations (NIHAO and FIRE) with separate codes have found that the dark matter density profile gets shallower with feedback at about one percent of the virial radius. At the same time, there has been progress in pinning down the dark matter content of galaxies in the Local Group and of more massive field galaxies.
There have been concurrent advances in understanding the predictions of self-interacting, warm, and fuzzy dark matter. We now possess modern hydrodynamic codes that track the
self-interactions and pressure for fuzzy dark matter in a full cosmological setting. Based on the advances made possible by these simulations, we know that large self-interactions provide an effective way to understand not only the cores of dwarfs and low surface brightness galaxies, but also the lack of evidence for them in high surface brightness galaxies. Taken together, these developments bode well for the settlement of a debate that has been raging for over two decades: what do these small-scale structure puzzles tell us about the nature of dark matter?
A suite of MSE dark matter surveys will provide decisive measurements, vital to pinning down the nature of the dark matter particle. For example, MSE will allow us to obtain a deeper
kinematic census of the satellites in the local volume, test various proposed solutions to the “too-big-to-fail problem,” and help quantify the prevalence of the planes of satellites, which has important implications for dark matter models. Measurements using MSE will also have
important consequences for self-interacting dark matter models. These models transport kinetic energy within halos and alter the dark matter density profiles. In low mass galaxies (such as the Local Group dwarf spheroidal galaxies) this leads to constant density cores, which will be tested using the large data sets of resolved stellar velocities that only MSE can provide (see Figure 4). MSE will also provide critical data on fuzzy dark matter. Fuzzy dark matter changes the power spectrum and introduces a cut-off in halo formation below a mass scale determined by the dark matter particle mass. This can be tested through substructure detections (resolved and flux-ratio anomalies), using strong lensing or gaps in stellar streams. MSE will be essential in selecting systems (streams and lenses) and in obtaining the requisite kinematic data that can be used to place constraints on the dark matter model spaces. Perhaps most excitingly, we expect to be able to attain new levels of precision, by combining radial velocity surveys using MSE and precision astrometric studies using the Extremely Large Telescope (ELT), the Thirty Meter Telescope
(TMT), or the Giant Magellan Telescope (GMT), to provide the ultimate dynamic analyses of dark matter halos. Directly or in conjunction with 30-m class telescopes, MSE will decisively test the idea that dark matter is cold and collisionless.
2.2. Science Opportunities: MSE as Part of the Facility Landscape
Figure 5: Some of the most notable next generation facilities that, together with MSE, will help define the international network of astronomical facilities operational beyond the 2020s.5
Astronomy has recently entered the multi-wavelength realm of big facilities. Figure 5 shows some of the most notable new observatories. Collectively, these facilities represent many billions of dollars in investment and many decades of development, by large teams from the international community. Some of these facilities are already hosting scientific exploration: allowing
researchers to probe questions as diverse and fundamental as the origin of life and the
composition of our universe. The second data release from Gaia is already having an impact on almost all areas of astronomy; the Large Synoptic Survey Telescope (LSST) is being built; and the VLOTs are entering the construction phase. These are no longer next generation scientific ambitions; instead, they are at the cutting edge of what is happening now.
Each of these facilities hosts well-defined, standalone scientific projects. Recent history has demonstrated that combining data from multiple facilities will be key to major advances.
5 Artist’s conception of the multi-antenna ngVLA, courtesy of NRAO; Gaia image credit: ESA–D (Ducros, 2013); the
Square Kilometer Array image credit: SKA Organisation; Euclid artist’s impression, based on CAD drawings provided by Thales Alenia Space, Italy; and Airbus (Defence and Space), France © ESA; the Large Synoptic Survey Telescope, image credit: Todd Mason, Mason Productions Inc./LSST Corporation.
Examining this network of astronomical facilities inevitably prompts the question of whether any critical capabilities are still missing?
Multiple international groups have asked this question over the past decade, and all have concluded that the vital piece of equipment needed is a dedicated, large-aperture, multi-object spectroscopic facility. In Canada, the Long Range Plan 2010i notes that a 10-m class telescope, equipped with an extremely multiplexed spectrograph, “would be a unique resource for follow-up spectroscopy, both for the European Gaia satellite mission, and also for LSST and
Euclid/WFIRST”. The Australian Astronomy Decadal Plan 2016–25ii details the ways in which a dedicated, wide-field spectroscopic facility, integrated into a large telescope, would “provide follow-up spectra of objects identified by the SKA and imaging telescopes like the US-led Large Synoptic Survey Telescope.” In Europe, the ESO science program for the 2020s has identified highly multiplexed spectroscopy as a priority, identifying this as an area which merits strong backing from their community, due to its broad importance for a vast range of science projects.iii An ESO Working Groupiv commissioned to study the potential of wide-field MOS has
concluded that “such a facility could enable transformational progress in several broad areas of astrophysics, and may constitute an unmatched ESO capability for decades,” and has conducted a science feasibility study. In the US, in response to the National Research Council report, “Optimizing the U.S. Optical and Infrared System in the Era of LSST,” NOAO and LSST convened study groups whose top recommendation was that the US community “develop or obtain access to a highly multiplexed, wide-field, optical, multi-object spectroscopic capability on an 8-m class telescope, preferably in the Southern Hemisphere.”
MSE is a response to the internationally recognized need for highly multiplexed, deep, optical and near-infrared spectroscopy of the faint Universe. The apparent consensus of scientific opinion regarding the strategic importance of the capabilities offered by MSE is a natural conclusion, based on the capabilities and expected science outcomes of the currently anticipated facilities. The strategic importance of MSE within the international network of astronomical facilities cannot be overstated, as a brief survey of these facilities demonstrates:
1. Ground-based, wide-field imaging: There has been a long and successful history of exploiting synergies between optical and infrared imaging and spectroscopic surveys. Complete, deep, optical imaging of the sky in a range of filters will soon be available, through a combination of survey programs, including PanSTARRS, SkyMapper,
Subaru/HyperSuprimeCam, CFHT/Canada–France Imaging Survey, Blanco/Dark Energy Camera and, most notably, LSST. The capabilities of MSE are highly desirable, as they enhance the discovery potential of both LSST and the other surveys named.
2. Deep, near-infrared, space-based, wide-field imaging: Just as with ground-based imaging, researchers have successfully established the benefits of combining space-based imaging and wide-field spectroscopy. Over the next decade, Euclid and WFIRST will provide extremely deep, high-spatial resolution imaging (~0.2˝), mostly in the near-infrared, over vast areas of sky. The combination of Euclid/WFIRST imaging with photometric redshifts (LSST) and MSE can be expected to provide a complete blueprint of galaxy evolution from the present epoch to the peak of the cosmic star-formation era. 3. Precision astrometry and photometry: Gaia is a landmark astrometric space mission,
which is cataloging all astronomical point sources brighter than V ~20 mag: around 1 billion objects (1% of the stellar mass of the Milky Way). Gaia is obtaining multi-band
photometry for all sources, and observing the spectra of the brightest stars. The need for ground-based spectroscopy to supplement the Gaia data is well established. Using MSE to obtain the high resolution spectroscopy of millions of stars across Gaia’s entire luminosity range will provide precise (sub-km/s) radial velocities and chemical abundance information that cannot be obtained by other means.
4. Multi-wavelength astronomy: The Square Kilometer Array (SKA) and, potentially, the next generation Very Large Array (ngVLA), will revolutionize astronomy at radio wavelengths. The use of optical spectroscopy is crucial, to maximize the scientific output of these radio facilities. The sensitivity challenge involved is extreme: matching SKA1 detection thresholds requires optical data extending to r ~24v. MSE will meet this
sensitivity challenge and will have a survey speed that allows for the construction of large statistical datasets, which can be combined with the vast radio datasets that SKA and ngVLA will produce.
5. Multi-messenger astronomy and the time domain: Large, dedicated, spectroscopic facilities have a clear role to play as scientific attention increasingly turns to the time domain. MSE will provide a particularly powerful tool for the follow-up of slow and faint transients, and the characterization of the host galaxies of extragalactic explosive
transients (both pre- and post-explosion). Perhaps most excitingly, however, the first detection of gravitational waves—by LIGO, in February 2016—promises to provide a fundamentally new way of exploring the Universe, to which MSE will contribute, as the premier large-aperture spectroscopic facility.
6. Finding the needles and diamonds in the haystack: The TMT, ELT, and GMT will become the premier optical/infrared facilities for detailed, high spatial resolution views of the faintest astronomical targets. Since they possess fields of view in the order of a few arcminutes, target identification will require a coordinated suite of supporting facilities, to ensure these cutting-edge facilities maximize their scientific impact. MSE will occupy an important role as the essential link—efficiently narrowing the billions of potential targets identified by these wide-field photometric surveys down to the much smaller number of targets that will be followed up by the VLOTs.
2.3. Science Capabilities
2.3.1. From Science to Requirements
The Detailed Science Case makes extensive reference to Science Reference Observations, presented in the appendices to the DSC. These have been defined by the international Science Team as specific, detailed, scientific programs for MSE, which are transformative of their fields and only possible with MSE. The SROs were selected to span the range of anticipated fields to which MSE is expected to contribute. The Science Requirements for MSE—i.e., the highest-level design requirements for the facility—are defined as the suite of capabilities necessary for MSE to carry out these observations. These capabilities are extensive and cannot be found in combination in any other facility. They will ensure that MSE remains at the cutting edge of astronomical capabilities in the 2020s and beyond, even as the scientific opportunities change in ways that cannot be predicted.
Table 2: Cross-references between Science Reference Observations (in the columns) and Science Requirements (grouped in rows). Blue borders indicate that the SRO is used in the derivation of the requirement; blue boxes indicate that the requirement is highly relevant; grey boxes indicate that the requirement has some relevance to the SRO.
Table 2 shows the cross-references between each SRO and each of the high-level MSE science requirements. The science requirements are outlined and discussed in detail in the MSE Science Requirements Document.vi
2.3.2. Key Capabilities
Table 1 summarizes the scientific capabilities of MSE. The telescope will have an 11.25 m segmented primary mirror and a 1.52 sq. degree field of view. Three different spectral resolution settings are possible. At the lowest resolution, 3,249 spectra, spanning the entire optical spectrum in the J-band, can be obtained in a single pointing. At moderate resolution, the same number of spectra can be obtained for approximately half the optical waveband and for the full H-band. The low and moderate resolutions are provided by the same spectrograph system (six identical
spectrographs, with four channels each), and each channel can switch settings independently. At the highest resolution, 1,083 spectra will be obtained per pointing for three windows in the optical region of the spectrum. At all resolutions, MSE can encompass the faintest targets, and will remain well calibrated and stable over its lifetime. Located at the equatorial site of
Maunakea (ℓ = 19.9°), MSE will access the entire northern hemisphere and half of the southern sky, making it an ideal follow-up and feeder facility for a large number of both existing and planned ground- and space-based facilities.
(1) Key Capability 1: Survey Speed and Sensitivity
MSE must have a high survey speed. This is a function of sensitivity, field of view, multiplexing, and observing efficiency. Many of the surveys MSE is expected to undertake cover large areas of sky. MSE therefore has a 1.52 square degree field of view, hexagonal for ease of tessellation, which will provide an observing efficiency of 80%, defined as the fraction of night time spent collecting science photons (excluding losses due to weather). This will make it one of the most efficient optical observatories in the world.
MSE must have a large aperture, to provide sufficient sensitivity to follow up faint sources identified by imaging surveys conducted by large-aperture telescopes, such as LSST. As a filtering facility for the VLOTs, MSE must also provide excellent sensitivity to faint sources, which can then be followed up using higher spatial resolution (e.g., Integral Field Units), higher spectral resolution, and/or higher signal-to-noise (SNR) by these giant facilities. At a low spectral resolution, MSE will obtain an SNR per resolution element of two for magnitude 24 sources at all wavelengths (point sources, monochromatic AB magnitude; i.e., the approximate depth of a single LSST visit) over the course of an hour-long observation. At high spectral resolution, MSE will obtain an SNR per resolution element of 10 for magnitude 20 sources at all wavelengths (point sources, monochromatic magnitude; i.e., covering the full luminosity range of Gaia sources) over the course of an hour-long observation.
(2) Key Capability 2: Spectral Performance and Multiplexing
A range of spectral resolutions and wavelengths, from UV, through optical, to NIR, are needed to enable a diverse range of scientific investigations. The multiplexing requirements of each mode are determined by a consideration of the expected target densities. The source density of
galaxies at z < 0.2 brighter than i = 23 is 2,100/sq. degree (or ~3,200/1.5 sq. degree), which determines the minimum multiplexing for the low and moderate spectral resolution modes (the density of even fainter sources makes it desirable to achieve a value as close to 1 fiber per square arcminute as possible, but technical limitations make it difficult to reach that goal). The source density of thick disk and halo stars at high Galactic latitudes in the critical magnitude range for MSE of 17 < g < 21 is ~700 per sq. degree or ~1000 per 1.5 sq. degree, which determines the minimum multiplexing for the high spectral resolution mode.
MSE is also being designed to incorporate multi-object Integral Field Units after first light. We anticipate that these will feed the low/moderate spectrograph suite, which will be achieved by switching the fiber positioning and fiber transmission systems.
The wavelength coverage in each mode is determined by the consideration of primary scientific goals. As part of its low/moderate spectral resolution studies, MSE will probe aspects of galaxy evolution in the distant Universe. Sensitivity out to and including H-band ensures that galaxies and AGN can be studied, using the same set of tracers from z = 0, to beyond the peak of the star formation history of the Universe. As part of its high spectral resolution studies, a large number of critical nucleosynthetic tracers need to be accessed at blue/UV wavelengths. Many of these features are weak and in crowded spectral regions, which requires a spectral resolution of R>20K.
(3) Key Capability 3: Dedicated and Specialized Operations
MSE is specialized for one task: the efficient acquisition of multi-object spectra. This basic operation philosophy enables the production of stable, high quality data, which is much more difficult to achieve for observatories, in which instruments move on and off the telescope at regular intervals. This allows MSE to address science cases that are very difficult to address using other MOS instruments (for example, time-resolved, high-resolution spectroscopy and quasar reverberation mapping).
The impressive power that a large, homogeneous and well characterized dataset can offer has been most successfully demonstrated by the Sloan Digital Sky Survey (SDSS). A search of NASA ADSvii for refereed publications mentioning SDSS in their abstracts returns over 8,600 publications, with more than 436,000 citations.6 The success of SDSS comes despite the fact that it is a relatively small-aperture facility by modern standards, located at a site that cannot compete with Maunakea in terms of median image quality. However, a large part of its success can be traced to the extremely well calibrated and well characterized nature of the data. MSE can be viewed as an evolution of the SDSS concept, using a telescope with a collecting area around twenty times larger, situated at arguably the best optical astronomical site on the planet. The fiber-positioning technology chosen by MSE ensures that all spectrographs are available at all times, so every MSE observation will use all 4,332 fibers. High spectral resolution
observations of (relatively) bright targets will be prioritized during bright times, and low-resolution observations of fainter, extragalactic targets will be prioritized during dark times. Assuming a (conservative) baseline exposure of one hour per field, with eight hours per night available for observations (10.2 hours before weather losses), then MSE will observe around one
million astronomical spectra every month: the equivalent of a SDSS Legacy Survey—1,640,960 spectra—every eight weeks.
2.3.3. MSE Compared with Other Multi-object Spectrographs
Table 3: Summary of new optical and infrared multi-object spectroscopic instruments and facilities.
Table 3 compares the core capabilities of a large number of MOS instruments and facilities, including all those that are at advanced stages of design, many of which will be operating on timescales that overlap with MSE. The ESO spectroscopic telescope conceptviii is not listed in these tables, since only a feasibility study has been conducted and detailed technical
specifications are not yet available.
Table 4 lists only those facilities from Table 3 that have comparable sensitivity to MSE (i.e., 8– 10 m class facilities).