Publisher’s version / Version de l'éditeur:
Vous avez des questions? Nous pouvons vous aider. Pour communiquer directement avec un auteur, consultez la première page de la revue dans laquelle son article a été publié afin de trouver ses coordonnées. Si vous n’arrivez pas à les repérer, communiquez avec nous à [email protected].
Questions? Contact the NRC Publications Archive team at
[email protected]. If you wish to email the authors directly, please see the first page of the publication for their contact information.
https://publications-cnrc.canada.ca/fra/droits
L’accès à ce site Web et l’utilisation de son contenu sont assujettis aux conditions présentées dans le site
LISEZ CES CONDITIONS ATTENTIVEMENT AVANT D’UTILISER CE SITE WEB.
Internal Report (National Research Council of Canada. Institute for Research in
Construction), 2002-01-01
READ THESE TERMS AND CONDITIONS CAREFULLY BEFORE USING THIS WEBSITE. https://nrc-publications.canada.ca/eng/copyright
NRC Publications Archive Record / Notice des Archives des publications du CNRC :
https://nrc-publications.canada.ca/eng/view/object/?id=4eff3b1b-1c86-467f-9f2b-27c2f7a7dba2
https://publications-cnrc.canada.ca/fra/voir/objet/?id=4eff3b1b-1c86-467f-9f2b-27c2f7a7dba2
NRC Publications Archive
Archives des publications du CNRC
For the publisher’s version, please access the DOI link below./ Pour consulter la version de l’éditeur, utilisez le lien DOI ci-dessous.
https://doi.org/10.4224/20386451
Access and use of this website and the material on it are subject to the Terms and Conditions set forth at
Measurements of sound propagation in open offices
National Research Council Canada
Conseil national de recherches Canada
Measurements of Sound
Propagation in Open Offices
by
W.T. Chu
&
A.C.C. Warnock
IRC Internal Report IR-836
January 2002
INTRODUCTION
INTRODUCTION
This report presents measurements of sound attenuation between work positions made in nine open offices in the Ottawa/Hull Area on behalf of Public Works and Government Services Canada
(PWGSC). It is one of three. A companion report1 presents
measurements of voice levels made in the same offices. Background information on open office acoustics can be found in the third report.2 Sound attenuation was measured by positioning a sound source in a work station and measuring the sound levels received at adjacent workstations. Privacy was estimated in each case by calculating Speech Intelligibility Indices using a standard voice spectrum and a standard background noise spectrum.
The report describes the measurement and calculation procedures and presents summary measurements for all of the nine sites. Later sections of the report present data for each site individually.
The measurement team comprised Keith Lay, Brian Fitzpatrick, Scott Norcross, Wing Chu and Alf Warnock of the Institute for Research in Construction, National Research Council of Canada (NRC).
BACKGROUND
BACKGROUND
In the absence of any barriers to sound propagation, sound in an open office travels directly from speakers to listeners. The
attenuation that occurs is due to the spreading of the energy over an expanding surface as the sound propagates away from the source. This leads to an attenuation of 6 dB for each doubling of the distance from the source. In addition to this direct path, sound may reflect from the ceiling, the floor, and vertical surfaces. With materials normally found in offices, each reflection results in some loss of energy but the net effect of these reflections is to reduce the attenuation between source and receiver. In furnished open offices, sound usually decreases about 4 to 5 dB for each doubling of the distance from the source.
When there is a barrier between occupants, sound must bend around the barrier (diffraction) to reach listener locations on the other side. The attenuation during this diffraction process depends on the angle through which the sound has to bend — the greater the angle, the greater the attenuation. Thus higher and wider barriers give more attenuation (It should not be forgotten that diffraction occurs at vertical edges of barriers too).
In offices, the degree of speech privacy attained is determined by the loudness or level of the intruding voice and the level of the
background sound at the receiving position. Obviously the noisier the background or the fainter the intruding speech, the more difficult it is to understand what is being said.
BACKGROUND
detailed procedure for calculating the Speech Intelligibility Index (SII). The index ranges from 0 to 1, with 0 indicating complete privacy and 1 indicating perfect listening conditions.
The values of SII delimiting "confidential" and "normal privacy" are given in the following table. These values are rather approximate. They are not supported by extensive research and do not necessarily indicate occupant satisfaction in an open office.
Privacy rating SII
Normal
some meaning can be extracted from the overheard speech but by not focussing on the speech, concentration is not unduly disturbed
< 0.2
Confidential speech sounds may be heard
but no meaning can be extracted < 0.1
To ease comparison among the sites, SII values have been
calculated for each measurement position using the same voice and background noise level. Details are given later in the report.
Further discussion of the acoustics in open offices can be found in the guide produced for this project2.
MEASUREMENT PROCEDURES
MEASUREMENT PROCEDURES
Sound Sources
The source of sound for most of the measurements was a Dummy Head* incorporating a small loudspeaker. This was placed in different orientations in the workstations: in normal working position facing the computer monitor or facing the cluster of five receiving microphones in adjoining workstations. Sound pressure levels measured at the five microphones at the listening position were averaged. The figure here shows the equipment positioned for a measurement.
Figure 1 : Dummy Head and receiving microphone array in position for a measurement between work stations.
In some instances a second source was used. This was a B&K omnidirectional source that satisfies the requirements of ASTM E1179 4. The long axis of the source was positioned as shown in Figure 2 below, so it pointed up at an angle of 25 degrees to the horizontal as specified in ASTM 1130 6. The omnidirectional source was not used when there was no intervening barrier.
Measurements made in accord with ASTM E1130 provide worst case estimates of privacy. The source is always pointed directly at the listener position. In team-style offices where orientation of the worker is important, it is more appropriate to use a dummy head positioned as a human head would be. The values presented in this report were obtained using the dummy head.
MEASUREMENT PROCEDURES
Figure 2: Bruel and Kjaer omnidirectional source.
Receiving microphone array
ASTM 1130 specifies the use of an array of four microphones for measuring the levels at the listener position. A microphone stand was modified as shown here to support four microphones as specified in that standard and a fifth microphone at the mid-point of the array. The intent was to determine if there were significant differences among these microphones. Clearly much time would be saved if only the central microphone were used. The data obtained will be
analysed and passed to the appropriate ASTM subcommittee. Any differences among the microphones are not relevant for this project since multiple microphones were actually used. Microphone signals were recorded on a digital tape recorder and analysed later in the laboratory.
MEASUREMENT PROCEDURES
Calculation of Speech Intelligibility Index
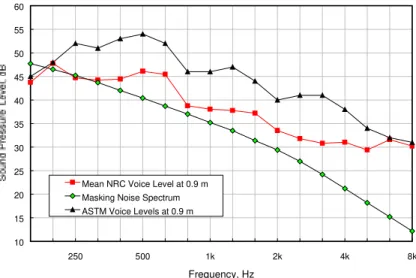
In a given frequency band, the difference between the sound level measured at the receiving microphones and the level 0.9 m from the mouth of the Dummy Head is the attenuation for the work station. Attenuations were measured in one-third octave band frequencies from 160 to 8000 hertz. The attenuations were used to calculate values of Speech Intelligibility Index 5 for each measurement. To allow a consistent comparison among the sites, the same voice level and background noise level were assumed in each case. The voice level used was the average determined by NRC from measurements at each office location 1. The levels are lower than those given in ASTM E1130 6 or ANSI S3.5 5 for a normal voice: 50.2, 57.5 and 59.2 dBA respectively. The spectrum of mean voice level measured on site and the ASTM voice spectrum are shown in Figure 3. The background noise contour assumed is also shown in the figure. It is one recommended for use in open offices and has an A-weighted level of 46.6 dBA. 10 15 20 25 30 35 40 45 50 55 60 250 500 1k 2k 4k 8k Frequency, Hz
Mean NRC Voice Level at 0.9 m Masking Noise Spectrum ASTM Voice Levels at 0.9 m
Figure 3: Measured average voice levels, ASTM E1130 levels and masking noise spectrum assumed in calculations of SII.
Relationship between Articulation Index and Speech Intelligibility Index
With the same voice, attenuations and background noise levels, the Articulation Index (AI) was calculated using the weighting factors in
MEASUREMENT PROCEDURES
their numerical values differ. The relationship found from this set of data is
SII = 1.03 *AI + 0.06, r2 = 0.997.
Value of Speech Intelligibility Index for acceptable speech privacy
The values of AI usually given as delimiting confidential and normal privacy are 0.05 and 0.15 respectively. Corresponding values of SII are therefore 0.1 and 0.2. "Confidential" privacy means that speech sounds may be heard but no meaning can be extracted. "Normal" or "acceptable" privacy usually means that some meaning can be extracted from the overheard speech but by not focussing on the speech, concentration is not unduly disturbed. These values are rather approximate. They are not supported by extensive research and do not necessarily indicate occupant satisfaction in an open office. Other psychological factors play a role in determining satisfaction.
Omni Source versus Head Source.
For the cases where the dummy head and the Omni source were both used, the relationship between the values of SII calculated is shown in Figure 4. There is good correlation between the two values and the Omni rating is higher in almost all cases.
SIIomni = 0.9 SIIHead + 0.072
R2 = 0.93 0.0 0.1 0.2 0.3 0.4 0.5 0.6 0.7 0.0 0.1 0.2 0.3 0.4 0.5 0.6 0.7
SII Head source
SII Om n i s o u rc e
Figure 4: Relationship between SII from Omni source and that from the dummy head.
SUMMARY
SUMMARY
A total of 148 measurements with the dummy head were made at the nine sites. The calculated values of SII using the NRC voice levels and the ASTM voice levels have been plotted as histograms in Figure 5. These values are also plotted in a cumulative percentage plot in Figure 6. 0 5 10 15 20 25 30 35 SII NRC voice ASTM voice
Figure 5: Number of cases in each SII category. The value of SII on the horizontal axis is the mid-point of the range.
0 20 40 60 80 100 SII NRC voice ASTM voice
Figure 6: Cumulative percentage plot of SII for all measurements.
SUMMARY
The cumulative plot in Figure 6 allows one to more easily make quantitative statements. About 50% of the calculated SII values for the NRC voice are less than 0.2, the approximate upper limit for "normal" privacy. For the ASTM voice, only about 10% of the values are below 0.2, the limit for normal privacy. It is very clear that
inducing occupants to use low voice levels can have a large effect on speech privacy.
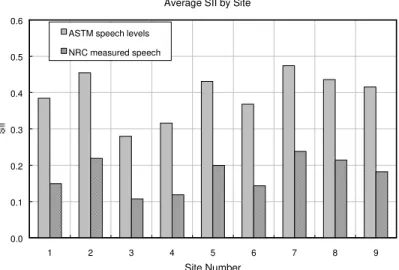
The measured speech levels used were obtained when the subjects were speaking to an interviewer sitting less than 1 metre away. The voice levels are not appropriate for conversations with co-workers at distances of 3 or 4 metres. It is thought that average voice levels used during telephone conversations are not likely to be very different from those measured in this project but further measurements would be needed to verify this assumption. To illustrate the effect of increased voice level, Figure 7 shows the mean SII for each site for the ASTM "normal" voice level and for the NRC measured voice level.
Average SII by Site
0.0 0.1 0.2 0.3 0.4 0.5 0.6 1 2 3 4 5 6 7 8 9 Site Number
ASTM speech levels
NRC measured speech
Figure 7: Average SII measured at each site for two voice levels: the ASTM "normal" voice level and the NRC measured voice level.
The distance between the talker and the listener and the height of any barrier between them are important factors. They are dealt with in the next sections of this summary.
SUMMARY
SII versus distance between source and microphones
The measurements conveniently fell into three categories: No barriers or height less than 1.3 m. (When the barrier is not
much greater than seated head height, it has little effect.) Barriers with heights between 1.3 and 1.4 m.
Barriers with heights greater than 1.5 m. (There were no barriers with heights between 1.4 and 1.5 m).
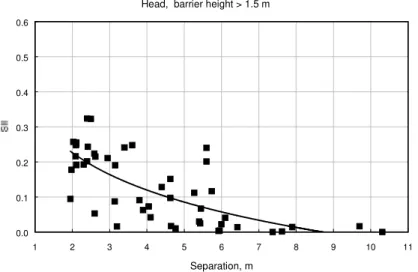
The data are plotted in the following three figures. The solid line in each plot is a logarithmic fit to the data. These lines show that, on average, higher barriers give better speech privacy as expected. The plots also show a wide range in SII around the fitted lines. Several factors account for this scatter:
The presence of vertical reflecting surfaces such as windows, filing cabinets, computer screens and even barriers that are not sufficiently sound-absorbing.
Variations in reflection from the ceiling due perhaps to light fixtures.
Changes in orientation of the dummy head.
Bookshelves and cupboards attached to the barriers force the sound to bend more and so increase the attenuation due to diffraction. They also act as reflecting surfaces, especially when fitted with a hard metal door.
SUMMARY
Head, barrier height <1.3 m
0.0 0.1 0.2 0.3 0.4 0.5 0.6 1 2 3 4 5 6 7 8 9 10 11 Separation, m
Figure 8: SII versus separation for no barrier or barrier less than 1.3 m high.
Head, 1.3 < barrier height <1.4 m
0.0 0.1 0.2 0.3 0.4 0.5 0.6 1 2 3 4 5 6 7 8 9 10 11 Separation, m
Figure 9: SII versus separation for barrier height between 1.3 m and 1.4 m.
SUMMARY
Head, barrier height > 1.5 m
0.0 0.1 0.2 0.3 0.4 0.5 0.6 1 2 3 4 5 6 7 8 9 10 11 Separation, m
Figure 10: SII versus separation for barriers greater than 1.5 m high.
Effects of Head Orientation
Human talkers do not radiate speech uniformly in all directions. More sound energy is radiated forward than to the rear. Thus it is easier to understand speech when the speaker faces the listener than when the speaker is turned away.
In an anechoic space, levels directly behind the speaker are about 10 dB below those measured directly in front; levels to the side are about 5 dB below the frontal levels. The corresponding reductions in SII are about 0.3 and 0.15 respectively.
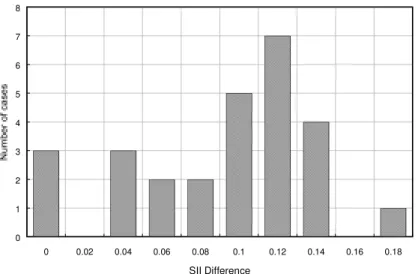
In a real office, reflections from various surfaces will reduce the effect of turning away. During the project, 27 cases were measured with the dummy head in the normal work orientation and pointing directly at the listener position. The rotations from the normal work position to pointing directly at the listener varied considerably. Figure 11 is a histogram showing the differences in SII. The distribution is skewed. There is a pronounced peak around 0.12 but the mean is 0.08. No measured difference was as great as 0.3. It is probable that had the barriers and other surfaces in the offices been more
SUMMARY 0 1 2 3 4 5 6 7 8 0 0.02 0.04 0.06 0.08 0.1 0.12 0.14 0.16 0.18 SII Difference
Figure 11: Differences in SII caused by turning the dummy head from the normal work orientation to point directly at the listening position.
COMMENTS
COMMENTS
Adopting SII 0.2 as a criterion for privacy and assuming voice levels measured in the offices are normally used for all
communications, one can say that about 50% of the occupants of these offices have acceptable speech privacy, if all conversations use the same level measured during the project. Observations of the employees during the project suggest strongly that this will not be the case.
If voice levels are only a few decibels greater than the NRC measured levels, then the percentage of occupants having acceptable speech privacy is greatly reduced.
Too many of the offices visited had hard reflecting surfaces. The large variations in calculated SII for apparently similar
situations are an indication of the great complexity of the situation. The variations are attributed to paths other than that over the barrier and the reflection from the ceiling. No attempt was made to identify all the possible sound paths during the measurements. Even had they been identified, at present there is no way to model the sound-reflective properties of the surfaces.
Changes by the occupants to the workstation layout or to the normal working positions can seriously degrade speech privacy, if the original design was intended to provide speech privacy. Such changes should be discouraged.
None of the offices had highly absorbing ceilings. Low values of SII do not necessarily guarantee occupant
satisfaction in an open office. There are many social and psychological factors that influence office occupants. The degree of disturbance caused by intruding speech will
depend on the personality of the listener and the type of work being done. Work that requires concentration and freedom from distraction may not fit well into an open office environment unless the occupants can be induced to behave in non-distracting ways.
FUTURE WORK
FUTURE WORK
The following information is needed for the development of accurate computer models. If a computer model is to be successful, then the work needs to be done as part of this research project.
Human talker directionality. While there is some information
about the distribution of sound around a human talker, it is not sufficiently precise. Work has already begun to make more detailed measurements of these sound fields.
Refinement of barrier diffraction equations. The original data from Maekawa7 shows significant scatter. It is known that sound-absorbing material on the surface of a barrier changes the attenuation. Many of the barriers in real offices are very thick since they double as bookcases or bookshelves. Thus, some measurements need to be made to verify that the Maekawa equations work in typical open offices. ASTM E13758 gives a method for rating the sound attenuation provided by a barrier for use in an open office. Some measurements with typical barriers would allow the ratings from this test method to be related to physical factors such as height and the absorption on the surface of the barrier.
Contributions from workstation surfaces. Changes in sound
attenuation due to reflections from different surfaces need to be measured. The idea is to gradually add surfaces to a workstation and measure the changes in attenuation. Surfaces would include floors, barriers and ceilings, furniture and other office fittings. The intent is to quantify the importance of head orientation and surface reflectivity.
Reflections from ceilings. Some work is needed to relate ASTM
C423 absorption measurements for ceiling panels to reflection coefficients for the ceiling panels with different plenum depths behind them. ASTM E11119 was introduced several years ago expressly for rating reflections from ceilings for use in open offices. There is a lack of data for commercial products. It would be useful to relate C423 ratings to the ratings generated by E1111 and to reflection coefficients that could be used in modeling. Vertical surface reflections. Sound-absorbing materials used to
FUTURE WORK
following ASTM C423 10 or in an impedance tube 11. Some work is needed to relate this standard test data to reflection coefficients for use in open offices. ASTM E1376 was introduced expressly to rate reflections from vertical surfaces. While the standard exists, little has been written about the use of the ratings it generates or how they relate to C423 ratings.12
Apart from these acoustical factors, methods for changing office etiquette might be investigated. If workers can be induced to speak quietly and to withdraw to conference areas when necessary then disturbance from speech could be greatly reduced.
SITE DESCRIPTIIONS AND MEASURED DATA FOR EACH SITE
SITE DESCRIPTIIONS AND MEASURED DATA FOR EACH SITE
Site 1
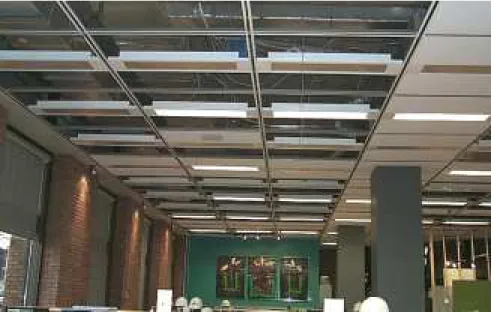
Site 1 had a very high ceiling with few tiles in place. They were primarily absent above the workstations. The distance from the floor to the top of the plenum was 5 m, to the T-bars was 3.8 m. This kind of ceiling is obviously very difficult to model because there is no definite horizontal plane and the reflections from the equipment in the plenum will be scattered in many different directions.
Figure 12: Ceiling in Site 1
In one area of the office, the barrier between workgroups also served as a bookshelf and was thus not absorptive. The height of the bookshelf was 1.35 m. (Figure 13)
SITE DESCRIPTIIONS AND MEASURED DATA FOR EACH SITE
Figure 13: Bookshelf barriers in Site 1
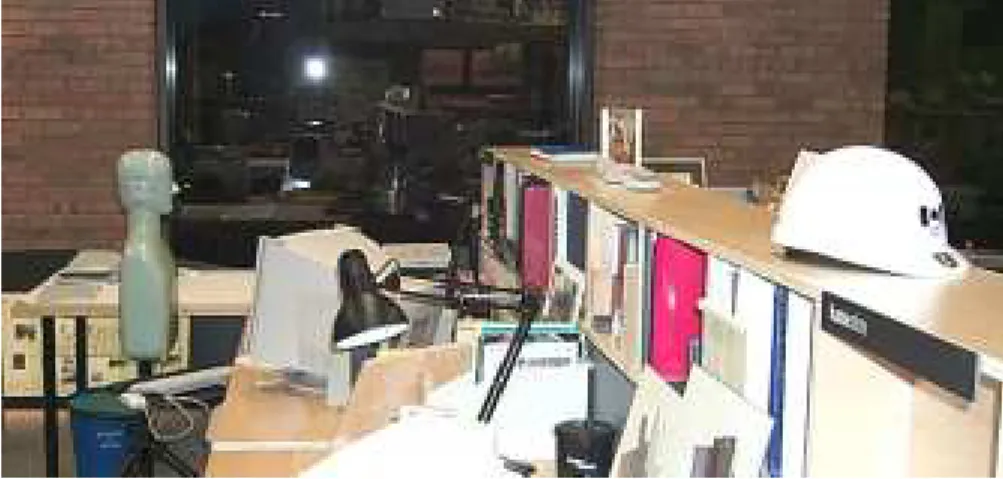
In other areas, the barrier was only 50 mm thick, 1.35 m high and finished with a cloth surface. The material below the cloth was hard so the barrier was reflective. As can be seen in Figure 14, book supports were commonly added to the barrier.
Figure 14: Narrow barriers in Site 1
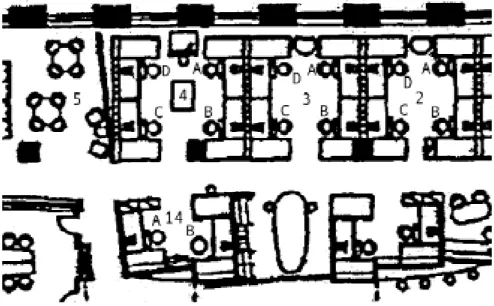
The measurement sites shown in Figure 15 had bookcase barriers. Those in Figure 16 had the thinner barriers. Location 5 was a reading area with 1.8 m barriers and bookcases on each side. The SII values measured between the various workstation pairs are listed in Table 1.
SITE DESCRIPTIIONS AND MEASURED DATA FOR EACH SITE
Figure 15: Work areas 2 to 5 and 14 in Site 1:Bookcase barriers
SITE DESCRIPTIIONS AND MEASURED DATA FOR EACH SITE
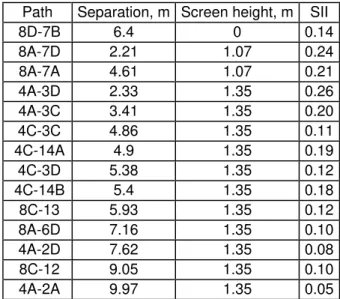
Table 1: SII values measured for site 1 with Head source
Path Separation, m Screen height, m SII
8D-7B 6.4 0 0.14 8A-7D 2.21 1.07 0.24 8A-7A 4.61 1.07 0.21 4A-3D 2.33 1.35 0.26 4A-3C 3.41 1.35 0.20 4C-3C 4.86 1.35 0.11 4C-14A 4.9 1.35 0.19 4C-3D 5.38 1.35 0.12 4C-14B 5.4 1.35 0.18 8C-13 5.93 1.35 0.12 8A-6D 7.16 1.35 0.10 4A-2D 7.62 1.35 0.08 8C-12 9.05 1.35 0.10 4A-2A 9.97 1.35 0.05
Propagation from location 4A to 2A involved passing over two bookcase barriers. Figure 17 shows the measured values of SII for the four relevant workstations. The solid line is a logarithmic fit to the data points which clearly fit well. Figure 18 shows SII versus distance for all workstation pairs measured on this site. The data show more scatter for a number of reasons including variations in dummy head orientation.
SII vs distance from station 4A
0.00 0.05 0.10 0.15 0.20 0.25 0.30 2 4 6 8 10 Separation, m Head source 4A-3D 4A-3C 4A-2D 4A-2A
SITE DESCRIPTIIONS AND MEASURED DATA FOR EACH SITE
SII vs distance, Head source
0.00 0.05 0.10 0.15 0.20 0.25 0.30 2 3 4 5 6 7 8 9 10 11 Separation, m
Figure 18: Propagation for all pairs of measurements with the Head source in Site 1.
SITE 2
SITE 2
Site 2 had a coffered ceiling with 16 mm thick glass fibre panels. The distance from the floor to the underside of the ceiling tiles was 2.6 m. The plenum depth was 0.81 m. Screens between workstations were 1.35 m high and had a cloth facing over a hard surface. Figure 19 shows a plan of the area where the measurements were made. Figure 20 shows the dummy head source in position 1A. Occupants of this area would face away from each other to some degree when talking on the phone. To talk within the workgroup, they would only have to turn their head. It is clear from the figure that the monitor screen can reflect sound. How important this is, depends on screen size, screen orientation and head position.
The second work area in Figure 19 had eight workstations with only 1.35 m high screens between them. Figure 21 gives a view of this area. SII values for measurements between position A and B to G are given in Table 2 as well as those for measurements in work area 1.
A third set of measurements in the office was made over a range where there were no intervening barriers. The Omni source was used for these measurements. The data obtained are plotted in Figure 22. The solid line in the figure is a logarithmic fit to the data. Two open circles are shown in the plot. These are the measurements from work area 1 where the Dummy Head source faced away from the receiving microphones. Thus this figure illustrates the
improvements in privacy that may be obtained when a speaker faces away from the listener.
SITE 2 A B C D A B C D F G E 2 1
Figure 19: Plan of measurement areas 1 and 2 in Site 2.
SITE 2
Figure 21: Measurement from Site 2, station 2A to 2B using the dummy head. The coffered ceiling is clearly visible.
Table 2: SII values measured for site 2.
Path Separation, m Screen height, m SII
1A-1C 3.75 0 0.26 1A-1D 3.4 0 0.26 2A-2B 2.74 1.35 0.26 2A-2D 5.1 1.35 0.11 2A-2E 3.25 1.35 0.21 2A-2F 2.1 1.35 0.24 2A-2G 2.68 1.35 0.14 2A-2C 1.98 0 0.34
SITE 2 No Barriers, Site 2 0.0 0.1 0.2 0.3 0.4 0.5 2 3 4 5 6 7 8 9 10 11 12 Distance, m Facing receiver Pointing away
Figure 22: Propagation in site 2 with no barriers between the omnidirectional source and the receiving microphones. The open circles are measurements made with the Head source facing away from the receiving microphones.
SITE 3
SITE 3
Site 3 had a regular arrangement of rectangular work cubicles. The ceiling was coffered with 16 mm thick glass fibre panels. The
distance from the floor to the underside of the ceiling tiles was 2.6 m. The plenum depth was 0.81 m. Barrier heights between stations were 1.6 m but there were lower barriers (1.1 m) between the work stations and the access paths. The internal composition of the barriers varied; some were absorptive, some were not.
Figure 23: Workstation in Site 3
Because of the regularity of the layout, it was only necessary to measure in two general locations in this office. These are sketched in Figure 24 and Figure 25. The SII values measured are given in
SITE 3
Table 3. The paths in the first location from workstation A included passes over several barriers. The plot of SII versus separation in Figure 26 shows that for these paths, SII decreases quite regularly with increasing distance.
Workstations H and I in this location offered an interesting
measurement. The normal working positions at these workstations has the occupants facing the large windows in the exterior wall. The windows were equipped with vertical blinds. Two measurements were made: one with the blinds covering the windows and one with the blinds completely withdrawn. The two measurements were not significantly different and are shown in Figure 26 as overlapping open circles. A B C D E F G H I
Figure 24: Cluster of cubicles in site 3, location 1. The thick grey line is the exterior wall and windows. The arrows indicate the orientation and location of the source. Thick lines represent 1.6 m high barriers, thin lines are 1.1 m high barriers. Openings in the low barriers to permit access are not shown.
SITE 3
A
B
C
Figure 25: Measurements across a 1.5 m wide access path, Site 3, location 2. The arrow indicates the orientation and location of the source. All barriers were 1.6 m high.
SITE 3
Table 3: SII values measured in Site 3.
Separation, m SII 1A-1B 2.31 0.19 1A-1C 4.77 0.01 1A-1D 7.37 0.00 1A-1E 10.31 0.00 1A-1F 7.62 0.00 1A-1G 5.43 0.02 1A-1H 2.95 0.21 1A-1I 2.11 0.25 2A-2B 4.63 0.15 2A-2C 5.74 0.12
SII versus separation, Head source
0.00 0.05 0.10 0.15 0.20 0.25 0.30 0 2 4 6 8 10 12 Separation, m With barrier Windows/blinds Through doorways
Figure 26: SII versus separation, Site 3.
At the second location, the barriers between the workstation and the access path were 1.6 m high but there was almost a clear line of sight through the “doorways” and across the access path. The two measurements made across the access path are shown as triangles in Figure 26. Clearly transmission across the access path
SITE 4
SITE 4
This site had two types of workstation: one was a conventional cubicle with only a single occupant, the other a more open area with three to four occupants in each work area. A plan of part of the open section is shown in Figure 27. A view from workstation 1D looking across to 1A is shown in Figure 28. A plan of part of the cubicle-style section is shown in Figure 29. The access path between the two rows of cubicles can be seen in Figure 30. Barriers in the office were 1.68 m high, 95 mm thick and had absorptive surfaces. The ceiling tiles were a flat mineral fibre type, 2.53 m above the floor. The plenum depth was 0.48 m.
SITE 4
Figure 28: View from 1D to 1A.
SITE 4
Figure 30: View down access path next to workstations 6 to 11, Site 4.
Values of SII measure using the Head source are given in Table 4 and plotted in Figure 31. A close inspection of some of the
measurement data and the associated photographs showed that some of the SII values are unusually high because of reflection from light fixtures.
Table 4: SII measured in Site 4 using Head source.
Path Separation, m Barrier
Height, m SII 5B-5D 4.50 0 0.24 1D-1A 3.14 0 0.36 1D-1B 3.75 0 0.27 5B-2C 6.83 1.05 0.04 7-6 2.40 1.68 0.20 3C-4D 2.59 1.68 0.22 7-8 3.80 1.68 0.09 1A-2D 3.90 1.68 0.06 7-10 4.05 1.68 0.07 7-9 5.45 1.68 0.07 1A-2A 5.92 1.68 0.00 3C-4C 6.43 1.68 0.01 5B-2D 7.90 1.68 0.01
SITE 4
Site 4, Head Source
0.00 0.05 0.10 0.15 0.20 0.25 0.30 0.35 0.40 2 3 4 5 6 7 8 9 Separation, m SII 1.68 m barriers No barrier
Figure 31: SII versus distance for head source, Site 4. The solid symbols are points for 1.68 m high barriers. The open symbols are for cases with no barrier between source and microphones.
Figure 32: Site 4, Location 3C showing line of light fixtures running between work stations.
SITE 5
SITE 5
This site consisted predominantly of team-style work areas with four or more employees in each area. There were, however, some smaller workstations for fewer employees. Figure 33 shows a plan of the area where most of the measurements were made. Barriers in the office were 1.33 m high and 50 mm thick with fabric facings; some were absorptive, some were not. In one location (3) a wall and a cabinet formed a 1.8 m high barrier but sound could easily pass around the vertical edges (Figure 35). In another location a wall between workstations was 2.3 m high (Figure 36).
Figure 33: Plan of central part of Site 5
The ceiling boards were 2.5 m above the floor and the plenum depth above the tiles was 1 m. The ceiling boards had a perforated vinyl facing over 16 mm thick glass fiber board.
SITE 5
Figure 34: View from location 4A looking toward 4F.
SITE 5
Figure 36: View of workstation 11 next to 2.3 m high wall.
The calculated values of SII for this site are shown in Table 5 and plotted in Figure 37. Location 12 is not shown in the plan. This was a group of 5 workstations with essentially no barriers between them but a set of filing cabinets (1.3 m high) occupied the middle part of the work area and blocked sound transmission to some extent.
Table 5: SII for locations in Site 5.
Path Separation, m Barrier Height, m SII
4A-4G 3.86 0 0.23 4A-4C 4.35 0 0.21 3A-3B 4.4 0 0.29 4G-4D 6.49 0 0.09 4A-4D 7.3 0 0.03 4A-4F 6.09 1.03 0.19 4A-4E 6.5 1.03 0.08 12A-12E 5.27 1.32 0.08 5A-5D 2.51 1.33 0.35 5D-6C 2.58 1.33 0.34 12A-12C 2.63 1.33 0.20 12A-12D 4.55 1.33 0.15 4G-4E 4.86 1.33 0.07 5A-6C 5.3 1.33 0.15 5A-7C 9.4 1.33 0.02 3A-3C 5.6 1.81 0.20 11B-11C 3.14 2.26 0.09
SITE 5
because there is a relatively easy path around the vertical edge of the barrier. The 2.3 m high barrier gives much greater attenuation between the work stations but there is still reflection from the ceiling and adjacent vertical surfaces.
Site 5, Head Source
0.00 0.05 0.10 0.15 0.20 0.25 0.30 0.35 0.40 2 3 4 5 6 7 8 9 10 Separation, m No barrier 1.3 m barrier 1.8 m barrier 2.3 m barrier
SITE 6
SITE 6
This site had only one-person cubicles arranged in a regular,
rectangular pattern. Barriers between workstations were 90 mm thick and 1.68 m high but were only 1.3 m high between workstations and the access paths (Figure 40). The surfaces of the barriers were cloth-covered and absorptive.
The ceiling boards were of mineral fibre, 16 mm thick. In one area the ceiling height was 2.92 m with a plenum depth of 1.02 m, in the other the ceiling was only 2.62 m high with a plenum depth of 1.31 m. A point to note for this and other sites is that actual arrangements of furniture found in the offices was not always that shown in the original plan. Such re-arrangements may appear innocuous but can
significantly change speech privacy. They are probably impossible to prevent. Two examples of this are locations 1 and 2. In the original plan the occupants are shown facing into the cubicle as they are in locations 9 and 10.
SITE 6
Figure 39: Plan of site 6, locations 16-19 and 22-24. 2.9 m high ceiling.
Figure 40: Typical workstation in site 6 showing high and low screens.
Calculated values of SII are shown in Figure 41 and Table 6. The two ceiling heights are identified by different symbols and shading as explained in the captions. The scatter in the data can be attributed to changes in Head orientation and other factors. Two measurements were made between workstations close to the windows. In one case, reflections from the window could have occurred (12-13), in the other (20-21) a column obstructed this path. There were no significant differences between the two measurements.
SITE 6 Head Source 0.0 0.1 0.2 0.3 1.5 2 2.5 3 3.5 4 4.5 5 5.5 6 6.5 Separation, m
Across corridor, 1.3 m barrier 1.6 m barrier
1.6 m barrier
Across corridor, 1.3 m barrier
1-6 1-5 1-10
16-22 16-19
Figure 41: SII for site 6. Square symbols are for the 2.6 m high ceiling, triangles are for the 2.9 m high ceiling.
Table 6: SII values measured for site 6. Barrier heights of 1.3 m mean transmission across an access path. The shaded areas are for measurements under the 2.9 m high ceiling
Path Separation, m Barrier Height, m SII
1-13 4.9 1.3 0.14 1-12 5.63 1.3 0.08 1-14 5.9 1.3 0.05 13-12 2.03 1.68 0.26 1-2 2.09 1.68 0.22 20-21 2.1 1.68 0.25 1-6 2.6 1.68 0.05 1-10 3.15 1.68 0.19 1-5 3.2 1.68 0.02 16-24 5.65 1.3 0.09 16-17 1.98 1.68 0.18 16-22 4.1 1.68 0.04 16-19 4.65 1.68 0.02
SITE 7
SITE 7
Site 7 primarily comprised work areas with four workstations in each. Barriers between work areas were 1.63 m high. With the work areas there were lower 1.28 m high barriers. (Figure 42, Figure 43) These occasionally interfered with propagation but not diagonally across the work area.
Figure 42:Site 7, locations 1 to 3.
Figure 43: Site 7 view from 1C to 1A.
The ceiling boards were 16 mm thick glass fibre tiles 2.54 m above the floor. Barriers had a hard surface covered with cloth. The light fixtures that replaced the original fixtures were suspended below the ceiling tiles or supported on barriers and shone light up to the ceiling. These would be less effective as acoustical reflectors than the
SITE 7
original flat luminaires but in this experimental space, the original luminaires were still in place.
In one location, four workstations were located between a wall and the windows. Both of these vertical surfaces will reflect sound well. The measurements conducted in this area did give higher values of SII but the inherent variability and the paucity of these measurements makes it impossible to make any precise statements.
Table 7: SII values measured with the Head source in Site 7.
Path Separation, m Barrier Height, m SII
3D-3C 3.12 0 0.32 1B-1C 3.56 0 0.27 3D-3A 3.88 0 0.24 3D-3B 4.9 0 0.22 1A-1C 4.94 0 0.24 4C-4D 3.57 1.1 0.26 1A-1B 2.78 1.3 0.32 1A-1D 3.79 1.3 0.23 1B-2A 2.42 1.63 0.24 3D-2C 2.62 1.63 0.21 1B-2D 4.4 1.63 0.13 3D-2B 4.63 1.63 0.10 4C-4B 2.5 1.63 0.32 4C-4A 5.27 1.63 0.11 Head Source 0.0 0.1 0.2 0.3 0.4 2 2.5 3 3.5 4 4.5 5 5.5 Separation, m Low or no barrier 1.63 m barrier 1.63 m, location 4
SITE 7
Figure 45: Site 7, location 4. A group of workstations with windows on one side and a wall on the other.
SITE 8
SITE 8
Site 8 comprised primarily team-style workspaces with some cellular types. Floor plans and views of the office are given in Figure 47 through Figure 52. The ceiling height was flat and formed from 15 mm thick vinyl-faced glass fibre panels. The height of the ceiling was 2.5 m. The plenum was 1.9 mm deep.
Barriers were 50 mm thick with heights of 1.39 and 1.58 m. The cloth surface sometimes covered a soft layer and sometimes a harder backing layer.
The values of SII calculated for this office are given in Table 8 and are plotted in Figure 53. There are no new conclusions to be drawn from this plot.
SITE 8
Figure 48: View from location 1E toward 1B.
SITE 8
Figure 50: Looking from 2B toward 2D. 2E is at the left side of the picture.
SITE 8
Figure 52: Site 8, looking into work area 3, 3B and 3C are on the right side of the picture, 3A is on the left.
Site 8, Head source
0.0 0.1 0.2 0.3 0.4 0.5 0.6 3 4 5 6 7 8 9 10 Separation, m No barrier 1.39 m barrier 1.58 m barrier
SITE 8
Table 8: SII values measured with the Head source in Site 8.
Path Separation, m Barrier Height, m SII
1B-1C 3.35 0 0.51 2B-2A 3.65 0 0.38 3A-3B 3.75 0 0.31 1B-1F 3.9 0 0.30 1B-1G 4.6 0 0.19 3A-3C 4.95 0 0.25 2B-2D 5.05 0 0.25 1B-1E 6.9 0 0.19 2B-2E 9.2 0 0.01 3A-3D 3.3 1.39 0.16 2B-2C 3.5 1.39 0.16 3A-3E 6.55 1.39 0.06 3A-3F 8.3 1.39 0.03 3B-4A 1.95 1.58 0.09 1B-1A 2.4 1.58 0.32 1B-1D 5.6 1.58 0.24 3B-4B 5.95 1.58 0.00 3A-4A 6 1.58 0.02 3A-4B 9.7 1.58 0.02
SITE 9
SITE 9
Site 9 was a rather small office with a mix of team-style workspaces and cellular types (Figure 54). The ceiling was formed from 18 mm thick, pin-perforated mineral fibre panels in a coffer arrangement. The height of the lowest point of the ceiling was 2.6 m. The plenum was 760 mm deep above the flat part of the ceiling.
Barriers in the office were 90 mm thick. Metal plates on each face formed a cavity in the barrier. Each face was covered with a layer of absorptive material and cloth about 9 mm thick in total. Barrier heights were 1.32 and 1.71 m.
Figure 56 shows a plot of SII values versus distance. The few measurement points with the higher barriers provide more speech privacy but in some cases the level of privacy was reduced by reflections from nearby vertical surfaces.
SITE 9
Figure 55: View across site 9 from near workstation 6 looking toward workstation 4.
Table 9: SII values with the Head source in Site 9.
Path Separation, m Barrier Height, m SII
6-8 6.74 0 0.08 6-5 2.1 1.32 0.31 6-7 5.1 1.32 0.14 6-10 5.14 1.32 0.10 6-12 5.64 1.32 0.05 6-4 6.02 1.32 0.13 4-3 2.11 1.71 0.26 7-8 3.4 1.71 0.24 13-11 3.61 1.71 0.25 7-9 5.4 1.71 0.03 4-1 6.1 1.71 0.04
SITE 9
Site 9, Head source, working orientation
0.0 0.1 0.2 0.3 0.4 2 3 4 5 6 7 Separation, m 1.32 m barrier 1.7 m barrier no barrier
REFERENCES
REFERENCES
1
"Voice Levels Measured in Open Offices", W.T. Chu and A.C.C. Warnock. Report B3144.1Draft prepared for PWGSC. August 2000
2
"Guide To Open Office Acoustics", A.C.C. Warnock. Report B3144.3Draft prepared for PWGSC. August 2000
3
ANSI S3.5. American National Standard Methods for the Calculation of the Speech Intelligibility Index.
4
ASTM E1179 Standard Specification for sound sources used for testing open office components and systems.
5
ANSI S3.5. American National Standard Methods for the Calculation of the Speech Intelligibility Index.
6
ASTM E1130 Standard Test method for objective measurement of speech privacy in open offices using articulation index.
7
Maekawa, Z., 1968, “Noise reduction by screens”, Applied
Acoustics, 1, pp157-173. 8
ASTM E1375 Standard Test Method for measuring the interzone attenuation of furniture panels used as acoustical barriers.
9
ASTM E1111 Standard Test method for measuring interzone attenuation of ceiling systems.
10
ASTM C423 Standard Test method for sound absorption and sound absorption coefficients by the reverberation room method.
11
ASTM E1050 Standard Test Method for impedance and absorption of acoustical materials using a tube, two microphones, and a digital frequency analysis system.
12
ASTM E1376 Standard Test Method for measuring the interzone attenuation of sound reflected by wall finishes and furniture panels.