HAL Id: hal-01289072
https://hal.sorbonne-universite.fr/hal-01289072
Submitted on 16 Mar 2016
HAL is a multi-disciplinary open access archive for the deposit and dissemination of sci-entific research documents, whether they are pub-lished or not. The documents may come from teaching and research institutions in France or abroad, or from public or private research centers.
L’archive ouverte pluridisciplinaire HAL, est destinée au dépôt et à la diffusion de documents scientifiques de niveau recherche, publiés ou non, émanant des établissements d’enseignement et de recherche français ou étrangers, des laboratoires publics ou privés.
shifts in atmospheric circulation in the late 1970s
Jing Gao, Camille Risi, Valérie Masson-Delmotte, You He, Baiqing Xu
To cite this version:
Jing Gao, Camille Risi, Valérie Masson-Delmotte, You He, Baiqing Xu. Southern Tibetan Plateau ice core δ18O reflects abrupt shifts in atmospheric circulation in the late 1970s. Climate Dynamics, Springer Verlag, 2016, 46 (1-2), pp.291-302. �10.1007/s00382-015-2584-3�. �hal-01289072�
DOI 10.1007/s00382-015-2584-3
Southern Tibetan Plateau ice core δ
18O reflects abrupt shifts
in atmospheric circulation in the late 1970s
Jing Gao1,2 · Camille Risi3 · Valerie Masson‑Delmotte4 · You He1,5 · Baiqing Xu1,2
Received: 25 June 2014 / Accepted: 29 March 2015 / Published online: 16 April 2015 © The Author(s) 2015. This article is published with open access at Springerlink.com
change. Correlation analyses suggest that the large-scale modes of variability (PDO and ENSO, i.e. Pacific Decadal Oscillation and El Nino-Southern Oscillation) play impor-tant roles in modulating NK δ18O changes. The NK δ18O
minimum at the end of the 1970s coincides with a PDO phase shift, an inflexion point of the zonal index (represent-ing the overall intensity of the surface westerly anomalies over middle latitudes) as well as ENSO, implying inter-decadal modulation of the influence of the PDO/ENSO on the Indian monsoon on southern TP precipitation δ18O.
While convective activity above North India controls the intra-seasonal variability of precipitation δ18O in southern
TP, other processes associated with changes in large-scale atmospheric circulation act at the inter-annual scale.
Keywords Ice core δ18O · Large-scale atmospheric
circulation · Isotopic general circulation model · Southern Tibetan Plateau
1 Introduction
The Tibetan Plateau (TP) is a unique area where the topog-raphy plays a key role in the regional atmospheric circu-lation and the hydrological cycle, which encompasses the largest number of glaciers outside of polar regions (Yao et al. 2012). Short instrumental records from inhabited areas depict a recent large warming trend (Liu and Chen
2000; Wang et al. 2008; Qin et al. 2009). Natural archives allow us to place recent changes in the broader context of natural climate variability. Among them, ice cores pro-vide high-resolution proxy records of climate variability, archived through e.g. changes in water stable isotopes (usu-ally expressed in a delta notation, such as δ18O used
here-after). However, their climatic interpretation requires us to
Abstract Ice cores from the Tibetan Plateau provide
high-resolution records of changes in the snow and ice isotopic composition. In the monsoon sector of south-ern Tibetan Plateau, their climatic interpretation has been controversial. Here, we present a new high-resolution δ18O record obtained from 2206 measurements performed at 2–3 cm depth resolution along a 55.1 m depth ice core retrieved from the Noijinkansang glacier (NK, 5950 m a.s.l.) that spans the period from 1864 to 2006 AD. The data are characterized by high δ18O values in the
nine-teenth century, 1910s and 1960s, followed by a drop in the late 1970s and a recent increasing trend. The comparison with regional meteorological data and with a simulation performed with the LMDZiso general circulation model leads to the attribution of the abrupt shift in the late 1970s predominantly to changes in regional atmospheric circula-tion, together with the impact of atmospheric temperature Electronic supplementary material The online version of this
article (doi:10.1007/s00382-015-2584-3) contains supplementary
material, which is available to authorized users. * Jing Gao
gaojing@itpcas.ac.cn
1 Key Laboratory of Tibetan Environment Changes and Land
Surface Processes, Institute of Tibetan Plateau Research, Chinese Academy of Sciences, Beijing, China
2 CAS Center for Excellence in Tibetan Plateau Earth
Sciences, Beijing 100101, China
3 LMD/IPSL, CNRS, UPMC, Paris, France
4 LSCE, UMR 8212 CEA/CNRS/UVSQ – IPSL,
Gif-sur-Yvette, France
5 State Key Laboratory of Cryospheric Sciences, Cold and Arid
Regions Environment and Engineering Research Institute, Chinese Academy Sciences, Beijing, China
decipher the climatic controls on high-altitude precipitation δ18O. While northern TP δ18O is mostly controlled by tem-perature-driven distillation, as in mid and high latitudes, the situation is more complex in the monsoon sector of the southern TP (Yao et al. 2013).
A number of studies have attributed recent increas-ing trends in south TP ice core δ18O to regional warming
(Thompson et al. 2000; Yao et al. 2006a; Zhao et al. 2012), while process-based studies have stressed the importance of changes in precipitation amount and Indian monsoon intensity (Vuille et al. 2005; Kaspari et al. 2007; Joswiak et al. 2010). Some authors have also stressed that spatial patterns are related to changes in air mass trajectories and moisture sources (Tian et al. 2003; Johnson and Ingram
2004; Breitenbach et al. 2010).
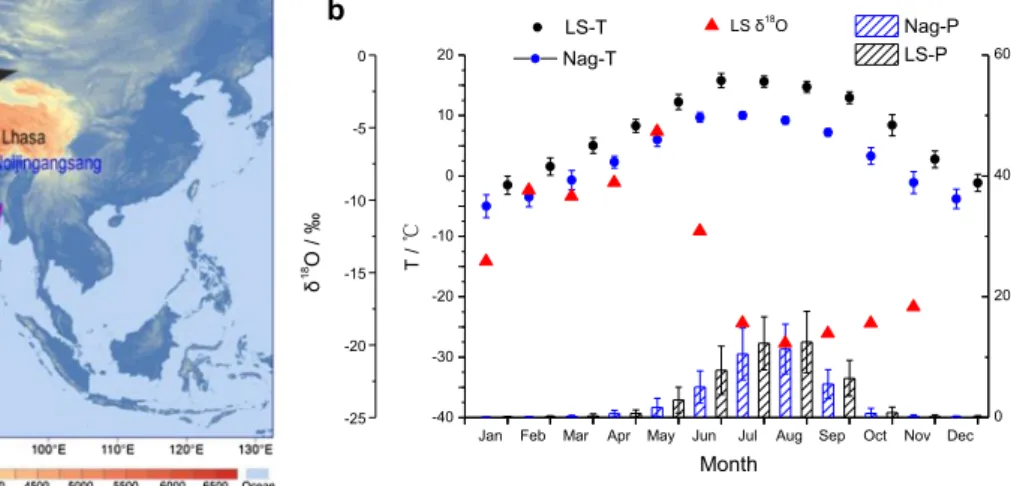
The southern TP climate is characterized by strong sea-sonal shifts in atmospheric circulation, as winter air masses are advected by the westerlies while summer atmospheric circulation is dominated by the Indian monsoon (Fig. 1a). Large-scale circulation indeed plays a key role in the spa-tial and seasonal distribution of southern TP precipitation δ18O at intra-annual scales (Tian et al. 2001; Gao et al.
2011; Yao et al. 2013). Several studies have therefore suggested that TP ice cores record past variations of the regional atmospheric circulation (Qin et al. 2000; Kang et al. 2002, 2007b) which transports moisture from differ-ent sources (Tian et al. 2006), as also proposed for other locations (Meeker and Mayewski 2002; Kreutz et al. 2000; Hoffmann et al. 2003b; Xiao et al. 2004). So far, the exact processes relating atmospheric circulation and southern TP δ18O have not been precisely identified and quantified.
Here, we present a new high-resolution isotopic record from an ice core recently drilled on the Noijinkansang (NK) glacier, southwest of Lhasa, which covers 2.7 km2
in the southern TP (Fig. 1a) and extends from 5540 to 6674 m a.s.l.. During May 2007, our ice core was drilled to bedrock (55.1 m depth) at 5950 m a.s.l. in a flat basin of the accumulation zone of the NK glacier (29°2′8.68″N, 90°11′54.10″E, Fig. 1a). The nearest meteorological sta-tions, Nagarze (29.96°N, 90.33°E, 4430 m a.s.l.) and Lhasa (29.70°N, 91.13°E, 3650 m a.s.l.), show that more than 80 % of annual precipitation occurs during the summer Indian monsoon season (June–September, hereafter JJAS, Fig. 1b), with a large inter-annual variability (Gao et al.
2009; Tian et al. 2001) (Fig. 1b). Monthly precipitation δ18O from these stations displays a clear seasonal cycle, typical of southern TP, with maximum values in spring and minimum values in summer (Fig. 1b, Gao et al. 2009,
2013; Yao et al. 2013). This seasonal pattern is identified in the NK ice core and provides the basis for its age scale (Sect. 2).
This paper focuses on the climatic interpretation of the NK ice core δ18O record (hereafter NK δ18O). In Sect. 3,
we explore the statistical relationships between inter-annual δ18O variations and local or regional temperature
and precipitation data. Large-scale atmospheric telecon-nections with NK δ18O are also investigated. Atmospheric
reanalyses, climate indices and an atmospheric general cir-culation model (LMDZiso) are used to identify and quan-tify the role of changes in large-scale atmospheric circu-lation on NK δ18O. Section 4 reports our conclusions and
perspectives.
Jan Feb Mar Apr May Jun Jul Aug Sep Oct Nov Dec -40 -30 -20 -10 0 10 20 -25 -20 -15 -10 -5 0 Month Nag-T 0 200 400 600 Nag-P LS-T T / b LS-P P / mm LS δ18O δ 18O / ‰
Fig. 1 a General patterns of moisture transport towards the TP
(pur-ple, summer Indian monsoon; black, winter westerlies). The blue
circle indicates the location of the ice core drilling site
Noijingang-sang. The position of the nearest meteorological stations (Lhasa and Nagarze) is shown by the red filled circles. b Mean seasonal cycle
(1961–2006) of surface air temperature (T, °C, circles), precipitation amount (P, mm per month, vertical bars) at Lhasa (LS) and Nagarze (LKZ) meteorological stations, and monthly weighted precipitation
δ18O (‰, 1994–2006, triangles) at Lhasa. Error bars show the
2 Data
The NK ice core was cut into 2206 samples with intervals of 2 or 3-cm for analyses of stable isotopes, major soluble ions and carbonaceous aerosols, and 55 samples (~1 m resolu-tion) for total beta radioactivity (hereafter β-activity) meas-urements. All the samples were transported to laboratory in frozen condition and melted at room temperature prior to analyses. Oxygen isotopes were measured using a MAT-253 mass spectrometer (with an analytical precision of 0.05 ‰) at the Key Laboratory of CAS for Tibetan Environment and Land Surface Processes, China. The β-activity was meas-ured at the Analytical Laboratory of the Beijing Research Institute of Uranium Geology, China. The ice core is drilled on a vast and flat platform in the accumulation zone of the glacier, close to the ice divide. Field observations report no
sign of surface wind mixing. Zhao et al. (2012) describes in details the ice core drilling and analytical procedures.
Below 16 m depth, the ice core density gradually increases to 0.9 g/cm3, with no indication of melt or
strati-graphic perturbation. The chronology is based on the iden-tification of seasonal cycles in δ18O and major soluble ions
and verified using β-activity. The seasonal cycle of precipi-tation δ18O is used to identify annual layers from one
maxi-mum of ice core δ18O to the next one, therefore from spring
(April–May) of 1 year to spring of the next year. The mean accumulation rate of the NK ice core of 470 mm w.e. is larger than the climatological precipitation amount at Lhasa and Nagarze (441.3 and 359.3 mm, respectively). Peaks in β-activity are detected at ~13.73 m (1987 Chernobyl event) and ~23.59 m (1963 nuclear bomb testing). The 55.1 m ice core is estimated to span 142 years (Fig. 2c). From repeated
-2 0 2 -2 0 2 1860 1870 1880 1890 1900 1910 1920 1930 1940 1950 1960 1970 1980 1990 2000 2010 -600 0 600 -24 -20 -16 -12 -11 -10 -9 -8 -7 -2 0 2 1860 1870 1880 1890 1900 1910 1920 1930 1940 1950 1960 1970 1980 1990 2000 2010 -38 -36 -34 -32 -300 0 300 Annual T anomal y Lhasa Nagarze e JJAS T anomal y d c vs. d: R=0.39, Slope=0.11, p<0.05 at Nagarze b vs. h: R=0.23, Slope=96.58, p>0.1
JJAS P anomaly from LMDZis
o Year h NK δ 18O c NK δ 18 O from LMDZis o a b b vs. f: R=0.24, Slope=0.27, p>0.1
annual T anomaly from LMDZis
o f a vs. b: R=0.46, Slope=0.79, p<0.01 Annual vapor δ 18 O from LMDZis o c vs. g: R=-0.11, Slope=-4.92, p>0.1 at Nagarze R=0.26, Slope =15.04, p>0.05 at Lhasa g JJAS P anomal y
Fig. 2 (a) Inter-annual variation of simulated JJAS vapor δ18O
anom-aly from LMDZiso at the NK ice core site since 1958. (b) NK δ18O
from LMDZiso simulated in the corresponding region from 1958
to 2006. Inter-annual variations of (c) Noijinkansang ice core δ18O
from 1864 to 2006 compared with (d) JJAS temperature anomaly at Nagarze and Lhasa from 1961 to 2006, (e) annual temperature anom-aly at Nagarze and Lhasa from 1961 to 2006, (f) simulated annual temperature anomaly from LMDZiso at the NK ice core site since
1958, (g) JJAS precipitation anomaly at Nagarze and Lhasa from 1961 to 2006, (h) simulated annual precipitation amount anomaly from LMDZiso at the NK ice core site since 1958. The blue lines show data at Nagarze station, the red lines show data at Lhasa station, and the gray lines show data from LMDZiso. The vertical yellow
shades indicate the extreme years based on lowest/highest NK δ18O.
On all panels, R (larger than 0.1 are shown only) and slopes show the
annual layer counting using sub-annually resolved δ18O
and major soluble ions from the 2206 samples, we estimate the age scale uncertainty to be ±1 year from 2006 to 1963 and less than ±2 years prior to 1963 (Zhao et al. 2012).
From low-resolution measurements of δ18O and δD (220
merged samples), Zhao et al. (2012) observed an increasing trend of deuterium excess. They attributed this signal to a decrease of Indian monsoon precipitation on the southern TP through the reduced fraction of annual mean accumula-tion provided by summer precipitaaccumula-tion (associated with a low deuterium excess, Zhao et al. 2012). Here, we expand the investigation of the NK water stable isotope record through our new high-resolution δ18O data.
This new record will be compared in the next section with local and regional meteorological data. For this pur-pose, surface air temperature data are available from Lhasa and Nagarze meteorological stations (National Meteoro-logical Information Center of the China MeteoroMeteoro-logical Administration). We also use 2.5° × 2.5° regional monthly precipitation amount data spanning 1979–2006 from the GPCP (Global Precipitation Climatology Project) (http:// www.esrl.noaa.gov/psd/data/gridded/data.gpcp.html). Finally, we also use monthly regional surface air tempera-ture and vertical winds data for the period of interest from NCEP reanalysis data (http://www.esrl.noaa.gov/psd/data/ reanalysis/reanalysis.shtml).
To explore the impacts of El Nino/Southern Oscillation (ENSO) on NK δ18O, we use the Nino 3.4 sea surface
tem-perature (SST) index derived from the HadISST1 data set (Rayner et al. 2003) for the period 1870–2006. The rela-tionships between our NK δ18O and Pacific Decadal
Oscil-lation for the period of 1900–2006 (PDO, http://jisao.wash-ington.edu/pdo/PDO.latest, Zhang et al. 1997; Mantua et al.
1997) as well as Zonal index (defined by the normalized difference in zonal-averaged sea level pressure anomalies between 35 N and 65 N, representing the overall intensity of the surface westerly anomalies over middle latitudes) for the period 1864–2006 (http://ljp.lasg.ac.cn/dct/page/65592, Li and Wang 2003) are also analyzed.
LMDZiso is an atmospheric general circulation model which explicitly includes water stable isotopes (Risi et al.
2010). It captures the seasonal and intra-seasonal vari-ability of TP precipitation δ18O (Gao et al. 2011; Yao et al. 2012; Gao et al. 2013), but with a cold and dry bias in the southern TP (Gao et al. 2011). Here, we use the inter-annual precipitation and vapor δ18O outputs from a
simula-tion performed at 2.5° × 3.75° resolusimula-tion, run from 1958 to 2006 in a “nudged” mode. The Atmospheric Model Inter-comparison Project (AMIP) protocol (Gates 1992) is used to prescribe monthly sea surface boundary conditions. The European Centre for Medium-Range Weather Forecasts (ECMWF) reanalysis results (Uppala et al. 2005) are used to nudge the horizontal wind fields with a relaxation time
of 1 h. This warrants that the large-scale LMDZiso simu-lated wind fields are consistent with the observations, and allows to use of the LMDZiso framework to understand and quantify the role of changes in atmospheric circulation in the observed δ18O variability. A zoomed simulation using
the zoom functionality of the LMDZ model, stretching the grid to the horizontal resolution of 50–60 km between 0° and 55°N and 60° and 130°E, are also used here to detect the inter-annual variability.
3 Results and discussion
3.1 Ice core δ18O variation
The NK δ18O record shows large seasonal variations, from
−7.0 ‰ at 24.19 m depth to −24.7 ‰ at 16.27 m depth (not shown), with an annual mean value of −16.9 ± 1.7 ‰ from 1864 to 2006 (Fig. 2c). This record contains remark-able multi-decadal variations. Utilizing the regime shift detection algorithm of Rodionov (2004), six different regimes are identified with the regime shift years of 1911, 1921, 1957, 1973 and 1980. High and stable δ18O values
are observed in the nineteenth century, above present-day levels. Two subsequent periods are marked by high δ18O,
from the 1910 to 1920 and from 1958 to 1972, with lower values in-between. Since the 1980, NK δ18O has increased
at a mean pace of 0.05 ‰ per year. A sharp decrease occurs from the 1973 to 1978, with the strongest annual δ18O
minimum recorded in 1978. We have investigated whether similar anomalous low δ18O values are recorded in other
Tibetan ice cores. A small minimum is recorded in 1978 in the Malan, Puruogangri and Dasuopu ice cores, and in 1976–1977 in the Guliya, Geladaidong and Tanggula ice cores (not shown). Because the dating uncertainties of these ice cores are usually around ±1 year (Hou et al.
2003; Yao et al. 2006a, b; Joswiak et al. 2010; Kang et al.
2007a; Yao et al. 1997; Wang et al. 2006), we conclude that there is a widespread negative δ18O anomaly in late 1970s
in the Tibetan ice cores, most strongly expressed in NK and Tanggula ice cores.
3.2 Relationships with regional meteorological data
These results motivate further exploration of the climatic controls on NK δ18O, with a focus on the period from 1960
to 2006, where the age scale is well established. We first investigate statistical relationship of NK δ18O with regional
meteorological data. Since more than 80 % of precipitation occurs in JJAS, we focus on the relationships between JJAS temperature and precipitation amount and NK δ18O. Since
the 1960s, NK δ18O shows decadal variations which
Without detrending, NK δ18O inter-annual variations are
significantly correlated with Nagarze JJAS temperature (R = 0.39, p < 0.05, Fig. 2), but not with precipitation. With detrending, NK δ18O inter-annual variations are still
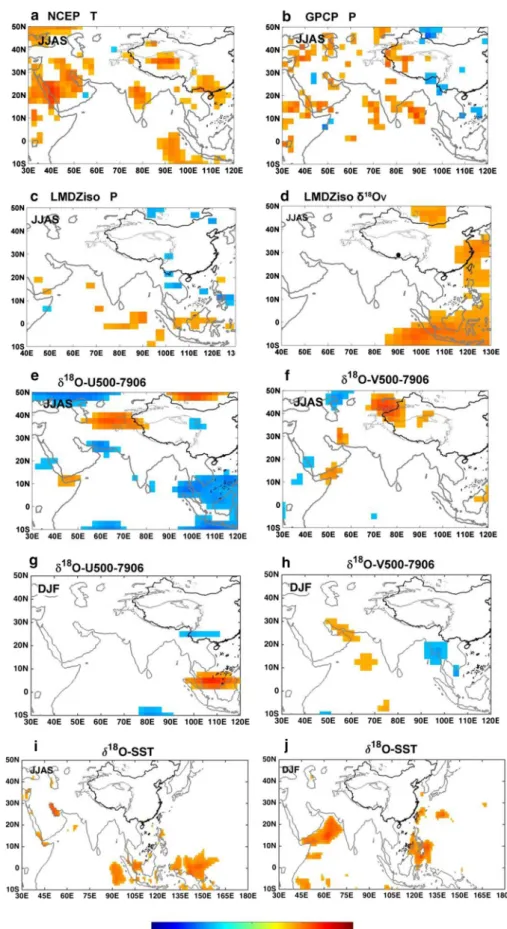
significantly correlated with Nagarze JJAS temperature (R = 0.47, p < 0.01), but neither with Nagarze precipita-tion nor with Lhasa temperature and precipitaprecipita-tion. Using NCEP gridded JJAS temperature data, we detect significant positive correlations between NK δ18O and temperature in
the central-northern TP and central India, with correlation coefficients <0.6 (Fig. 3a). Using GPCP gridded precipita-tion data, we identify a weak but significant anti-correlaprecipita-tion between NK δ18O and JJAS precipitation in South East TP
(95°–100°E and 25°–30°N, R > −0.4, p < 0.01), and a pos-itive correlation with JJAS precipitation in the Bay of Ben-gal (65°–95°E and 10°–20°N, R < 0.6, p < 0.01, Fig. 3b).
3.3 Comparison with LMDZiso simulations and large scale climate fields
We now compare these data with LMDZiso outputs. The simulated temperature is in better agreement with the observed temperature at Nagarze station than that at Lhasa (Fig. 2e, f), especially for the cool periods (1968, 1977– 1979, 1992–1997). However, the model overestimates the variability of precipitation amount, compared with obser-vations at Lhasa and Nagarze stations (Fig. 2g, h), espe-cially before 1980s. We observe a better model-data agree-ment between NK δ18O and the simulated water vapor δ18O
than with the simulated precipitation δ18O for the period of
1958–2006 (Fig. 2a–c); this could be related to the inter-mittency of precipitation, or to post-deposition processes (Steen-Larsen et al. 2014).
Some inter-annual changes in the simulated annual tem-perature, precipitation amount and water vapor δ18O
coin-cide with changes recorded in NK δ18O (Fig. 2a–c, f, h).
Within LMDZiso, the percentage of the simulated precipi-tation δ18O which can be explained by a linear correlation
with local simulated temperature and precipitation is weak and can only explain less than 10 % of precipitation δ18O
variance (Fig. 2b, f, h), even when considering a multiple regression that includes the temperature and precipitation amount together. The lowest NK δ18O is observed and
sim-ulated in 1978, and it is associated with the most negative anomalies of simulated annual temperature (Fig. 2e), pre-cipitation amount (Fig. 2h) and vapor δ18O (Fig. 2a).
NK δ18O is weakly positively correlated with JJAS
sim-ulated precipitation amount in the tropical Indian Ocean (R < 0.6, p < 0.1) and, as in GPCP, anti-correlated with LMDZiso precipitation in the southeast TP (R > −0.3,
p < 0.1) (Fig. 3c). NK δ18O is most strongly correlated with
vapor δ18O at 425 hPa for the period of 1979–2006
(pres-sure level closest to NK ice core drilling site elevation) in
the tropical Indian Ocean (10°S–10°N, 85°E–130°E) and the west Pacific Ocean (Fig. 3d). In addition, NK δ18O is
significantly positive correlated with JJAS zonal wind (U wind) at 500 hPa in 32°N–40°N and 50°E–80°E from 1979 to 2006 (Fig. 3e). Meanwhile, NK δ18O is significantly
negatively correlated with JJAS U wind at 500 hPa over the tropical Indo-Pacific Ocean during the same period (Fig. 3e). After 1979, the significant positive correlation between NK δ18O and meridional wind (V wind) exists
in northwest TP (Fig. 3f). NK δ18O is also significantly
positively correlated with the observed SST since 1982 in the tropical Indo-Pacific Ocean (between 5°N and 20°S, Fig. 3i). In winter, the significantly positive correlation only exists in 0°–10°N and 95°E–120°E with U wind, and the Persian Gulf as well as a small part of Arabian Sea with V wind (Fig. 3f, h). NK δ18O show significantly positive
correlation with winter SST in the western and northern Arabian Sea and the Philippines (Fig. 3j).
These statistical analyses suggest large-scale atmos-pheric circulation drivers of NK δ18O inter-annual
vari-ability. The mechanisms relating large-scale atmospheric circulation and tropical precipitation isotopic composition are complex, and have been explored in atmospheric mod-els. Following earlier works of Hoffmann (2003) and Vuille et al. (2003) for the Andes, Brown et al. (2006) identified strong imprints of monsoons, meridional migration of the ITCZ and ENSO in tropical precipitation isotopic compo-sition, through processes affecting rainout intensity and convection height. Other ice cores in the central TP, Arc-tic, AntarcArc-tic, and subpolar regions were also interpreted to depict rapid changes in atmospheric circulation after the mid-1970s (Kang et al. 2002; Kaspari et al. 2007; Schnei-der et al. 2012; Kelsey et al. 2012).
The statistical analyses show that local temperature or precipitation account for less than 50 % of NK δ18O
vari-ability in both observations and LMDZiso, and point to processes associated with moisture transport and large-scale atmospheric circulation, at the inter-annual large-scale. At the intra-summer scale, different controls were identified for Lhasa precipitation δ18O variability (Gao et al. 2013).
Combining daily precipitation isotopic composition meas-urements and satellite information on convection and water vapor isotopic composition, He et al. (2015) showed a dominant control through convective activity above North India: enhanced convection (and increased precipita-tion above N. India) depletes surface water δ18O, and this
depletion is further amplified along the orographic uplift of moister air, and finally by enhanced subsidence of depleted vapor towards Lhasa. Our study suggests that controls at the intra-seasonal time scale cannot be extrapolated at the inter-annual scale. Indeed, the statistical analyses show that, at the inter-annual scale, enhanced JJAS precipitation above the southern Bay of Bengal and enriched vapor δ18O
Fig. 3 Spatial distribution of
linear correlation coefficients
between NK ice core δ18O and
regional air temperature and precipitation from observations and LMDZiso simulations, as well as winds and SST.
a NCEP gridded JJAS surface
air temperature data (1948– 2006), b GPCP gridded JJAS precipitation data (1979–2006),
c JJAS precipitation amount
simulated from LMDZiso (1979–2006). d Correlation coefficients between NK ice
core δ18O and LMDZiso JJAS
vapor δ18O at 425 hPa hight
(1979–2006). e Correlation coefficients between NK ice
core δ18O and NCEP gridded
JJAS zonal wind (U wind) at 500 hPa height (1979–2006).
f Correlation coefficients
between NK ice core δ18O and
NCEP gridded JJAS meridi-onal wind (V wind) at 500 hPa height (1979–2006). g Correla-tion coefficients between NK
ice core δ18O and NCEP
grid-ded DJF zonal wind at 500 hPa height (1979–2006).
h Correlation coefficients
between NK ice core δ18O and
NCEP gridded DJF meridi-onal wind at 500 hPa height (1979–2006). i Correlation coefficients between NK ice
core δ18O and NCEP gridded
JJAS SST (1982–2006). j Cor-relation coefficients between
NK ice core δ18O and NCEP
gridded DJF SST (1982–2006). On all maps, only correlations significant at the 95 % confi-dence level are shown
in the tropical ocean and west Pacific Ocean at 425 hPa level are consistent with an δ18O enrichment at NK high
elevation site, responding to a common large-scale mode of variability.
We now discuss the mechanisms which may affect the recent NK δ18O trend, since 1980. While warming is
expected to induce enrichment in the NK δ18O, one
pro-cess is expected to compensate for temperature effects and weaken the NK δ18O increase after 1980. Enhanced
wester-lies (Yuan et al. 2014), accounting for a larger proportion of annual precipitation, also provide depleted moisture though long distance transport.
3.4 Causes of the late 1970s NK δ18O shift: statistical analysis
In order to further explore the processes controlling inter-annual variations of NK δ18O, we focus on the sharp
decrease observed in the late 1970s (Fig. 2c). Meteoro-logical data show cold conditions in 1978 at both stations (Fig. 2e) as well as in the central TP (Kang et al. 2007b), with the coldest summer encountered in 1976 at Nagarze and Lhasa (Fig. 2d).
During the mid-1970s, shifts in North Pacific climate regime were associated with a deepening of the Aleutian Low and a strengthening of the mid-latitude westerlies (Miller et al. 1994; Nakamura et al. 1997; Mantua et al.
1997; Zhang et al. 1997; Wu et al. 2005), which affected Indian monsoon strength (Trenberth and Hurrell 1994; Wang and Ding 2006). This regime shift also involved changes in the PDO and ENSO (Guilderson and Schrag
1998; Mantua and Hare 2002; Alexander et al. 2002). The ENSO influence on TP moisture and ice core δ18O are also
found at Dasuopu (Brown et al. 2006) and other tropical ice cores (Vuille et al. 2003; Hoffmann 2003a; Bradley et al.
2003). This motivates an investigation of the relationships between NK δ18O and Pacific modes of variability.
The spectral analysis of NK δ18O, performed with a
wavelet and Multi-Taper method (not shown) reveals a sig-nificant periodicity at 2.7 years, also suggesting an ENSO influence on NK δ18O. During several intervals, NK δ18O
is significantly correlated with Nino 3.4 SST index for dif-ferent seasons. During the cold PDO phase of 1943–1976 (Fig. 4e), NK δ18O is positively correlated with
Decem-ber-February (DJF) Nino 3.4 SST anomalies (R = 0.32,
p = 0.06 and up to 0.44, p = 0.01 when excluding 1973, Fig. 4a, b). Since 1980, during the warm phase of PDO, NK δ18O is anti-correlated with May–September (MJJAS)
Nino 3.4 SST anomalies (R = −0.32, p = 0.11 and up to R = −0.45, p = 0.02 excluding 1984) (Fig. 4a, c, e). The NK δ18O minimum at the end of the 1970s coincides with
a PDO phase shift (from negative phase to positive phase, Grigholm et al. 2009), an inflexion point of the zonal index (onset of a fast increase, Fig. 4a, d) as well as ENSO Fig. 4 Comparison of (a)
the NK δ18O anomalies, (b)
December–February Nino 3.4 SST anomalies from 1870 to 2006, (c) May–September Nino 3.4 SST anomalies from 1870 to 2006 and (d) Zonal index from 1864 to 2006 as well as (e) December–February PDO from 1900 to 2006. Thin lines show annual data and thick lines show 10-year smoothing. Horizontal
gray lines depict zero levels
-4 -2 0 2 4 -8 -4 0 4 8 -2 -1 0 1 2 -3 0 3 1860 1880 1900 1920 1940 1960 1980 2000 -3 0 3 NJ δ 18 O a nomal y a b Zonal index_DJF d e Nino3,4_MJJAS anomaly c Nino3,4_DJF anomal y PDO_DJF anomal y year
(increase in frequency and intensity). This again indicates that the most remarkable NK δ18O negative anomaly is
associated with changes of the large-scale atmospheric cir-culations, although a partial role of temperature cannot be excluded.
The mechanism by which the PDO/ENSO could affect the southern TP ice core δ18O was hypothesized through
the Indian monsoon and westerlies changes. An “atmos-pheric bridge” connects the ENSO/PDO-driven large-scale atmospheric circulation changes with the SST, wind, and humidity from the North Pacific to Indian Oceans (Alex-ander et al. 2002), which then alter the strength and inten-sity of the Indian monsoon. In the decade prior to the cli-mate shift, SST changed in the western subtropical Pacific, leading to a shift of atmospheric circulation and changes of SST in other parts of Pacific, then driving ENSO vari-ability by modulating the trade winds (Barnett et al. 1999; Vimont et al. 2001, 2003; Alexander et al. 2002). After 1976, the cooling of SST of central Pacific and subtropics associated with central Pacific El Niño forced changes in the extra-tropical atmospheric circulation (Lorenzo et al.
2010), and surface wind anomalies switched from easterly to westerly. In return, tropical SST changes associated with the recurrence of El Niño from the mid 1970s to the late 1980s reinforced north Pacific changes and westerly wind anomalies (Wu et al. 2005). The warm phase of PDO dur-ing the boreal winter season affects subtropical and tropi-cal SST persisting into the next monsoon season (Krishna-murthy and Krishna(Krishna-murthy 2013). This pattern explains the anti-correlation between NK δ18O and
May–Septem-ber (MJJAS) Nino 3.4 SST anomalies since 1980. They drive changes in equatorial trade winds that reinforce the equatorial Walker circulation and lead to enhanced ascend-ing motion in the central Pacific and the equatorial Indian Ocean, weakening the Indian monsoon (Krishnamurthy and Krishnamurthy 2013).
With the increase of SST and zonal wind in the tropical Indo-Pacific Ocean, the evaporation of surface ocean water strengthens, providing local vapor which is not depleted in δ18O. The increased local evaporation replenishes the mon-soon flow and may explain the reduced depletion of NK δ18O. In the southern TP, these processes can be compen-sated by the fact that a weaker Indian monsoon also leads to an increase in moisture transported from western remote sources (e.g. Persian Gulf), which is characterized by low δ18O. El Niño events further reduce the strength of Indian monsoon through the descending Hadley branch, while the situation is more ambiguous during La Niña events (Man-tua and Hare 2002; Krishnamurthy and Krishnamurthy
2013; Sano et al. 2013; Miyasaka et al. 2014). The transport of vapor over the tropical Indo-Pacific Ocean changes with winds corresponding to the PDO/ENSO phase. In El Nino winter, the westerlies decreases due to the warmer SST in
tropical Indian Ocean, resulting in more water vapor trans-port to north; after 1980, during the warm phase of PDO, cyclones prevail in the west of Philippines in La Nina win-ter, helping stronger moisture transport from Indian Ocean to continent; before 1980, the condition is opposite (Yuan et al. 2014). The influences of El Nino/La Nina on anticy-clone/cyclone close to the Philippines however are incon-sistent and asymmetric (Wu et al. 2010). Meanwhile, the deepening of the Aleutian Low and strengthening of the winter mid-latitude westerlies are associated with colder conditions (Miller et al. 1994; Alexander et al. 2002; Man-tua and Hare 2002), further depleting precipitation δ18O.
3.5 Causes of the late 1970s NK δ18O shift: analysis using LMDZiso
The role of large-scale circulation is now explored using LMDZiso JJAS precipitation δ18O. The model simulates
too enriched precipitation δ18O, a feature common to other
atmospheric models (Yao et al. 2013), but also underesti-mates the magnitude of inter-annual δ18O variations, and
does not produce decadal variability. We note that the model caveats could be linked to the atmospheric model resolution, as it cannot resolve small-scale topographic fea-tures which may play a key role on the inter-annual varia-bility of high elevation precipitation δ18O (Gao et al. 2011).
The zoomed simulation obviously improves the intra-annual precipitation δ18O, but not its inter-annual
variabil-ity. We also stress the fact that the ice core record can be associated with a noticeable noise level, due to post deposi-tion processes such as wind scouring, and does include a signal from the non-monsoon season. However, LMDZiso does produce a sharp decrease in NK precipitation δ18O in
the late 1970s, and minimum values in 1978. We therefore use the framework provided by the LMDZiso simulation to understand the processes controlling the JJAS δ18O
deple-tion in 1978–1979, compared to 1982–1983 levels (Fig. 5). The associated precipitation δ18O anomaly has a magnitude
of ~1.5 ‰ (Fig. 5a), extends over all the TP and is also depicted in the vapor δ18O (~1.7 ‰, Fig. 5c).
We use a decomposition of the associated δ18O anomaly
into several terms, which account for the effects of rain-vapor disequilibrium, fractionation coefficients, local tem-perature, temperature at the source, local relative humidity, and residual effects including convection and large-scale transport (See Appendix in Supplementary Material). This approach shows a key role of changes in the intensity of Rayleigh distillation due to changes in temperature. In 1978–1979, LMDZ simulates TP regional cooling, consist-ent with meteorological data, which explains a depletion of about 0.7 ‰. Residual effects including large-scale trans-port however account for an additional depletion of about 1 ‰.
The pattern of changes in atmospheric circulation (Fig. 5c) depicts a reduced northward monsoon flow, and a large North-Easterly anomaly of −0.5 m/s (Fig. 5b, c). Combined with the average JJAS vapor δ18O South
West-North East gradient of about −2.4 × 10⁻³ ‰ per km
(Fig. 5b) and a residence time of water vapor of about 10 days, this anomalous circulation pattern can account for the residual anomaly of low-level water vapor δ18O
anom-aly of ~−1 ‰. The precipitation δ18O composition then
follows tightly that of the low-level water vapor, variations in precipitation-vapor differences accounting for less than 0.2 ‰ of precipitation variations.
The large-scale circulation effects are clearly visible in the latitudinal and vertical structure of JJAS zonal and meridional winds from NCEP reanalyses along a transect at 90°E for 1978 and 1983 (Fig. 5d, e). Regarding west-erly wind (U, Fig. 5d), the data depict a decrease of low level winds (<500 hPa) at 0°–20°N, and an increase of high level winds (500 hPa) at 20°N–30°N in 1983 compared to 1978. The meridional profile displays a decrease of the low atmosphere southerly winds in 1983 compared to 1978
(Fig. 5e). This illustrates the decrease of Indian monsoon and increase of westerlies in 1983 compared to 1978, con-sistent with the statistical analysis and the tele-connections evidenced in Sect. 3.4.
In summary, the abrupt depletion of NK δ18O in 1978
is captured by the LMDZiso simulation. It is mostly attrib-uted to a depletion of water vapor δ18O due to the change in
temperature and in large-scale atmospheric circulation. The effect of large-scale atmospheric circulation on vapor δ18O
is found to be larger than that of temperature.
4 Conclusions and perspectives
In this manuscript, we have reported the δ18O signal
recorded by a new Southern Tibetan ice core. In contrast with earlier studies, our record does not show unprec-edented warming during the last decades. It is dominated by decadal variations, including a remarkable isotopic depletion during the late 1970s. Statistical analyses stress a significant anti-correlation with precipitation amount Fig. 5 Attribution of the
precipitation δ18O anomaly
from 1978–1979 to 1982–1983 using the LMDZiso model. a Decomposition of the
precipita-tion δ18O anomaly into a sum of
five contributions due to rain-vapor disequilibrium (deseq), fractionation coefficients (α), temperature (T), local rela-tive humidity (h), and residual effects (residual) including con-vection and large-scale transport (see Appendix in Supplemen-tary Material). b Map showing the 1982–1983 pattern of JJAS
vapor δ18O at the lowest
atmos-pheric model level (colors) and pattern of JJAS winds at the lowest atmospheric level
(vec-tors). c Same as (b) but for the
difference between 1982 and 1983 and 1978–1979. Vertical profiles of difference between 1983 and 1978 for zonal (d) and meridional (e) winds along 90°E longitude from 30°S to 60°N, from NCEP reanalyses,
downloaded from http://www.
esrl.noaa.gov/psd/data/gridded/ data.ncep.reanalysis.derived. pressure.html. The grey shading depicts the TP topography. The
blue square shows the location
(p < 0.05) in the surrounding areas, as well as zonal wind at 500 hPa in the tropical Indo-Pacific oceans, and a positive correlation with precipitation amount in the Bay of Bengal, as well as with surface temperature in TP, India and sum-mer tropical SSTs. Significant relationships are detected with large-scale modes of variability (ENSO and PDO). The importance of large-scale atmospheric circulation is further supported by the ability of the atmospheric general circulation model LMDZiso to resolve the 1978 isotopic anomaly. The model shows that this anomaly extends over all of TP, and is positively related to an anomaly in water vapor δ18O in the tropical Indo-Pacific region. Within the
model framework, we isolated the driver of this anomaly, which is mostly due to an abnormal atmospheric circula-tion, marked by enhanced westerlies, and a reduced mon-soon flow, while air temperature also affects this anomaly through changes in Rayleigh distillation, but with a smaller effect than that of circulation alone.
This work demonstrates the ability of TP annual ice core δ18O to record abrupt shifts in atmospheric circulation
and provides a methodology to evaluate the magnitude of local versus large-scale controls on ice core δ18O. This will
motivate further integration of high-resolution precipitation δ18O records from multiple archives (ice cores, but also tree ring cellulose, speleothems and lake sediment records) in order to map the spatial and temporal variability of δ18O,
and to characterize past changes in regional atmospheric circulation.
Acknowledgments This work was funded by the National
Natu-ral Science Foundation of China (Grant Nos. 41471053, 41101061, 41190080 and 41125003), the “Strategic Priority Research Program (B)” of the Chinese Academy of Sciences (Grant No. XDB03030100), and China-France Caiyuanpei Program. We thank the staff which per-formed the ice core drilling and appreciate the important contribution of Huabiao Zhao, Mo Wang and Chenglong Zhang for ice cutting and dust samples measurements, as well as the support of Dongmei Qu for isotope measurements. We also thank Third Pole Environment
Database for some data support (http://www.tpedatabase.cn).
Open Access This article is distributed under the terms of the
Creative Commons Attribution 4.0 International License (http://crea-tivecommons.org/licenses/by/4.0/), which permits unrestricted use, distribution, and reproduction in any medium, provided you give appropriate credit to the original author(s) and the source, provide a link to the Creative Commons license, and indicate if changes were made.
References
Alexander MA, Blade I, Newman M, Lanzante JR, Lau NC, Scott JD (2002) The atmospheric bridge: the influence of ENSO telecon-nections on air–sea interaction over the global oceans. J Clim 15(16):2205–2231
Barnett TP, Pierce DW, Latif M, Dommenget D, Saravanan R (1999) Interdecadal interactions between the tropics and midlatitudes in the Pacific basin. Geophys Res Lett 26:615–618
Bradley RS, Vuille M, Hardy D, Thompson LG (2003) Low latitude ice cores record Pacific sea surface temperatures. Geophys Res
Lett 30(4):1174. doi:10.1029/2002GL016546
Breitenbach SFM, Adkins JF, Meyer H, Marwan N, Kumar KK, Haug GH (2010) Strong influence of water vapor source dynam-ics on stable isotopes in precipitation observed in Southern Meghalaya, NE India. Earth Planet Sci Lett 292(1–2):212–220. doi:10.1016/j.epsl.2010.01.038
Brown J, Simmonds I, Noone D (2006) Modeling delta o-18 in tropi-cal precipitation and the surface ocean for present-day climate. J
Geophys Res-Atmos. doi:10.1029/2004jd005611
Gao J, Tian L, Liu Y, Gong T (2009) Oxygen isotope variation in the water cycle of the Yamzho lake Basin in southern Tibetan
Plateau. Chin Sci Bull 54(16):2758–2765. doi:10.1007/
s11434-009-0487-6
Gao J, Masson-Delmotte V, Yao T, Tian L, Risi C, Hoffmann G (2011) Precipitation water stable isotopes in the south Tibetan Plateau:
observations and modeling. J Clim 24(13):3161–3178. doi:10.1
175/2010jcli3736.1
Gao J, Masson-Delmotte V, Risi C, He Y and Yao TD (2013) What controls precipitation 18O in the southern Tibetan Plateau at seasonal and intra-seasonal scales? A case study at Lhasa and
Nyalam. Tellus B 65(21043). http://dx.doi.org/10.3402/tellusb.
v65i0.21043
Gates WL (1992) AMIP: the atmospheric model intercomparison pro-ject. Bull Am Meteorol Soc 73(12):1962–1970
Grigholm B, Mayewski PA, Kang S, Zhang Y, Kaspari S, Sneed SB, Zhang Q (2009) Atmospheric soluble dust records from a Tibetan ice core: possible climate proxies and teleconnection
with the pacific decadal oscillation. J Geophys Res-Atmos. doi:1
0.1029/2008jd011242
Guilderson TP, Schrag DP (1998) Abrupt shift in subsurface tempera-tures in the tropical pacific associated with changes in El Nino.
Science 281(5374):240–243. doi:10.1126/science.281.5374.240
He Y et al (2015) Impact of atmospheric convection on south Tibet summer precipitation isotopologue composition using a combi-nation of in situ measurements, satellite data and atmospheric
general circulation modeling. J Geophys Res Atmos 120. doi:10.
1002/2014JD022180
Hoffmann G (2003) Taking the pulse of the tropical water cycle.
Sci-ence 301:776. doi:10.1126/science.1085066
Hoffmann G, Ramirez E, Taupin JD, Francou B, Ribstein P, Del-mas R, Durr H, Gallaire R, Simoes J, Schotterer U, Stievenard M, Werner M (2003) Coherent isotope history of andean ice
cores over the last century. Geophys Res Lett. doi:10.1029/200
2gl014870
Hou S, Qin D, Zhang D, Kang S, Mayewski PA, Wake CP (2003) A 154a high-resolution ammonium record from the Rong-buk Glacier, north slope of Mt. Qomolangma (Everest),
Tibet-Himal region. Atmos Environ 37(5):721–729. doi:10.1016/
S1352-2310(02)00582-4
Johnson KR, Ingram BL (2004) Spatial and temporal variability in the stable isotope systematics of modern precipitation in china: implications for paleoclimate reconstructions. Earth Planet Sci
Lett 220(3–4):365–377. doi:10.1016/s0012-821x(04)00036-6
Joswiak DR, Yao T, Wu G, Xu B, Zheng W (2010) A 70-yr record of oxygen-18 variability in an ice core from the Tanggula Moun-tains, central Tibetan Plateau. Clim Past 6(2):219–227
Kang S, Mayewski PA, Qin D, Yan Y, Hou S, Zhang D, Ren J, Kruetz K (2002) Glaciochemical records from a Mt. Everest ice core: relationship to atmospheric circulation over Asia. Atmos Environ
36(21):3351–3361. doi:10.1016/s1352-2310(02)00325-4
Kang S, Zhang Y, Qin D, Ren J, Zhang Q, Grigholm B, Mayewski PA (2007a) Recent temperature increase recorded in an ice core in the source region of Yangtze River. Chin Sci Bull 52(6):825–831. doi:10.1007/s11434-007-0140-1
Kang S, Qin D, Ren J, Zhang Y, Kaspari S, Mayewski PA, Hou S (2007b) Annual accumulation in the Mt. Nyainqentanglha ice core, southern Tibetan Plateau, China: relationships to atmospheric circulation over Asia. Arct Antarct Alp Res 39(4):663–670
Kaspari S, Mayewski P, Kang S, Sneed S, Hou S, Hooke R, Kreutz K, Introne D, Handley M, Maasch K, Qin D, Ren J (2007) Reduc-tion in northward incursions of the South Asian monsoon since approximate to 1400 ad inferred from a Mt. Everest ice core.
Geophys Res Lett. doi:10.1029/2007gl030440
Kelsey EP, Wake CP, Yalcin K, Kreutz K (2012) Eclipse ice core accumulation and stable isotope variability as an indicator of North Pacific climate. J Clim 25(18):6426–6440
Kreutz KJ, Mayewski PA, Pittalwala II, Meeker LD, Twickler MS, Whitlow SI (2000) Sea level pressure variability in the Amund-sen Sea region inferred from a West Antarctic glaciochemical
record. J Geophys Res-Atmos 105(D3):4047–4059. doi:10.1029
/1999jd901069
Krishnamurthy L, Krishnamurthy V (2013) Influence of PDO on South Asian summer monsoon and monsoon–ENSO relation. Clim Dyn 42(9–10):2397–2410
Li JP, Wang XLJ (2003) A modified zonal index and its physical
sense. Geophys Res Lett. doi:10.1029/2003gl017441
Liu XD, Chen BD (2000) Climatic warming in the Tibetan Plateau during recent decades. Int J Climatol 20(14):1729–1742
Lorenzo DE, Cobb KM, Furtado JC, Schneider N, Anderson BT, Bracco A, Alexander MA, Vimont DJ (2010) Central pacific El Nino and decadal climate change in the North Pacific ocean. Nat
Geosci 3(11):762–765. doi:10.1038/ngeo984
Mantua NJ, Hare SR (2002) The Pacific decadal oscillation. J Ocean-ogr 58:35–44
Mantua NJ, Hare SR, Zhang Y, Wallace JM, Francis RC (1997) A pacific interdecadal climate oscillation with impacts on salmon production. Bull Am Meteorol Soc 78(6):1069–1079
Meeker LD, Mayewski PA (2002) A 1400 year long record of atmos-pheric circulation over the North Atlantic and Asia. Holocene 12(3):257–266
Miller JA, Cayan DR, Barnett TP et al (1994) The 1976–77 climate shift of the Pacific Ocean. Oceanography 7(1):21–26
Miyasaka T, Nakamura H, Taguchi B, Nonaka M (2014) Multidec-adal modulations of the low-frequency climate variability in the wintertime North Pacific since 1950. Geophys Res Lett 41(8):2948–2955
Nakamura H, Lin G, Yamagata T (1997) Decadal climate variability in the North Pacific during the recent decades. Bull Am Meteorol Soc 78(10):2215–2225
Qin D, Mayewski PA, Wake CP et al (2000) Evidence for recent cli-mate change from ice cores in the central Himalayas. Ann Gla-ciol 31:153–158
Qin J, Yang K, Liang S, Guo X (2009) The altitudinal dependence of recent rapid warming over the Tibetan Plateau. Clim Change
97(1–2):321–327. doi:10.1007/s10584-009-9733-9
Rayner NA, Parker DE, Horton EB, Folland CK, Alexander LV, Row-ell DP, Kent EC, Kaplan A (2003) Global analyses of sea surface temperature, sea ice, and night marine air temperature since the
late nineteenth century. J Geophys Res-Atmos. doi:10.1029/200
2jd002670
Risi C, Bony S, Vimeux F, Jouzel J (2010) Water-stable isotopes in the LMDZ4 general circulation model: model evaluation for present-day and past climates and applications to climatic interpretations of tropical isotopic records. J Geophys Res-Atmos 115(d24123). doi:10.1029/2010jd015242
Rodionov SN (2004) A sequential algorithm for testing climate
regime shifts. Grophys Res Lett. doi:10.1029/2004GL019448
Sano M, Tshering P, Komori J, Fujita K, Xu C, Nakatsuka T (2013) May–september precipitation in the Bhutan Himalaya since 1743
as reconstructed from tree ring cellulose o-18. J Geophys
Res-Atmos 118(15):8399–8410. doi:10.1002/jgrd.50664
Schneider DP, Okumura Y, Deser C (2012) Observed Antarctic interannual climate variability and tropical linkages. J Clim 25(12):4048–4066
Steen-Larsen HC, Masson-Delmotte V, Hirabayashi M, Winkler R, Satow K, Prie F, Bayou N, Brun E, Cuffey KM, Dahl-Jensen D, Dumont M, Guillevic M, Kipfstuhl S, Landais A, Popp T, Risi C, Steffen K, Stenni B, Sveinbjornsdottir AE (2014) What controls the isotopic composition of Greenland surface snow? Clim Past
10(1):377–392. doi:10.5194/cp-10-377-2014
Thompson LG, Yao T, Mosley-Thompson E, Davis ME, Hender-son KA, Lin PN (2000) A high-resolution millennial record of the South Asian monsoon from Himalayan ice cores. Science
289(5486):1916–1919. doi:10.1126/science.289.5486.1916
Tian L, Masson-Delmotte V, Stievenard M, Yao T, Jouzel J (2001) Tibetan Plateau summer monsoon northward extent revealed by measurements of water stable isotopes. J Geophys Res-Atmos
106(D22):28081–28088. doi:10.1029/2001jd900186
Tian L, Yao T, Schuster PF, White JWC, Ichiyanagi K, Pendall E, Pu J, Wu Y (2003) Oxygen-18 concentrations in recent precipitation and ice cores on the Tibetan Plateau. J Geophys Res-Atmos. doi: 10.1029/2002jd002173
Tian L, Yao T, Yu W et al (2006) Stable isotopes of precipitation and ice core on the Tibetan Plateau and moisture transports. Quat Sci 26(2):145–152
Trenberth KE, Hurrell JW (1994) Decadal atmosphere-ocean varia-tions in the Pacific. Clim Dyn 9(6):303–319
Uppala SM et al (2005) The ERA-40 re-analysis. Q J R Meteorol Soc 131(612):2961–3012
Vimont DJ, Battisti DS, Hirst AC (2001) Footprinting: a seasonal con-nection between the tropics and mid-latitudes. Geophys Res Lett
28(20):3923–3926. doi:10.1029/2001gl013435
Vimont DJ, Wallace JM, Battisti DS (2003) The seasonal footprint-ing mechanism in the pacific: implications for ENSO. J Clim 16(16):2668–2675
Vuille M, Bradley RS, Werner M, Healy R, Keimig F (2003)
Mode-ling δ18O in precipitation over the tropical Americas, part I,
inter-annual variability and climatic controls. J Geophys Res 108 doi: 10.1029/2001JD002038
Vuille M, Werner M, Bradley RS, Keimig F (2005) Stable isotopes in precipitation in the Asian monsoon region. J Geophys
Res-Atmos. doi:10.1029/2005jd006022
Wang B, Ding QH (2006) Changes in global monsoon precipitation over
the past 56 years. Geophys Res Lett. doi:10.1029/2005gl025347
Wang N, Yao T, Pu J, Zhang Y, Sun W (2006) Climatic and environ-mental changes over the last millennium recorded in the Malan ice core from the northern Tibetan Plateau. Sci China Ser D
49(10):1079–1089. doi:10.1007/s11430-006-1079-9
Wang B, Bao Q, Hoskins B, Wu G, Liu Y (2008) Tibetan Plateau warming and precipitation changes in East Asia. Geophys Res
Lett. doi:10.1029/2008gl034330
Wu LX, Lee DE, Liu ZY (2005) The 1976/77 north pacific climate regime shift: the role of subtropical ocean adjustment and cou-pled ocean-atmosphere feedbacks. J Clim 18(23):5125–5140. doi:10.1175/jcli3583.1
Wu B, Li T, Zhou TJ (2010) Asymmetry of atmospheric circulation anomalies over the western North Pacific between El Niño and La Nia. J Clim 23(18):4807–4822
Xiao C, Mayewski PA, Qin D et al (2004) Sea level pressure vari-ability over the southern Indian Ocean inferred from a glacioc hemical record in Princess Elizabeth Land, East Antarctica. J
Geophys Res 109(DI6):DI6101. doi:10.1029/2003JD004065
Yao T, Shi Y, Thompson LG (1997) High resolution record of pale-oclimate since the Little Ice Age from the Tibetan ice cores.
Yao TD, Guo XJ, Thompson L, Duan KQ, Wang NL, Pu JC, Xu BQ, Yang XX, Sun WZ (2006a) Delta o-18 record and tempera-ture change over the past 100 years in ice cores on the Tibetan
Plateau. Sci China Ser D-Earth Sci 49(1):1–9. doi:10.1007/
s11430-004-5096-2
Yao TD, Li ZX, Thompson LG, Thompson EM, Wang YQ, Tian L,
Wang NL, Duan KQ (2006b) δ18O records from Tibetan ice cores
reveal differences in climatic changes. Ann Glaciol 43(1):1–7. doi:10.3189/172756406781812131
Yao T, Thompson L, Yang W, Yu W, Gao Y, Guo X, Yang X, Duan K, Zhao H, Xu B, Pu J, Lu A, Xiang Y, Kattel DB, Joswiak D (2012) Different glacier status with atmospheric circulations in Tibetan Plateau and surroundings. Nat Clim Change 2(9):663–
667. doi:10.1038/nclimate1580
Yao T, Masson-Delmotte V, Gao J, Yu W, Yang X, Risi C, Sturm C, Werner M, Zhao H, He Y, Ren W, Tian L, Shi C, Hou S (2013) A review of climatic controls on delta o-18 in precipitation over the Tibetan Plateau: observations and simulations. Rev Geophys. doi:10.1002/rog.20023
Yuan Y, Li C, Yang S (2014) Decadal anomalies of winter precipi-tation over southern China in association with El Niño and La Niña. Acta Meteorol Sin 72(2):237–255
Zhang Y, Wallace JM, Battisti DS (1997) ENSO-like interdecadal var-iability: 1900–1993. J Clim 10:1004–1020
Zhao H, Xu B, Yao T, Wu G, Lin S, Gao J, Wang M (2012) Deute-rium excess record in a southern Tibetan ice core and its poten-tial climatic implications. Clim Dyn 38(9–10):1791–1803. doi:10.1007/s00382-011-1161-7