Publisher’s version / Version de l'éditeur:
PERD/CHC Report 5 – 115, 2002-02
READ THESE TERMS AND CONDITIONS CAREFULLY BEFORE USING THIS WEBSITE.
https://nrc-publications.canada.ca/eng/copyright
Vous avez des questions? Nous pouvons vous aider. Pour communiquer directement avec un auteur, consultez la première page de la revue dans laquelle son article a été publié afin de trouver ses coordonnées. Si vous n’arrivez pas à les repérer, communiquez avec nous à [email protected].
Questions? Contact the NRC Publications Archive team at
[email protected]. If you wish to email the authors directly, please see the first page of the publication for their contact information.
NRC Publications Archive
Archives des publications du CNRC
For the publisher’s version, please access the DOI link below./ Pour consulter la version de l’éditeur, utilisez le lien DOI ci-dessous.
https://doi.org/10.4224/12340941
Access and use of this website and the material on it are subject to the Terms and Conditions set forth at Experimental Determination of Ice Rubble: Behaviour and Strength
Brown, T.; Lemee, E.
https://publications-cnrc.canada.ca/fra/droits
L’accès à ce site Web et l’utilisation de son contenu sont assujettis aux conditions présentées dans le site LISEZ CES CONDITIONS ATTENTIVEMENT AVANT D’UTILISER CE SITE WEB.
NRC Publications Record / Notice d'Archives des publications de CNRC:
https://nrc-publications.canada.ca/eng/view/object/?id=55b84dc2-cf6d-43ff-bddb-14942a50b9fe https://publications-cnrc.canada.ca/fra/voir/objet/?id=55b84dc2-cf6d-43ff-bddb-14942a50b9fe
Final Report
On
Experimental Determination of Ice Rubble
Behaviour and Strength
To
National Research Council of Canada PERD Ice/Structure Interaction Program
PERD/CHC Report 5 – 115
By
T.G. Brown and E. Lemee Department of Civil Engineering
The University of Calgary
Table of Contents
Chapter 1 Introduction ... 2
Chapter 2 Test Programme ... 4
Chapter 3 Test Programme Results... 9
Chapter 4 Analysis of Results... 25
Chapter 5 Conclusions and Recommendations... 37
References:... 39
List of Tables
Table 3.1 Test Summary 11
Table 3.2 Rubble Properties 15
Table 3.3 Results 16
List of Figures
Figure 2.1 Test Arrangement 7
Figure 2.2 Typical Test Result 8
Figure 3.1 Commercial Ice Size Distribution 19
Figure 3.2 Shear Strength vs. Speed, Rubble Thickness - 0.2 m 20 Figure 3.3 Shear Strength vs. Speed, Rubble Thickness - 0.3 m 21 Figure 3.4 Shear Strength vs. Speed, Rubble Thickness - 0.4 m 22 Figure 3.5 Extended Shear Strength vs. Speed, Rubble Thickness - 0.4 m 23 Figure 3.6 Shear Strength vs. Speed, Commercial Ice, Rubble Thickness - 0.4 m 24 Figure 4.1 Shear Strength VS. Speed, Rubble Thickness - 0.2 m, Zero Consolidation 27 Figure 4.2 Shear Strength VS. Speed, Rubble Thickness - 0.2 m, One Hour Consolidation 27 Figure 4.3 Shear Strength VS. Speed, Rubble Thickness - 0.3 m, Zero Consolidation 29 Figure 4.4 Shear Strength VS. Speed, Rubble Thickness - 0.3 m, One Hour Consolidation 30 Figure 4.5 Shear Strength VS. Speed, Rubble Thickness - 0.4 m, Zero Consolidation 31 Figure 4.6 Shear Strength VS. Speed, Rubble Thickness - 0.4 m, One Hour Consolidation 32 Figure 4.7 Summary of Shear Strength, Rubble Thickness - 0.4 m, Zero Consolidation 33 Figure 4.8 Friction Angle vs. Speed, Rubble Thickness - 0.4 m, Zero Consolidation 34
Figure 4.9 Phi from Punch Tests 35
2
Chapter 1 Introduction
This report describes the results of a comprehensive test series as part of an on-going programme of research into the behaviour and properties of ice rubble during vertical plane-strain plunge tests. Previous testing of model ice rubble, both in the laboratory and in-situ, has usually involved either vertical plunge tests through the rubble, or horizontal shear box testing; in both cases there is considerable uncertainty regarding the behaviour of the ice rubble, and specifically, the nature of the failure planes. The previous tests (Brown and Azarnejad, 1997, Azarnejad and Brown, 1999, 2001) have provided considerable insight into the behaviour of ice rubble, providing a visual record of failure characteristics, and identifying clear evidence of an effect of speed on the behaviour. Nevertheless, a number of parameters have not yet been fully investigated, and the issue of the differences in behaviour that are observed at different speeds (Azarnejad and Brown, 2001) warrants further investigation.
As a reference test for the strength of ice rubble in model ridges, the plunge test has some attractions. It can be conducted away from the test location of the ridge, disturbs only a small portion of the rubble, and leaves the ice largely in place, an advantage when being used as a measure of rubble strength in ice tanks. The disadvantage of the plunge test is that the nature of the failure planes is unknown, although underwater video has been used on some of the previous tests (McKenna et al, 1996). This video, taken looking up at the underside of the rubble, has provided some information on the nature of the failure plane as it intersects the base of the rubble, but not of the failure planes. A full scale version of the plunge test can be conducted on sea ice ridges, and, indeed, there have now been a number of field test programmes using the plunge test (Lepparanta and Hakala, 1992; Croasdale et al, 1996; Heinonen et al, 2000).
The current test programme focussed on three variables: the platen speed, and the ice block size and the gradation of the size of the ice blocks. The investigation of the speed effects was an outcome of the identification of two different forms of behaviour of the rubble at different platen speeds. At high speeds (> 80 mm/sec) there are no well-defined failure planes, and the ice
rubble behaviour in the failure regions is chaotic. At lower speeds (< 30 mm/sec) the failure planes are quite well-defined with very little motion of blocks immediately outside the failure plane. In order to more closely identify the transition between the two forms of behaviour, a number of tests were carried out at intermediate speeds (in the range 30 to 60 mm/sec). An examination of the characteristics of the failure planes had also suggested that the size, and size gradation, of the pieces in the ice rubble may play a role in defining this behaviour.
This report briefly describes the tests carried out in the current phase, the results obtained, and provides further analyses of these results.
Following this introduction, Chapter 2 describes the test program, Chapter 3 the results of the current tests, while Chapter 4 presents analyses of the current and past tests. Finally Chapter 5 presents the conclusions and some recommendations.
4
Chapter 2 Test Programme
The rational for the experimental design was that the test should closely approximate the in-situ plunge tests as conducted on model rubble formations and in full-scale. The experimental set-up was designed to facilitate observing the characteristics of the resulting failure planes. Because it is more difficult to identify failure planes when they are three-dimensional, the tests were conducted using a rectangular platen which spanned the full width of the test apparatus, thus reducing the test from three-dimensions to two dimensions. The test tank was constructed using Perspex that permitted the observation of the failure planes from the sides of the test apparatus. Otherwise, the tests were conducted in much the same way as the ice tank and in-situ tests, with the platen being forced vertically down through the ice rubble, and the resulting force and displacement being measured.
The test apparatus is shown in Figure 2.1 and consists of a 0.5 m × 0.9 m × 2.45 m Perspex tank and load system supported by a steel frame. The tank dimensions were designed such that there was enough buoyancy force and friction on the non-loaded portion of the rubble to resist the applied loads. Friction at the ends of the tank (Figure 2.1) was increased by gluing small rectangular pieces of Perspex to the walls of the tank. The centre section of the tank was kept clear to avoid interfering with the failure mode of the rubble, and to permit viewing and recording the failure mode.
Load was applied through a rectangular platen attached to one end of a hydraulic ram, and monitored using a 2 kN load cell. The hydraulic ram had a maximum stroke and rate of 0.75 m and 0.12 m/s respectively. The platen was 0.25 m by 0.5 m, machined from 0.019 m (3/4″) thick aluminum plate. The long side of the platen covers almost the entire width of the tank, leaving only a small gap of several millimeters at the two ends to avoid contact, and the resulting friction between the platen and the walls. The friction forces would contaminate the load recorded by the load cell. Displacement of the platen was measured using a linear potentiometer with a maximum stroke of 0.355 m.
Ice was obtained from three sources: standard ice making machines, a specially purchased machine that produces larger ice pieces, and ice purchased commercially. All of the ice used was fresh water ice and was stored in a freezer, prior to use. The ice obtained from the standard ice making machines was 5 mm by 8 mm by 20 mm. The larger ice pieces provided by the specially purchased machine were 35 x 35 x 15 mm, but tended to be somewhat hollowed. The ice obtained commercially was graded with a maximum piece size of >56 mm.
The tank was filled with fresh water, and then the required amount of ice was placed to the desired depth, and levelled to ensure a uniform depth. When placed in the tank, the ice rubble can be described as a loose agglomeration of small blocks, lacking cohesion. A thermocouple measures the room temperature. All of the tests were documented using a digital video camera, looking through one side of the tank.
Tests that are described as “zero ageing” were conducted as soon as possible after the ice had been placed in the tank. The premise was that there has not been sufficient time for significant cohesive bonds to form prior to the loading of the rubble. However, as illustrated in the chapter 3, the conditions in the tank, and when the ice was placed, clearly play a significant role in determining the consolidated conditions of the ice rubble. For tests for which consolidation was planned, any fully consolidated layer that had previously formed at the surface was broken and the ice rubble was stirred to break the bonds between the ice pieces and provide a uniform thickness of rubble. The room was subsequently kept at a constant temperature at –2°C for the required number of hours of ageing. It was observed in previous test programmes that, for consolidation periods greater than one hour, the consolidated layer developed significant strength and the ultimate load included the flexural failure of this layer. Therefore for any curing periods (one hour or more), the consolidated layer was cut with a saw along the long (0.5 m) sides of the platen across the width of the tank, before applying the load. The saw cuts were made within 5 mm of the edge of the platen, so as to ensure that there was no interaction between the isolated
6 portion and the rest of the consolidated layer. Any bond between the rubble and the sides of the tank was also broken at this time.
Once the rubble has been prepared for the test, the test was conducted by forcing the platen down through the ice at a controlled rate. Experience has allowed a selection of platen speeds at various intervals between 12 mm/sec and 115 mm/sec. For this test series, platen speeds of 12mm/sec, 25 mm/sec. 30 mm/sec, 45mm/sec and 115 mm/sec, were used. The load and displacement were recorded at a frequency 30Hz. The data is recorded on a laboratory computer, and subsequently input into an Excel spreadsheet for analysis.
Figure 2.2 illustrates a typical load and displacement plot from one test. In order to obtain the maximum deflection corresponding to the peak load, the time corresponding to zero deflection is selected by examining the plots from the data. The recorded displacement at this time was then subtracted from the recorded displacement at the time of maximum load to obtain the displacement at peak load.
8
Figure 2.2 Typical Result Plot
0 50 100 150 200 250 300 350 400 0 5 10 15 20 25 Time (secs) Displacement (mm) 0 20 40 60 80 100 120 Load (N) Displacement Load
Chapter 3 Test Programme Results
The current test programme focussed on an investigation of: the effect of block size, further assessment of the effect of speed, and the identification of the threshold speed associated with the change in behaviour (Azernejad and Brown, 2001). In total, 112 tests were conducted using the three different block configurations. The tests are listed in Table 3.1 with the relevant parameters. As indicated previously, the larger block size was hollow, and therefore the resulting rubble was of higher porosity than the rubble from the smaller blocks. Table 3.2 summarises the basic properties of the rubble resulting from the three different sources of ice blocks.
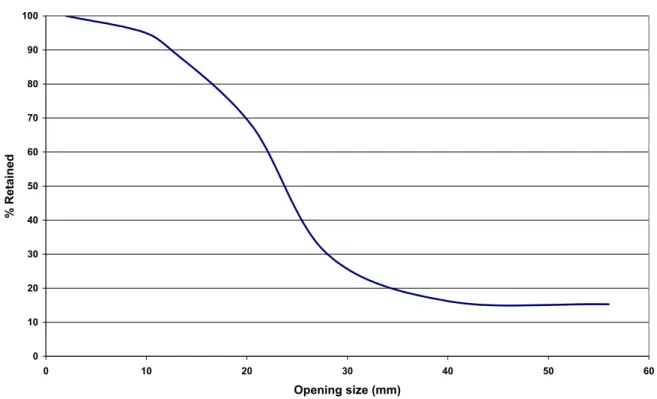
The commercial ice came in a variety of piece sizes, with a maximum size that was greater than 56 mm. A sample of the ice was sieved in the cold room and the results of this analysis are presented in Figure 3.1. Although the gradation of piece sizes permitted more close packing of the ice pieces, the overall porosity (0.386) was still greater than the historically expected values in the 0.2 to 0.3 range.
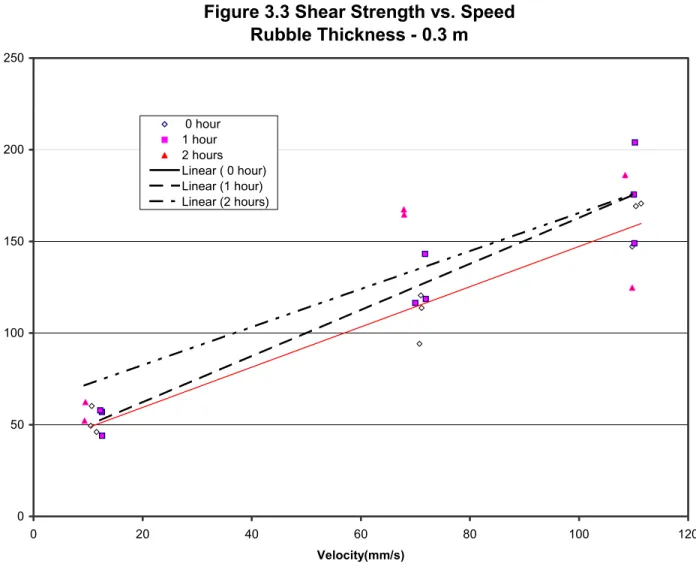
The results of the current series of test are presented in Table 3.3. The “b_ice” tests represent the basic set of tests using the larger ice blocks. Tests were conducted for three different rubble ice thicknesses, three platen speeds, and three periods of consolidation. The results of these tests are shown in Figures 3.2 to 3.4 as plots of effective shear strength against velocity, for the 20 cm, 30 cm, and 40 cm deep rubble respectively. While the 20 cm deep rubble results clearly suggest some effect of consolidation on strength, this becomes less apparent with the deeper rubble. This, however, is not altogether surprising, given that the periods of consolidation for the three different rubble depths are identical.
The tests identified as “speed”, were carried out in an attempt to further identify the transition between behaviour that is clearly that of soils, and can be described as Mohr-Coulomb, and the behaviour at higher platen speeds that does not appear to fit this form of behaviour.
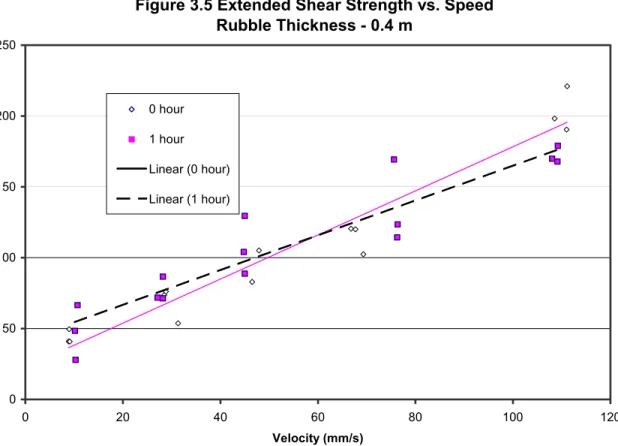
10 Accordingly, a set of tests for two periods of consolidation was carried out at two intermediate velocities: 30 mm/sec and 45 mm/sec. All tests were carried out with the larger rubble pieces, and at a rubble depth of 40 cm. The results of the complete set of tests for the larger ice pieces, at a rubble depth of 40 cm, are presented in Figure 3.5, for zero, and one hour, consolidation.
The results presented in Table 3.3, for tests identified as “test” and “arc”, were carried out using the commercial ice. All tests were carried out at zero hours consolidation and with a rubble depth of 40 cm. For the second test series, identified as “arc”, the ice had not previously been stored in a freezer. The ice was therefore significantly warmer than the ice in the corresponding tests identified as “test” when placed in the tank. As is shown in Chapter 4, the differences in the two sets of results were quite significant.
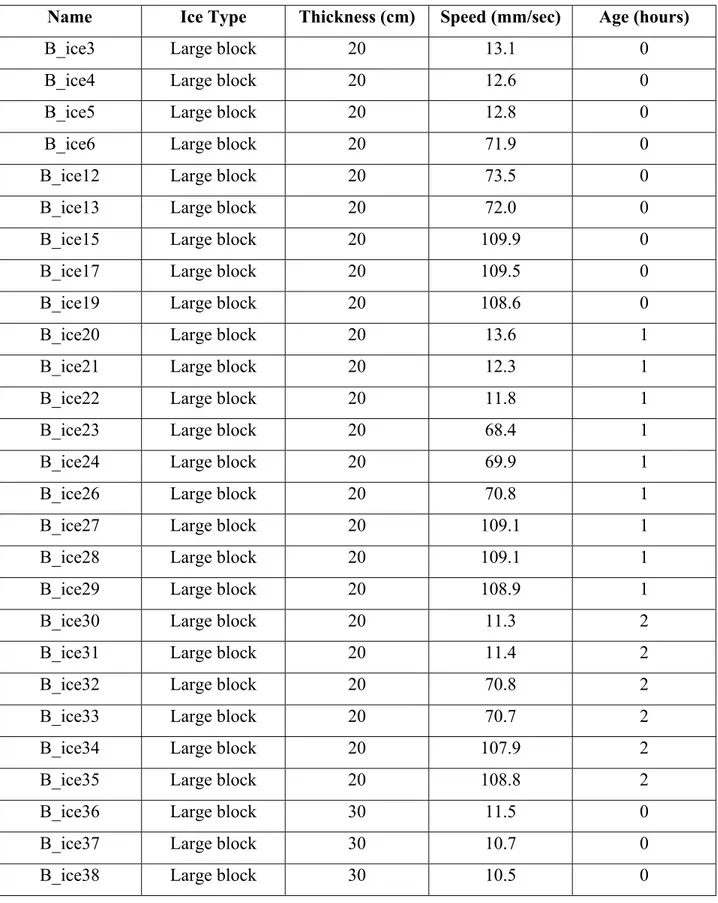
Table 3.1 Test Summary
Name Ice Type Thickness (cm) Speed (mm/sec) Age (hours)
B_ice3 Large block 20 13.1 0
B_ice4 Large block 20 12.6 0
B_ice5 Large block 20 12.8 0
B_ice6 Large block 20 71.9 0
B_ice12 Large block 20 73.5 0
B_ice13 Large block 20 72.0 0
B_ice15 Large block 20 109.9 0
B_ice17 Large block 20 109.5 0
B_ice19 Large block 20 108.6 0
B_ice20 Large block 20 13.6 1
B_ice21 Large block 20 12.3 1
B_ice22 Large block 20 11.8 1
B_ice23 Large block 20 68.4 1
B_ice24 Large block 20 69.9 1
B_ice26 Large block 20 70.8 1
B_ice27 Large block 20 109.1 1
B_ice28 Large block 20 109.1 1
B_ice29 Large block 20 108.9 1
B_ice30 Large block 20 11.3 2
B_ice31 Large block 20 11.4 2
B_ice32 Large block 20 70.8 2
B_ice33 Large block 20 70.7 2
B_ice34 Large block 20 107.9 2
B_ice35 Large block 20 108.8 2
B_ice36 Large block 30 11.5 0
B_ice37 Large block 30 10.7 0
12
Name Ice Type Thickness (cm) Speed (mm/sec) Age (hours)
B_ice39 Large block 30 71.1 0
B_ice40 Large block 30 71.0 0
B_ice42 Large block 30 70.8 0
B_ice43 Large block 30 111.4 0
B_ice44 Large block 30 110.4 0
B_ice45 Large block 30 109.7 0
B_ice46 Large block 30 12.5 1
B_ice47 Large block 30 12.6 1
B_ice48 Large block 30 12.2 1
B_ice51 Large block 30 70.0 1
B_ice54 Large block 30 71.9 1
B_ice55 Large block 30 71.8 1
B_ice56 Large block 30 110.1 1
B_ice57 Large block 30 110.2 1
B_ice58 Large block 30 110.0 1
B_ice59 Large block 30 9.5 2
B_ice60 Large block 30 9.4 2
B_ice61 Large block 30 67.9 2
B_ice62 Large block 30 67.9 2
B_ice63 Large block 30 108.4 2
B_ice66 Large block 30 109.7 2
B_ice67 Large block 40 9.0 0
B_ice68 Large block 40 9.1 0
B_ice69 Large block 40 8.9 0
B_ice72 Large block 40 66.8 0
B_ice73 Large block 40 67.7 0
B_ice75 Large block 40 69.3 0
Name Ice Type Thickness (cm) Speed (mm/sec) Age (hours)
B_ice79 Large block 40 111.1 0
B_ice81 Large block 40 111.0 0
B_ice82 Large block 40 10.2 1
B_ice83 Large block 40 10.3 1
B_ice85 Large block 40 10.7 1
B_ice86 Large block 40 76.3 1
B_ice88 Large block 40 76.4 1
B_ice89 Large block 40 75.6 1
B_ice90 Large block 40 109.1 1
B_ice91 Large block 40 109.2 1
B_ice93 Large block 40 108.0 1
Speed14 Large block 40 31.3 0
Speed15 Large block 40 28.5 0
Speed17 Large block 40 28.8 0
Speed18 Large block 40 47.9 0
Speed19 Large block 40 47.5 0
Speed20 Large block 40 46.5 0
Speed22 Large block 40 28.2 1
Speed25 Large block 40 28.2 1
Speed26 Large block 40 27.1 1
Speed27 Large block 40 44.8 1
Speed34 Large block 40 45.0 1
Speed36 Large block 40 45.0 1
Test6 Commercial 40 10.9 0
Test8 Commercial 40 10.9 0
Test9 Commercial 40 11.6 0
Test10 Commercial 40 28.8 0
14
Name Ice Type Thickness (cm) Speed (mm/sec) Age (hours)
Test12 Commercial 40 28.7 0 Test13 Commercial 40 48.0 0 Test14 Commercial 40 48.0 0 Test15 Commercial 40 48.0 0 Test16 Commercial 40 72.1 0 Test17 Commercial 40 77.2 0 Arc1 Commercial 40 11.1 0 Arc3 Commercial 40 11.3 0 Arc4 Commercial 40 11.7 0 Arc5 Commercial 40 24.1 0 Arc6 Commercial 40 24.4 0 Arc7 Commercial 40 24.4 0 Arc8 Commercial 40 35.6 0 Arc9 Commercial 40 35.7 0 Arc10 Commercial 40 35.2 0 Arc11 Commercial 40 49.2 0 Arc12 Commercial 40 49.6 0 Arc13 Commercial 40 48.7 0 Arc14 Commercial 40 80.8 0 Arc15 Commercial 40 79.6 0 Arc16 Commercial 40 79.9 0 Arc17 Commercial 40 104.6 0 Arc18 Commercial 40 104.3 0 Arc19 Commercial 40 12.6 0 Arc20 Commercial 40 25.9 0 Arc21 Commercial 40 38.1 0 Arc22 Commercial 40 24.2 0 Arc23 Commercial 40 24.1 0
Table 3.2 Rubble Properties
Rubble Type Density Porosity
Small block 0.895 0.5
Large Block 0.939 0.648
16 Table 3.3 Results File Name Velocity (mm/s) Height (m) Age (hrs) Peak (N) Residual (N) Inertia (N) Shear Strength (Pa) Net Force (N) phi(deg) b_ice3 13.09 0.2 0 47.8 42 2.158 18.581 3.642 24.30 b_ice4 12.58 0.2 0 60 46.2 2.061 59.893 11.739 55.52 b_ice5 12.85 0.2 0 47.2 42.2 2.112 14.736 2.888 19.70 b_ice6 71.94 0.2 0 78.6 48 13.340 88.061 17.260 64.97 b_ice12 73.51 0.2 0 72.2 39.8 13.638 95.725 18.762 66.76 b_ice13 72.04 0.2 0 78 42 13.358 115.519 22.642 70.42 b_ice15 109.9 0.2 0 76 32.4 20.554 117.581 23.046 70.73 b_ice17 109.5 0.2 0 87.6 38.2 20.472 147.590 28.928 74.45 b_ice19 108.6 0.2 0 82 40 20.302 110.702 21.698 69.63 b_ice20 13.57 0.2 1 51.6 41.6 2.250 39.541 7.750 43.86 b_ice21 12.30 0.2 1 62.4 47.6 2.009 65.262 12.791 57.78 b_ice22 11.79 0.2 1 50.8 38.4 1.911 53.513 10.489 52.45 b_ice23 68.45 0.2 1 79 46 12.676 103.692 20.324 68.38 b_ice24 69.89 0.2 1 72.8 36.2 12.949 120.667 23.651 71.19 b_ice26 70.78 0.2 1 80.6 43.6 13.119 121.840 23.881 71.36 b_ice27 109.1 0.2 1 93.8 37.4 20.393 183.710 36.007 77.40 b_ice28 109.1 0.2 1 98.8 41.2 20.405 189.771 37.195 77.80 b_ice29 108.9 0.2 1 95.6 44.2 20.365 158.342 31.035 75.46 b_ice30 11.31 0.2 2 50.2 40 1.819 42.759 8.381 46.10 b_ice31 11.44 0.2 2 56 42.2 1.844 61.002 11.956 56.01 b_ice32 70.84 0.2 2 70 33 13.131 121.779 23.869 71.35 b_ice33 70.67 0.2 2 76 34.8 13.098 143.376 28.102 74.01 b_ice34 107.9 0.2 2 96.6 34.8 20.181 212.342 41.619 79.06 b_ice35 108.8 0.2 2 98.4 33.8 20.351 225.759 44.249 79.70 b_ice36 11.55 0.3 0 63.2 47.8 1.865 46.036 13.535 36.72 b_ice37 10.66 0.3 0 65.2 45.8 1.696 60.216 17.704 44.29 b_ice38 10.49 0.3 0 61.2 45 1.664 49.442 14.536 38.69 b_ice39 71.13 0.3 0 100 53.4 13.185 113.657 33.415 61.51 b_ice40 71.00 0.3 0 102 53.4 13.160 120.543 35.440 62.90 b_ice42 70.76 0.3 0 92.6 51.8 13.115 94.167 27.685 56.77 b_ice43 111.4 0.3 0 119.2 48.2 20.829 170.648 50.171 70.14 b_ice44 110.4 0.3 0 118 47.6 20.650 169.218 49.750 69.98 b_ice45 109.7 0.3 0 117.2 53.4 20.521 147.207 43.279 67.27 b_ice46 12.54 0.3 1 64.2 45.4 2.054 56.959 16.746 42.70 b_ice47 12.57 0.3 1 56.6 41.6 2.059 44.015 12.941 35.49 b_ice48 12.24 0.3 1 60.2 41.2 1.996 57.836 17.004 43.14 b_ice51 69.97 0.3 1 85.4 38.2 12.966 116.442 34.234 62.09 b_ice54 71.89 0.3 1 98.6 50.4 13.330 118.605 34.870 62.52 b_ice55 71.76 0.3 1 100.4 45 13.305 143.179 42.095 66.70
File Name Velocity (mm/s) Height (m) Age (hrs) Peak (N) Residual (N) Inertia (N) Shear Strength (Pa) Net Force (N) phi(deg) b_ice56 110.1 0.3 1 108.2 43.8 20.598 148.988 43.802 67.52 b_ice57 110.2 0.3 1 123.4 42.8 20.615 204.029 59.985 73.19 b_ice58 110.0 0.3 1 116.4 44.2 20.577 175.590 51.623 70.65 b_ice59 9.52 0.3 2 70.4 50.6 1.481 62.310 18.319 45.27 b_ice60 9.35 0.3 2 73.8 57 1.448 52.217 15.352 40.23 b_ice61 67.95 0.3 2 92.8 31.8 12.582 164.689 48.419 69.48 b_ice62 67.87 0.3 2 106.4 44.6 12.566 167.462 49.234 69.79 b_ice63 108.4 0.3 2 115.2 40.2 20.276 186.135 54.724 71.68 b_ice66 109.7 0.3 2 99.2 42 20.521 124.758 36.679 63.69 b_ice67 8.97 0.4 0 83 62.2 1.376 49.550 19.424 31.05 b_ice68 9.11 0.4 0 98.4 81 1.402 40.812 15.998 26.37 b_ice69 8.89 0.4 0 94.2 76.8 1.360 40.920 16.040 26.43 b_ice72 66.79 0.4 0 111.4 51.8 12.362 120.505 47.238 55.68 b_ice73 67.71 0.4 0 114.4 54.8 12.536 120.061 47.064 55.58 b_ice75 69.31 0.4 0 115.8 62.8 12.839 102.451 40.161 51.23 b_ice77 108.55 0.4 0 163 65 20.296 198.223 77.704 67.47 b_ice79 111.1 0.4 0 165.4 58 20.783 220.963 86.617 69.59 b_ice81 111.0 0.4 0 158.6 63.2 20.758 190.413 74.642 66.64 b_ice82 10.17 0.4 1 86.2 65.6 1.604 48.460 18.996 30.49 b_ice83 10.29 0.4 1 80.6 68 1.626 27.994 10.974 18.78 b_ice85 10.70 0.4 1 92.8 65 1.703 66.573 26.097 38.97 b_ice86 76.25 0.4 1 119.2 60.2 14.159 114.392 44.842 54.27 b_ice88 76.35 0.4 1 124.8 62.2 14.178 123.525 48.422 56.34 b_ice89 75.60 0.4 1 139 58.6 14.035 169.298 66.365 64.09 b_ice90 109.1 0.4 1 140.8 54.6 20.405 167.845 65.795 63.90 b_ice91 109.2 0.4 1 140.6 50 20.418 179.037 70.182 65.33 b_ice93 108.0 0.4 1 140.4 53.6 20.198 169.904 66.602 64.17 speed14 31.3 0.4 0 39 12.3 5.618 53.781 21.082 33.16 speed15 28.5 0.4 0 101 67 5.086 73.760 28.914 41.87 speed17 28.8 0.4 0 87 52 5.143 76.166 29.857 42.78 speed22 28.2 0.4 1 87 54 5.029 71.355 27.971 40.93 speed25 28.2 0.4 1 97 58 5.029 86.661 33.971 46.48 speed26 27.1 0.4 1 86 53 4.820 71.888 28.180 41.14 speed18 47.9 0.4 0 111 61 8.772 105.173 41.228 51.96 speed19 47.5 0.4 0 36 17 8.696 26.286 10.304 17.71 speed20 46.5 0.4 0 94 53 8.506 82.893 32.494 45.21 speed27 44.8 0.4 1 98 49 8.183 104.125 40.817 51.68 speed34 45 0.4 1 98 55 8.221 88.722 34.779 47.15 speed36 45 0.4 1 111 52 8.221 129.538 50.779 57.58 test6 10.9 0.4 0 131 101 1.742 72.087 28.258 22.10 test8 10.9 0.4 0 109 76 1.742 79.740 31.258 24.19
18 File Name Velocity (mm/s) Height (m) Age (hrs) Peak (N) Residual (N) Inertia (N) Shear Strength (Pa) Net Force (N) phi(deg) test9 11.6 0.4 0 115 75 1.875 97.258 38.125 28.72 test10 28.8 0.4 0 112 72 5.143 88.921 34.857 26.61 test11 25 0.4 0 148 98 4.421 116.273 45.579 33.23 test12 28.7 0.4 0 137 80 5.124 132.337 51.876 36.71 test13 48 0.4 0 107 59 8.791 100.023 39.209 29.40 test14 48 0.4 0 151 86 8.791 143.390 56.209 38.94 test15 48 0.4 0 140 71 8.791 153.594 60.209 40.88 test16 72.1 0.4 0 166 81 13.370 182.730 71.630 45.84 test17 77.2 0.4 0 148 78 14.339 141.992 55.661 38.66 arc1 11.1 0.4 0 106 79 1.780 64.337 25.220 19.92 arc3 11.3 0.4 0 109 77 1.818 76.995 30.182 23.45 arc4 11.7 0.4 0 103 72 1.894 74.250 29.106 22.70 arc5 24.1 0.4 0 109 69 4.250 91.199 35.750 27.20 arc6 24.4 0.4 0 99 62 4.307 83.401 32.693 25.17 arc7 24.4 0.4 0 106 65 4.307 93.605 36.693 27.81 arc8 35.6 0.4 0 95 63 6.435 65.217 25.565 20.17 arc9 35.7 0.4 0 101 59 6.454 90.679 35.546 27.06 arc10 35.2 0.4 0 103 62 6.359 88.370 34.641 26.47 arc11 49.2 0.4 0 115 66 9.019 101.992 39.981 29.88 arc12 49.6 0.4 0 100 61 9.095 76.288 29.905 23.26 arc13 48.7 0.4 0 109 61 8.924 99.684 39.076 29.32 arc14 80.8 0.4 0 123 66 15.023 107.084 41.977 31.10 arc15 79.6 0.4 0 130 66 14.795 125.523 49.205 35.27 arc16 79.9 0.4 0 119 63 14.852 104.969 41.148 30.60 arc17 104.6 0.4 0 145 64 19.545 156.773 61.455 41.46 arc18 104.3 0.4 0 143 61 19.488 159.469 62.512 41.94 arc19 12.6 0.4 0 114 77 2.065 89.120 34.935 26.66 arc20 25.9 0.4 0 91 60 4.592 67.367 26.408 20.78 arc21 38.1 0.4 0 112 73 6.910 81.862 32.090 24.76 arc22 24.2 0.4 0 95 56 4.269 88.599 34.731 26.53 arc23 24.1 0.4 0 98 56 4.250 96.301 37.750 28.48
Figure 3.1 Sieve Analysis of Commercial Ice 0 10 20 30 40 50 60 70 80 90 100 0 10 20 30 40 50 60 Opening size (mm) % Retained
20
Figure 3.2 Shear Strength vs. Speed Rubble Thickness - 0.2 m 0 50 100 150 200 250 0 20 40 60 80 100 120 Velocity (mm/s) 0 hour 1 hour 2 hours Linear (0 hour) Linear (1 hour) Linear (2 hours)
Figure 3.3 Shear Strength vs. Speed Rubble Thickness - 0.3 m 0 50 100 150 200 250 0 20 40 60 80 100 120 Velocity(mm/s) 0 hour 1 hour 2 hours Linear ( 0 hour) Linear (1 hour) Linear (2 hours)
22
Figure 3.4 Shear Strength vs. Speed Rubble Thickness - 0.4 m 0 50 100 150 200 250 0 20 40 60 80 100 120 Velocity (mm/s) 0 hour 1 hour Linear (0 hour) Linear (1 hour)
Figure 3.5 Extended Shear Strength vs. Speed Rubble Thickness - 0.4 m 0 50 100 150 200 250 0 20 40 60 80 100 120 Velocity (mm/s) 0 hour 1 hour Linear (0 hour) Linear (1 hour)
24
Figure 3.6 Shear Strength vs. Speed Commercial Ice, Rubble Thickness - 0.4 m
y = 0.7387x + 63.288 0 20 40 60 80 100 120 140 160 180 0 20 40 60 80 100 120 Velocity (mm/s)
Shear Strength (Pa)
0 hour Linear (0 hour)
Chapter 4 Analysis of Results
The primary foci of the current series of experiments and their analysis, has been the effect of piece size on the shear strength, and derived properties of the rubble, and later, closer investigation of the effect of speed on the behaviour of the ice rubble.
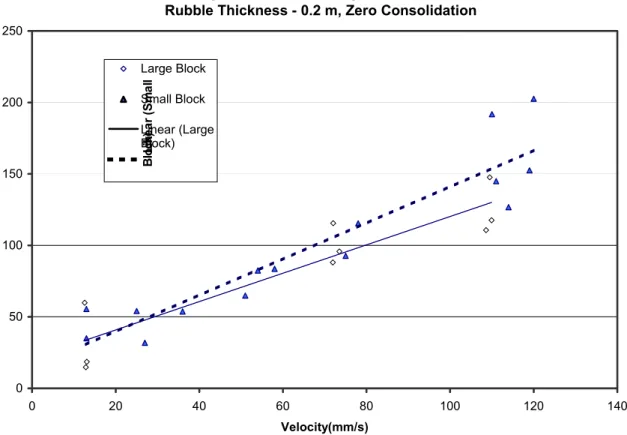
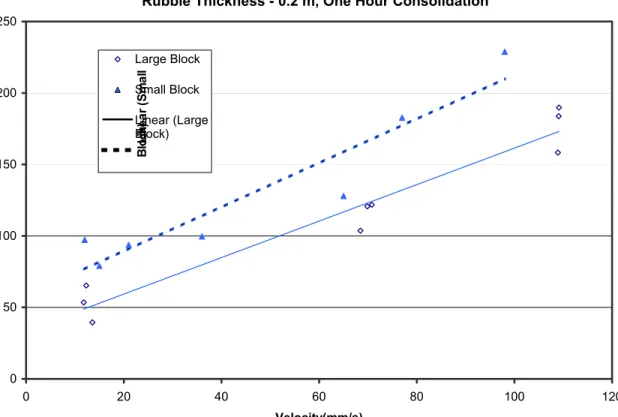
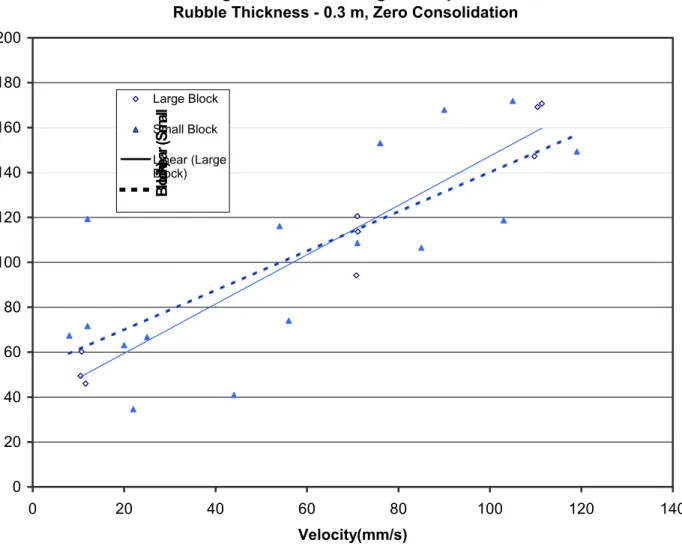
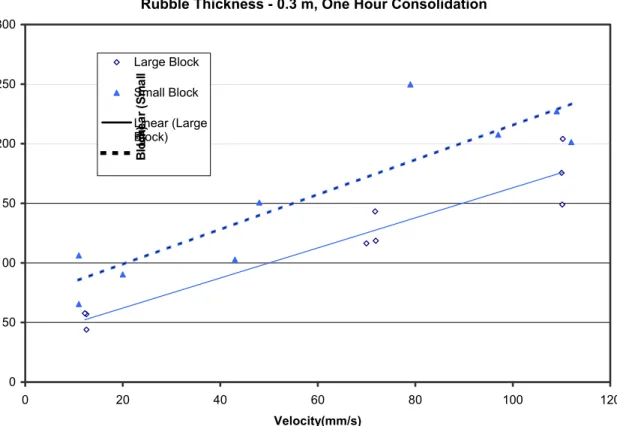
To assess the effect of piece size, Figures 4.1 to 4.6 provide comparisons between the results for the two uniform piece sizes used: the smaller sizes used in previous work, and the larger piece size used in the current work and reported in Chapter 3. Figure 4.1 and 4.2 compare the results for 20 cm deep rubble, for zero hour and one hour consolidation times respectively. Figures 4.3 and 4.4 provide the corresponding results for 30 cm deep rubble, Figure 4.5 and 4.6 for 40 cm deep rubble.
While there is little difference in the results when there has been no consolidation, the results after one hour consolidation do show some difference, with the behaviour of the smaller blocks being characterised by a higher effective shear strength. This is consistent at all rubble depths. There may be several reasons for this difference in behaviour, including the greater porosity of the larger blocks, and the potential that the greater number of contacts between blocks that occurs with the smaller blocks, both of which would result in a higher effective shear strength. Figure 4.7 presents the results of Figure 4.5 with the results from the graded commercial ice added. From this Figure, it is apparent that the strength of the graded ice is greater at the low platen speeds, but is significantly less at the higher speeds. This difference in relative strength may be consistent with the differences in behaviour observed in the other tests, where the graded ice would result in higher strength if the behaviour was typical of granular materials at the slow speeds. At the higher speeds, where hydrodynamic effects are more prevalent, the variation in piece size may be result in the lower effective strength.
Figure 4.8 presents the results of Figure 4.7 as an effective friction angle, ϕ. However, the results presented in Figure 4.8 show no difference from the results of effective shear strength, despite the differences in porosity. Figure 4.9 also presents the results for friction angle, but
26 presents the results for both sets of tests using the commercial, graded, ice. Here, the differences in the results for the two sets of tests are quite apparent. Not surprising, the tests carried out with the warmer ice, not previously stored in the freezer, result in lower effective friction angle than the results for the tests carried out with the colder ice.
Finally, Figure 4.10 plots the results for the friction angle for the three different ice types used to date, but with the lower speed tests separated from the higher speed tests. The linear regression lines clearly suggest that there is a difference in the friction angle/speed relation within the two speed ranges. At the lower speeds, the behaviour, based on the video record, exhibits well defined failure planes, in keeping with classical soil behaviour. At the higher speeds, however, the failure planes are less defined. Generally they exhibit a band within which, individual particles are subject to rigid body motions. It is proposed that hydrodynamic effects are influencing the rubble behaviour at these higher speeds.
Figure 4.1 Shear Strength VS. Speed Rubble Thickness - 0.2 m, Zero Consolidation
0 50 100 150 200 250 0 20 40 60 80 100 120 140 Velocity(mm/s) Large Block Small Block Linear (Large Block)Line a r ( S ma ll Bl oc k)
28
Figure 4.2 Shear Strength VS. Speed Rubble Thickness - 0.2 m, One Hour Consolidation
0 50 100 150 200 250 0 20 40 60 80 100 120 Velocity(mm/s) Large Block Small Block Linear (Large Block)Line a r ( S ma ll Bl oc k)
Figure 4.3 Shear Strength VS. Speed Rubble Thickness - 0.3 m, Zero Consolidation
0 20 40 60 80 100 120 140 160 180 200 0 20 40 60 80 100 120 140 Velocity(mm/s) Large Block Small Block Linear (Large Block)Line ar ( S m al l Bl oc k)
30
Figure 4.4 Shear Strength VS. Speed Rubble Thickness - 0.3 m, One Hour Consolidation
0 50 100 150 200 250 300 0 20 40 60 80 100 120 Velocity(mm/s) Large Block Small Block Linear (Large Block)Line a r ( S ma ll Bl oc k)
Figure 4.5 Shear Strength VS. Speed Rubble Thickness - 0.4 m, Zero Consolidation
0 50 100 150 200 250 300 0 20 40 60 80 100 120 140 Velocity(mm/s) Large Block Small Block Linear (Large Block)Line a r ( S ma ll Bl oc k)
32
Figure 4.6 Shear Strength VS. Speed Rubble Thickness - 0.4 m, One Hour Consolidation
0 100 200 300 400 500 600 0 20 40 60 80 100 120 140 Velocity(mm/s)
Shear Strength (Pa)
Large Block Small Block Linear (Large Block) Linear (Small Block)
Figure 4.7 Summary of Shear Strength Rubble Thickness - 0.4 m, Zero Consolidation
0 50 100 150 200 250 300 0 20 40 60 80 100 120 140 Velocity(mm/s)
Shear Strength (Pa)
Large Block Small Block Graded Ice Linear (Large Block) Linear (Small Block) Linear (Graded Ice)
34
Figure 4.8 Friction Angle vs. Speed Rubble Thickness - 0.4 m, Zero Consolidation
0 10 20 30 40 50 60 70 80 0 20 40 60 80 100 120 140 Velocity(mm/s) Large Block S Gr ad e
Linear (Large Block) Linear (Small Block) Linear (Graded Ice)
Figure 4.9 Phi from Punch Tests 0.00 10.00 20.00 30.00 40.00 50.00 60.00 70.00 80.00 0 20 40 60 80 100 120 Velocity (mm/s)
Friction Angle (deg)
Arctic Ice:Test2 Arctic Ice:Test1 Large Blocks
36
Figure 4.10 BiLinear Variation of Friction Angle
0 10 20 30 40 50 60 70 80 0 20 40 60 80 100 120 Velocity (mm/s)
Friction Angle (deg)
Large Blocks
Chapter 5 Conclusions and Recommendations
5.1 Conclusions
On the basis of the tests carried out in the current project, and previous tests, a number of conclusions can be drawn. However, the additional tests have also prompted some additional questions, suggested new lines of enquiry.
A. There is clearly two different forms of behaviour that depend on platen speed. At higher speeds, there is significant particle motion along the failure planes that are much less well defined. At lower speeds the rubble fails along very clearly defined planes with minimal lateral disturbance of the ice particles.
B. The transition between the two forms of behaviour is in the range of 40 to 50 mm/sec. For the two sizes of blocks used to date, there does not seem to be any difference in this speed.
C. Consolidation of the ice results in an increase in the shear strength of the rubble.
However, this effect becomes less pronounced as the rubble thickness increases and, at a rubble thickness of 0.4 m, the effect of one hour consolidation has virtually disappeared. Previous work with longer consolidation times has shown that the effect is noticeable, even at a rubble thickness of 0.4 m.
D. Even within the speed ranges associated with the two forms of behaviour, there is an increase in shear strength with platen speed. The effect of speed is largely independent of consolidation.
E. The effect of block size depends on the effect of consolidation. With no consolidation, the resulting shear strengths for small and large block sizes were generally the same for all rubble thicknesses. At one hour consolidation however, the shear strength for the larger blocks was lower than that of the original, small, blocks. As the additional strength due to consolidation is due to regelation between pieces, this is not surprising, as the number of such bonds will be greater with the smaller blocks.
F. The shear strength of the graded ice was substantially less dependent on speed than that on the single sized pieces. At low speeds, the shear strength of the graded ice was slightly higher than that of the two single sized strengths. At higher speeds, however, the shear strength of the graded ice was substantially lower than that of the single sized rubble ice.
G. Although friction angles have been reported for all tests, the observed behaviour at higher platen speeds suggests that the rubble is not behaving as a Mohr-Coulomb material and hence an internal friction angle may not be an appropriate measure of strength. However, the friction angle does increase with speed, even at the lower speeds.
38 H. For the rubble consisting of single sized pieces, the friction angle for the small pieces is
slightly lower than that for the large pieces, the difference being consistently about 5°. The friction angles for the graded ice, however, are significantly lower than the other results. This may be attributed to a reduced propensity for mechanical interlock due to the range of piece sizes.
I. Finally, by considering the friction angles separately for the speed ranges associate with the two different forms of behaviour, it may be seen that the friction angle at lower speeds, where the behaviour exhibits classical shear plane failure, is more strongly dependent on speed that at the higher speeds.
5.2 Recommendations:
There are two important recommendations that are being made on the basis of the tests that have been conducted to date, and one that has been made previously.
A. The effect of size needs to be further investigated, both in the context of the results presented here, and in the context of mirroring the relative scale of ice rubble tested in field programmes, where the rubble pieces are larger in relation to the platen than has been tested in the laboratory to date.
B. The difference in behaviour that is observed at higher speeds needs to be further investigated. This behaviour is not observed in field tests, but the platen speed in field tests is much lower, in relation to characteristic rubble piece sizes, than in the
laboratory. However, in rubble interactions with offshore structures, higher relative speeds are possible, especially in tidal regimes.
C. The plane strain test arrangement should be used to examine horizontal indentation of model rubble.
References:
Azarnejad, A., and Brown, T. G., 2001, “Ice Rubble Behaviour in Punch Tests”. ASCE Journal of Cold Regions Engineering, Vol. 15, No. 3, September, pp135-153.
Azarnejad A. and Brown T.G., 1999. “Experimental Investigation of Ice Rubble Behaviour and Strength in Punch Tests”, Report submitted to National Research Council of Canada, Ottawa, Canada.
Brown T.G. and Azarnejad A., 1997. “Experimental Investigation of Ice Rubble Behaviour and Strength in Punch Tests”, Report submitted to National Energy Board (Canada), Calgary, Alberta.
Croasdale K.R. and Associates. 1996. “ In Situ Strength Measurements of First-Year Ridge Keels for Interaction Models. Joint Industry Project for NEB, April 1996, 210p.
Heinonen, J., Määttänen, M., Høyland, K.V., Kjestveit, G. 1999 “Ridge Loading Experiments” Field Experiments in Winter 1999, Unpublished report for the LOLEIF Project, 2000, 73 p. Leppäranta, M. and Hakala, R. 1992. “The Structure and Strength of First-year Ice Ridges in the Baltic Sea, Cold Regions Science and Technology, 20, pp. 295-311.
McKenna, R.F. Bruneau, S.E. and Williams, F.M. 1996. “In Situ Shear Strength Measurements of Model Ice Rubble Using a Punch Technique. The 49th Canadian Geotechnical Conference of the Canadian Geotechnical Society, Sep, 1996 St. John’s Nf. pp279-286.