HAL Id: hal-03120144
https://hal.archives-ouvertes.fr/hal-03120144
Submitted on 25 Jan 2021
HAL is a multi-disciplinary open access
archive for the deposit and dissemination of
sci-entific research documents, whether they are
pub-lished or not. The documents may come from
teaching and research institutions in France or
abroad, or from public or private research centers.
L’archive ouverte pluridisciplinaire HAL, est
destinée au dépôt et à la diffusion de documents
scientifiques de niveau recherche, publiés ou non,
émanant des établissements d’enseignement et de
recherche français ou étrangers, des laboratoires
publics ou privés.
Construction of a 1° x 1° fossil fuel emission data set for
carbonaceous aerosol and implementation and radiative
impact in the ECHAM4 model
W.F. Cooke, C. Liousse, H. Cachier, J. Feichter
To cite this version:
W.F. Cooke, C. Liousse, H. Cachier, J. Feichter. Construction of a 1° x 1° fossil fuel emission data set
for carbonaceous aerosol and implementation and radiative impact in the ECHAM4 model. Journal of
Geophysical Research: Atmospheres, American Geophysical Union, 1999, 104 (D18), pp.22137-22162.
�10.1029/1999JD900187�. �hal-03120144�
JOURNAL OF GEOPHYSICAL RESEARCH, VOL. 104, NO. D18, PAGES 22,137-22,162, SEPTEMBER 27, 1999
onstruction
of a 1 ø x 1 ø fossil fuel emission
data set
for carbonaceous aerosol and implementation and
radiative impact in the ECHAM4
model
W.F. Cooke,
• C. Liousse,
and H. Cachier
Centre des Faibles Radioactivit(•s, Laborat&re Mixte CNRS-CEA, Gif sur Yvette, France J. Feichter
Max Planck Institut ffir Meteorologie, Hamburg, Germany
Abstract. Global-scale
emissions
of carbonaceous
aerosol
from fossil
fuel usage
have been calculated with a resolution of 1 ø x 1 ø. Emission factors for black and
organic
carbon have been gathered
from the literature and applied to domestic,
transport, and industrial combustion
of various fuel types. In addition, allowance
has been made for the level of development
when calculating emissions
from
a country. Emissions
have been calculated
for 185 countries
for the domestic,
industrial, and transport sectors
using a fuel usage database published
by the
United Nations [1993]. Some inconsistencies
were found for a small number of
countries
with regard to the distribution of fuel usage between the industrial and
domestic
sectors. Care has been taken to correct for this using data from the fuel
use database for the period 1970-1990. Emissions
based on total particulate matter
(TPM) and submicron
emission
factors have been calculated. Global emissions
for 1984 of black carbon
total 6.4 TgC yr -• and organic
carbon
emissions
of 10.1
TgC yr -• were
found
using
bulk aerosol
emission
factors,
while
global
black
carbon
emissions
of 5.1 TgC yr -• and organic
carbon
emissions
of 7.0 TgC yr -• were
found
using submicron emission
factors. Use of the database is quite flexible and can be
easily updated as emission
factor data are updated. There is at least a factor of 2
uncertainty in the derived emissions
due to the lack of exactly appropriate
emission
data. The emission
fields have been introduced
into the ECHAM4 atmospheric
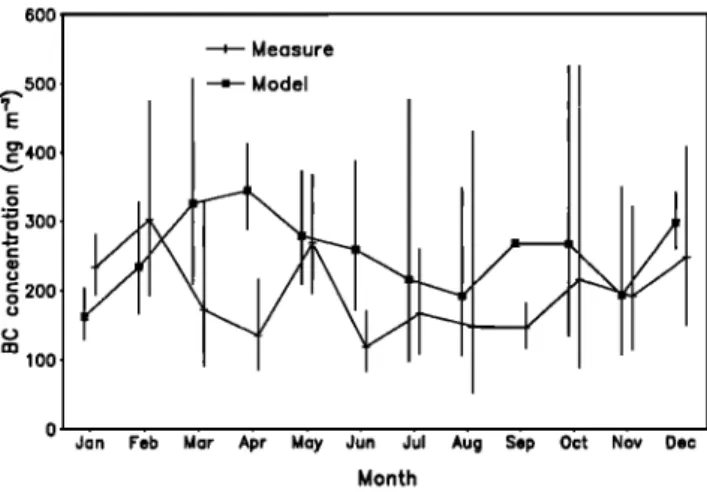
general circulation model and run for 5 model years. Monthly mean model results
are compared
to measurements
in regions
influenced
by anthropogenic
fossil fuel
emissions. The resultant aerosol fields have been used to calculate the instantaneous
solar radiative forcing at the top of the troposphere
due to an external mixture
of fossil fuel derived bl•ck c•rbon •nd organic c•rbon •erosol. Column burdens
of 0.143
mgBC
m -2 and 0.170
mgOC
m -2 were
calculated.
Because
of secondary
production
of organic
carbon
aerosol,
it is recommended
that the burden
of organic
carbon
aerosol
be doubled
to 0.341
mgOC
m -2. The resultant
forcing
when
clouds
are included
is +0.173 W m -2 for black
carbon
and-0.024
W m -2 for organic
carbon (x2) as a global annual average. The results
are compared
to previous
works, and the differences are discussed.
1. Introduction
There is concern about the changing composition of the atmosphere due to anthropogenic emissions. It is
•Now at Geophysical Fluid Dynamics Laboratory, Princeton,
New Jersey
Copyright 1999 by the American Geophysical Union. Paper number 1999JD900187.
0148-0227/99/1999JD900187509.00
predicted
that emissions
of so-called
greenhouse
gases
could cause a warming of the atmosphere by several
degrees on a regional scale. To date, studies of the
radiative impact of anthropogenic aerosols include the
effect of sulphate [Charlson et al., 1991, 1992; Kiehl and
Briegleb, 1993; Taylor and Penner, 1994; Feichter et al.,
1997] , an external mixture of sulphate and black car-
bon [Haywood
and Shine, 1995; Schult et al., 1997] ,
biomass-burning particles [Penner et al., 1992; Hobbs
et al., 1997],
and anthropogenic
dust aerosol
[Tegen
and
Lacis, 1996; Tegen et al., 1996]. These studies have
found that mixtures of various aerosols tend to have a
22,1238 COOKE ET AL.' FOSSIL FUEL CARBONACEOUS AEROSOL DATA SET
cooling
effect
on the atmosphere,
but not all the aerosol
types found in the atmosphere have been included. A consequence of the combustion of fossil fuel is the
emission of carbonaceous aerosol. Different combus-
tion processes emit different amounts of carbonaceous
aerosol as a consequence of the efficiency of the com-
bustion process. This carbonaceous aerosol can be bro- ken into two fractions, an organic carbon (OC) frac-
tion which may be reactive in the atmosphere and a
nonreactive black carbon (BC) fraction. The optical properties of these two fractions are also quite dissim- ilar. The organic fraction has optical properties which
are mainly scattering in the solar spectrum. The BC
aerosol is, as its name suggests, highly absorbing in the solar spectrum and is the only ubiquitous aerosol with a significant absorption cross section. The abundance
of OC as a fraction of the carbonaceous aerosol may dif-
fer significantly because of the combustion process and fuel type. In less efficient processes the OC fraction
of the carbonaceous aerosol is more significant. The ratio BC:OC may not be constant in the atmosphere
because of differing lifetimes and sources, and Penner
et al. [1995] with a simple box model has shown that
the radiative forcing of the atmosphere is quite sensitive
to the ratio of BC to OC emission.
While the majority of modeling efforts have con- centrated on the sulphur cycle, it is also necessary to calculate the global mass distribution of carbonaceous aerosol in order to provide a better picture of the impact
of anthropogenic emissions on the atmosphere and the
impacts on radiative transfer thereof. Recent studies and experiments have found that the OC mass concen- tration in both anthropogenically influenced source and remote areas may be of the same magnitude as that of
sulphate [Cachier et al., 1990; Novakov and Corrigan, 1996; Hegg et al., 1997].
The main purpose of this work is to improve the fossil
fuel carbonaceous aerosol inventory and to show where
some of the uncertainties may lie. This work presents an
exhaustive inventory of primary carbonaceous aerosol
from fossil fuel combustion. Previous inventories from
Penner et al. [1991, 1993]
and Cooke
and Wilson
[1996]
all concentrated on the emission of BC from either or
both of fossil fuel and biomass burning. Liousse et al.
[1996] was the first to include organic aerosol on a global
scale with a detailed work on biomass-burning emissions
while scaling the fossil fuel emissions from the emissions
of BC of Penner et al. [1993]. The work presented here improves on the works of Cooke and Wilson [1996] and Liousse et al. [1996] by compiling consistent updated
data sets of both BC and OC emissions from the com-
bustion of fossil fuels and their various usages. This
work also corrects some errors made in previous fossil fuel carbonaceous aerosol inventories where BC emis-
sion factors were implicitly equated to total particu-
late matter emission factors. In addition, we utilize
the level of development of a country to differentiate between the efficiency and control of emissions in var-
ious countries. Furthermore, the previous studies of
carbonaceous aerosol emission have been mainly based
on bulk emission factors. The dry deposition velocity of particles with diameters of greater than a few microns is such that the lifetime of these particles is quite short. Therefore, when using global models with grid boxes of several square degrees, it is necessary to concentrate on the fraction of the aerosol which is capable of long-range
transport.
In this work we calculate emission factors on the ba-
sis of submicron emissions. The submicron and bulk
emissions may give us an idea of the lower and upper
limits of the impacts of global emission of primary car-
bonaceous aerosol from the combustion of fossil fuel.
In this work we also calculate the mass distribution of
carbonaceous aerosol emitted from fossil fuel sources us-
ing the fourth generation Max-Planck-Institute model, ECHAM4, which is the most recent in a series evolving from the European Centre for Medium-Range Weather
Forecasts (ECMWF) model. In this study the T30 ver-
sion of the model is used, which has an approximate res- olution of 3.750 x 3.75 ø. Although this is not the finest
resolution of the model, the T30 resolution was chosen because of computational time constraints. It should be
noted here that the resolution of the model will cause
some problems when comparing the results with mea- surements made near source regions. Improved optical
properties of carbon.aceous particles are implemented
in the radiative code of the ECHAM4 model in order
to obtain preliminary results of the radiative forcing of
carbonaceous aerosol emitted by fossil fuel based com-
bustion.
2. Method
The quantity of carbonaceous aerosol emitted by fos-
sil fuel combustion is proportional to the quantity of fuel
consumed and the emission factor for the combustion
process. The quantity of fuel consumed is reasonably
well known, and we use a fossil fuel consumption data
set from the United Nations [1993] to calculate these
quantities. The year 1984 was chosen as the reference
year for this study. The seasonality of the combustion
of fossil fuel has been taken from Rotty [1987]. The
emission factor for the combustion of a particular fuel is a complicated function of various parameters, such as temperature and oxygen availability. There is a paucity of emission factor data for carbonaceous aerosol and, es- pecially, OC. There is, however, much more data avail-
able for total particulate matter (TPM) over a range of
industrial and domestic situations. We will use a combi-
nation of TPM and BC emission factors in order to ex-
trapolate BC emission factors for various consumption sectors. Emission factors for OC have been reported only for developed countries. Therefore, in order to
compile a consistent data set of BC and OC emission factors, we have used the ratio of OC to BC for each fuel type to scale the emission factor of OC for the same
COOKE ET AL.' FOSSIL FUEL CARBONACEOUS AEROSOL DATA SET 22,139 consumption sector for other countries. The method
used here accounts only for primary production of OC.
n 1 _ 1 z_'
prouuc•ion of '-'• aerosol contributes a large
•econclary
fraction of the OC aerosol mass. The secondary pro- duction is not calculated explicitly in this model at this
time but account is taken (section 6.2) of this aerosol
when calculating the radiative forcing of carbonaceous
aerosol.
2.1. Differentiation of Emission Factors by
Country
The method used in this paper is based on that used
in the calculation of fossil fuel emissions of BC by Cooke
and Wilson [1996], and the distribution scheme is shown
in Figure 1. There is an improvement in the distribu- tion of emissions in that in the work presented here, a differentiation has been made with respect to the level of development of the 185 countries in the database. The level of development of a country has consequences
for the emission of carbonaceous aerosol as combustion
tends to be more efficient. Furthermore, governments of
developed countries legislate to reduce emissions from
United Nations fuel database
Hard Coal Lignite Diesel 18 other fuel types
Developed
countries Semi-developed countries Under-developed countries
I I
Production
data Consumption data I Consumption N data exists?
I Y
Consumption N Production?I Y
I(• Domestic
consumption I I I Redistribute consumption Population density Read proxy distribution I I I Industrial consumption Combined consumption I I I Carbonaceous aerosol emitted per country Carbonaceous aerosol emission dataset on 1 øxl øFigure 1. Tree diagram of emission distribution.
industrial and vehicular sources. In less developed coun- tries, control of emissions are not such a high prior- ity, -"• ,•.u emission ' ' sources are -^'-'1 ,•l•,aced by ...u• •m•,• •a•_:•_,
modern equipment at a slower rate than in developed
countries. Similarly, vehicles tend to be older and are not as expertly maintained in less developed countries. These older cars will be the source of much greater emis-
sions than in the developed countries. Therefore one can expect that there will be a variation in the emis-
sion factor of carbonaceous aerosol between the same
combustion process in different countries, and it is nec- essary to make some differentiation between countries on the basis of their level of development and not sim-
ply use distribution maps of the consumption of fuels
to calculate emissions. We have placed the countries of
the world into three groupings, representing developed,
semideveloped, and developing countries. The group of
developed countries is composed of the members of the
Organization for Economic Cooperative Development
(OECD) in 1984. The semideveloped countries are con-
sidered to be the countries of the former Eastern Euro-
pean bloc, the former USSR, South Africa, Israel, Hong Kong, Singapore, and Taiwan. All other countries were
placed in the group of developing countries.
2.2. Differentiation of Emission Factors
by Combustion Process
There are various differences between the emission
characteristics of domestic and industrial processes. The
relatively poorer conditions of domestic combustion, compared to industrial combustion, will favor the pro-
duction of particles. In addition to the difference be-
tween domestic and industrial processes, there are also
differences within the industrial sector with respect to the efficiency of the equipment used in various pro-
cesses. Data from the United States Environmental
Protection Agency (EPA) [1994] show that emission fac-
tors for particulate
matter of less
than 10 ttm (PM-10)
from coal-burning electric utilities in the United States
decreased by a factor of 15 between 1970 and 1990. This
shows that there has been an improvement in the effi-
ciency of combustion and control of emissions in the
developed world over time. In China the utilization
efficiency of energy is approximately 30% less than in
the developed
world [Zhang et al., 1994]. The lower
efficiency of this equipment may result in lower temper-
atures and therefore relatively higher emission factors. In addition, the relative fractions of BC and OC in
the carbonaceous aerosol are different for the domes-
tic and industrial settings. We may assume that the organic fraction of the aerosol is not as important in in- dustrial settings as in domestic settings because of the
higher temperatures for industrial combustion. This is
also
corroborated
from our experience
of the changes
in
BC to OC ratios with temperature in vegetation fires
[Cachier
et al., 1995]. The relatively
lower
temperature
of domestic combustion will result in less thermal degra- dation of the fuel and therefore will lead to a greater
22,140 COOKE ET AL.: FOSSIL FUEL CARBONACEOUS AEROSOL DATA SET
fraction of organic aerosol. In industrial processes the temperature of combustion allows the fuel to thermally
degrade
to a greater
extent, and the organic
fraction
of
the emissions will also cornbust, meaning that the BC
emissions are relatively more important in this case.
The fuel use data set which we used to calculate the amount of fuel used in domestic or industrial set-
tings also includes some categories of usage that are
not clearly one or the other. In this case we have used
a so-called "combined" emission factor to estimate the emissions from these sources. This emission factor is
simply the square root of the product of the domestic
and industrial emission factors. An exception to this is made for diesel and motor gasoline, where the com- bined sector is replaced by a traffic sector for which an emission factor is specifically calculated.
In r•sum•, we have divided the countries into three levels of development. For each of these levels of devel-
opment, there is also a division made between domestic,
industrial, and traffic or combined usage of each fuel type. Therefore, for each fuel type it is necessary to
calculate nine emission factors.
2.3. Consideration of Size Distribution
in Calculating Emission Factors
A problem with using bulk emission factors is that
carbonaceous aerosol may consist of particles with par- ticle radii ranging over several orders of magnitude. For instance, the largest particles emitted from coal burn-
ing, fly-ash, may be several hundreds of microns in di-
ameter [McElroy et el., 1982]. However,
particles
of
this size range will have very large deposition velocities and will not remain in the atmosphere for very long. The particles with the lowest deposition velocities, and therefore longest lifetime with respect to dry deposition, are submicron aerosol particles. It is therefore useful to
evaluate the submicron fraction of carbonaceous aerosol
emissions as we are interested in implementing these
emissions in a global transport model where the aerosol
size distribution is considered constant. The submicron
aerosol is also the size range of aerosol particles where
the radiative effects of aerosol are at a maximum. It
should be noted that because of the paucity of data, no
consideration has been made of the carbon content of
the bulk emissions as a function of size in this work.
In considering bulk and submicron emission factors,
the majority of data on size distributions of emissions exist for coal and diesel only. These fuels are the source
of the majority of the carbonaceous emissions, while other sources, although important locally, contribute relatively little to the global emissions. As BC and OC
are coemitted from fossil fuels when burnt, we will as-
sume that the size distributions of the two species are
similar [Brdmond et el., 1989].
For coal combustion, bulk emission factors are gener- ally derived from uncontrolled emission factors. How-
ever, in industrialized countries, there are also control
devices fitted to further reduce the emissions. These
control devices generally have a high total mass removal efficiency with legislation requiring that up to 99% of the mass be removed. Control devices generally use the aerodynamic properties of aerosol to assist in their re- moval. However, the removal efficiency of these devices deteriorates as the size of the particle decreases. There-
fore, while a device may claim a removal efficiency of
99% of the mass, this will be true only for the entire size range of the particles, not for submicron particles.
The EPA [1996] reports the uncontrolled and controlled
emission factors of submicron PM for various control de- vices in conjunction with various combustion devices.
The control devices are given in Table 1 along with the
appropriate submicron emission factor, where it can be
seen that the control device can remove between 10 and 99% of the mass of the submicron aerosol. We will as-
Table 1. Uncontrolled and Controlled Submicron Emission Factors
Type of Control Uncontrolled Emission Controlled Emission Ratio
Device Factor Factor Control/Uncontrolled
Multiple cyclone no reinjection of fly-ash Multiple cyclone reinjection of fly-ash Scrubber Electrostatic precipitator Bag-house Average 0.2A* 0.02A 0.1 3.3 0.4 0.12 0.28A 0.26A 0.93 2.0 3.6 1.8 3.3 1.6 0.48 0.2A 0.18A 0.9 0.2A 0.01A 0.05 0.28A 0.004A 0.014 3.3 0.2 0.06 0.2A 0.006A 0.03 3.3 0.018 0.0055 ... 0.408
Emission factors are from the EPA [1996]
COOKE ET AL.: FOSSIL FUEL CARBONACEOUS AEROSOL DATA SET 22,141
Table 2. Uncontrolled Bulk and Submicron Emission Factors
Coal Combustion Bulk Emission Submicron Emission
Device
Factor,
g kg
-•
Factor,
g kg
-•
Pulverised coal dry bottom 5A*Pulverised coal wet bottom 3.5A
Spreader stoker 33 Overfeed stoker 8 Underfeed stoker 7.5 0.1A 0.14A 1.65 0.96 1.575
Emission factors are from the EPA [1996]
*A is the weight percent ash content of coal. If the ash content is 12.8%,
then A-12.8, leading to emission factors of 64 gTPM kg -• and 44.8 gTPM kg -• for the two types of pulverised coal burner.
sume an average (50%) over all the devices in calcu-
lating the reduction in submicron emission factors for
developed countries because of control of emissions.
Coal has a large mass fraction in the supermicron fraction of its emissions [$chure et al., 1985; McElroy et al., 1982]. For the industrial use of coal we used data from the EPA [1996] for the submicron fraction of
uncontrolled TPM emissions from various combustion
devices
(Table 2) and data from McElroy et al. [1982]
on the ash content of hard coal. Assuming that each of BC and OC comprise 25% of the submicron aerosol, we
obtain a submicron emission factor for industrial coal
usage. It should be noted that this assumption intro-
duces some uncertainty into the data set as the frac-
tion of submicron PM which is carbonaceous probably
varies with the combustion conditions. For domestic
situations the EPA [1996] report that submicron PM constitute 50% of bulk emissions. This will apply to
submicron BC and OC emission factors as well.
Several authors have reported concordant results on
size distributions of diesel emissions using impactors and/or electron microscopy. These studies show that
the mass distribution peaks in the accumulation mode
[Whitby,
1978;
Horvath
et al., 1988; Weingartner
et al.,
1997]. We will assume that all carbonaceous particulate
matter emitted by diesel engines are submicron.
2.4. Major Sources of Carbonaceous Aerosol The emission factors for each fuel type and each in- dustrialization sector are given in Table 3a for BC and Table 4 for OC. A summary of the emission factors found in the literature and used in calculating the av- erage BC emission factor for several fuels in developed countries are given in Table 3b.
The "standard" procedure we use to calculate the
nine emission factors for each fuel type is as follows. Emission factors are generally representative of devel- oped countries. The average emission factor in Table 3b was selected for domestic or industrial usage of fos- sil fuels in developed countries. For domestic usage the maximum in the range of the emission factors was used as the average emission factor for semideveloped
and underdeveloped countries. For industrial usage in underdeveloped countries we assume that the emission
factor is 5 times that of developed countries [Etemad and Luciani, 1991], whereas for semideveloped coun-
tries the average emission factor was assumed to be the maximum of the range of those found for "developed" countries. The factor of 5 used here is probably on
the conservative side. In all cases the combined sector
emission factor is calculated as the square root of the
product of the domestic and industrial emission factors. Exceptions to this procedure will be pointed out in the
following where necessary. The same procedure is used
for both BC and OC.
2.4.1. Coal. The BC emission factors for hard coal
have been derived in the standard manner. For OC, there are very few measurements of the emission from
hard coal combustion. Most of these refer to measure-
ments of extractable organic matter which may repre-
sent only about 60% of the total organic matter [Rogge et al., 1993]. Therefore one needs to divide this emission
factor by 0.6 in order to correct for the nonextractable organic matter. In order to calculate the emission of organic carbon, one also needs to divide the organic
matter emission rate by a factor of 1.4 [Duce, 1978; Countess et al., 1981]. The domestic emission factors found for BC and OC (Tables 3a and 4) give a ratio of
33:67. This ratio will be used to scale the emission
factors of BC in order to calculate emission factors of
OC for domestic usage of hard coal in semideveloped and underdeveloped regions of the world. However, as industrial processes tend to be more efficient, we will assume that the BC:OC ratio is 50:50 in all regions of
the world.
For the submicron fraction of carbonaceous aerosol
produced by uncontrolled industrial combustion of hard
coal, we obtain an emission factor of 0.298 g kg -• for both BC and OC, assuming that each of BC and OC
comprise 25% of the submicron aerosol. The uncon-
trolled emission factor is assumed to be representative of
submicron emissions for semideveloped countries. For
developed countries we use the average characteristics of controlled processes for submicron particles to reduce
22,142 COOKE ET AL.- FOSSIL FUEL CARBONACEOUS AEROSOL DATA SET
Table 3a. Emission Factors for Bulk Black Carbon Aerosol
Fuel Type Sector Underdeveloped, Semideveloped, Developed,
g kg -•
g kg -1
g kg -•
Hard coal, hard coalbriquettes, coke oven coke, gas coke,
brown coal coke
Lignite brown coal, lignite briquettes Diesel Peat Peat briquettes Aviation gasoline Jet fuel Kerosene
Liquid petroleum gas
Residual fuel oil
Motor gasoline Natural gas and
other gases
Hard coal, hard coal briquettes, coke oven coke, gas coke,
brown coal coke
Lignite brown coal, lignite briquettes
Bulk BC Emission Factors
combined 2.13 1.22 0.75 domestic 4.55 4.55 2.78 industrial 1.0 0.325 0.2 combined 3.84 2.2 1.34 domestic 8.18 8.18 5.0 industrial 1.8 0.59 0.36 transport 10.0 10.0 2.0 domestic 2.0 2.0 2.0 industrial 0.35 0.09 0.07 combined 0.3 0.3 0.3 domestic 0.67 0.67 0.67 industrial 0.134 0.134 0.134 all 0.1 0.1 0.1 all 1.0 1.0 1.0 all 0.03 0.03 0.03 all 0.0002 0.0002 0.0002 all 0.025 0.025 0.025 transport 0.15 0.15 0.03 combined 1.23' 1.23 1.23 domestic 2.24 2.24 2.24 industrial 0.216 0.216 0.216
Submicron BC Emission Factors
combined 1.58 0.82 0.46 domestic 2.28 2.28 1.39 industrial 1.10 0.298 O. 149 combined 2.84 1.48 0.82 domestic 4.10 4.10 2.50 industrial 1.98 0.536 0.268 BC, black carbon.
*Emission factors for natural gas and other gases are given in g T J -•. In order to
convert emission factors of C from gC kg -• gas to gC T J -• energy and volume densities of 19.3 kg TJ -• [Muhlbaier and Williams, 1982] and 1.4 m s kg -• were used.
Lignite brown coal (or soft coal) has a lower
calorific
content than hard coal. The temperatures obtained in fires with lignite can be expected to be lower than those with hard coal. This lower temperature should lead to
lower efficiency of burning and higher emissions. The EPA [1996] gives TPM emissions which are 1.8 times that of hard coal. We will therefore augment the BC
emission factors of hard coal by a factor of 1.8 and use
the ratio of Rosen and Hansen [1985]
to calculate
the
emission factors for OC emissions from the combustion
of lignite brown coal in all cases.
2.4.2. Diesel. For diesel the majority of emission factor data refers to vehicular use, and we replace the
combined usage sector by the traffic sector. A com-
pilation of emission
factors
from this source
(Table 3b
and Figure 4) shows that diesel is a significant source
of carbonaceous aerosol. For traffic, BC is the most
important fraction and comprises 55-79% of the car-
bonaceous aerosol [C ass et al., 1982; Muhlbaier and
Williams,
1982;
Lowenthal
et al., 1994; Guillemin
et al.,
1997]
with the average
fraction
of BC being
66%. This
implies that the emission factor for OC is a factor of 2
below the BC emission factor.
In a refinery
an emission
factor of 0.07 g kg- • for use
of distillate
fuel was reported
by Cass
et al. [1982],
and
this value is assumed for industrial use of diesel. Forindustrial
usage,
Lowenthal
et al. [1994]
gives
a ratio of
58:42 for BC:OC for stationary
sources
using
distillate
oil, which
implies
an emission
factor of 0.05 gOC kg
-•.
Domestic use of diesel is not well documented and is as- sumed to have the same emission factor and BC contentCOOKE ET AL.: FOSSIL FUEL CARBONACEOUS AEROSOL DATA SET 22,143
Table 3b. R•sum• of Emission Factors for Black Carbon Emission
Fuel Type Emission Factors Found Average Emission
in Literature Factor
Hard coal (domestic) 4.55 a, i b 2.78 Hard coal (industrial) 0.325 a, 0.1 b, 0.075 c,d, 0.3 e 0.2 Diesel (traffic) 1.268-1.62 g, 0.5-5 h, 2.1 i, 2
3.4 j, 1-3 b, 0.3-2 e
Aviation gasoline 0.04 g, 0.1-0.3 b, 1-6 e 0.1
Jet fuel 1.13 g, 1.26 c, 0.1-0.3 b, 1-6 e 1
Residual fuel oil 0.016-0.051 c, 0.013-0.021 g 0.025 Motor gasoline (traffic) 0.015-0.048 g, 0.3 k, 0.011-0.014 j, 0.03
0.004-1 m, 0.007-0.4 e
5.8 b j, 0.11 c j, 0.12-1.54 ej 0.58 b j, 0.055 c j, 0.007-0.02 ej
0.36 d, 0.176 f
Natural gas (domestic)* Natural gas (industrial)
Hard coal
(submicron
industrial)
2.24 0.216
0.298
Here, a, Ball [1987];
b, Turco
[1983];
c, Bocola
and Cirillo [1989];
d, EPA [1996];
e,
Hansen
et al. [1989];
f, McElroy
et al. [1982];
g, Cass
et al. [1982];
h, Barbella
et al. [1988];
i, Williams
et al. [1989b];
j, Muhlbaier
and Williams
[1982];
k, Williams
et al. [1989a];
m,
Hansen and Rosen [1990].
* Emission factors for natural gas and other gases are given in g T J -• .
2.5. Minor Sources of Carbonaceous Aerosol
Other fuels contribute emissions which may be impor-
tant on a local or regional scale. We will now calculate
their emission factors and assume that the submicron fraction of the emissions is similar to coal and diesel for
solid and liquid fuels, respectively.
2.5.1. Solid Fuels. Hard coal briquettes are formed by compressing the fines from coal into a regular shape.
Coke is a "solid product obtained from carbonisation
of coal at high temperatures" [United Nations, 1993]. Bocola and Cirillo [1989] quote the same TPM emis-
sion factors for coke burning as that of hard coal. We
therefore assume that carbonaceous emissions for these
solid fuel types are the same as that of hard coal. Peat is a fuel used in several countries although its
global usage is quite small. Because of the low degree
of maturation of this fuel, we will assume that emis-
sions from domestic burning of peat are similar to that
of wood. An emission factor of 12.3 gTPM kg- • from Liousse et al. [1996] with a carbonaceous fraction of 55% [Muhlbaier and Williams, 1982] is assumed. We
will assume that industrial processes are more efficient
and have emission factors which are a factor of 5 lower.
Because of the incomplete combustion of peat and low temperature in both industrial and domestic processes,
we will assume that a small fraction (10%) of the car-
bonaceous aerosol is BC as in smouldering combustion
of biomass burning [Cachier et al., 1996]. Particles are
also assumed to be in the submicron size range as for
biomass-burning aerosol.
2.5.2. Liquid Fuels. Motor gasoline is a widely
used fuel. A rdsumd of the emission factors used in cal-
culating the average emission factor is given in Table
3b. For this fuel, as for diesel, the combined emission factor has been replaced by a traffic emission factor. An average of these figures leads to an emission fac-
tor of 0.03 gBC kg
-• which
is 2 orders
of magnitude
lower than for diesel vehicles. The emission factors re-
ported above were measured in developed countries so the average emission factor is representative only of de- veloped regions. It would appear that the BC:OC ratio
is lower (17:83) for noncatalytic cars than for catalytic cars (31:69) [Cass eta!., 1982; Muhlbaier and Williams, 1982] . We will assume an average of these ratios for
developed countries while assuming that less developed
countries are represented by noncatalytic cars. Domes- tic and industrial use of the fuel within a country is
assumed to be similar to traffic.
For the following fuel types no sectorization is made between level of development or combustion process within a country. Kerosene is another fraction of the
distillate oil. Bocola and Cirillo [1989] give a TPM
emission
factor of 0.35 gTPM kg -• for kerosene.
Cass
et al. [1982] show that 14.6% of TPM from distillate oil
is carbonaceous. We will assume that the breakdown of
the BC:OC (58:42) is the same as for the industrial use
of diesel.
There are very few emission factors for residual fuel
oil. These are shown in Table 3b. The BG fraction of
the emissions (20%) [Cass et al., 1982] appears quite
lOW.
There are also very few emission factors for liquid
petroleum
fuel. Cass
et al. [1982]
report TPM emission
factors
of 0.348 gTPM kg -• and that 6% of the TPM
is carbon, all of which is organic. Bocola and Cirillo
22,144 COOKE ET AL.' FOSSIL FUEL CARBONACEOUS AEROSOL DATA SET
Table 4. Emission Factors for Bulk Organic Carbon Aerosol.
Fuel Type Sector Underdeveloped, Semideveloped, Developed,
g kg -•
g kg -•
g kg -•
Hard coal, hard coalbriquettes, coke
oven coke, gas coke,
brown coal coke
Lignite brown coal, lignite briquettes Peat Peat briquettes Diesel Aviation gasoline Jet fuel Kerosene
Liquid petroleum gas
Residual fuel oil
Motor gasoline
Natural gas and
other gases*
Hard coal, hard coal briquettes, Coke
oven coke, gas coke,
brown coal coke
Lignite brown coal, lignite
briquettes
Bulk OC Emission Factors
combined 3.09 1.76 1.08 domestic 9.54 9.54 5.83 industrial 1.0 0.325 0.2 combined 11.5 6.6 4.02 domestic 24.5 24.5 15 industrial 5.4 1.77 1.08 combined 2.71 2.71 2.71 domestic 6.07 6.07 6.07 industrial 1.21 1.21 1.21 transport 5.0 5.0 1.0 domestic 1.0 1.0 1.0 indust ri al 0.25 0.07 0.05 all 1.15 1.15 !.i5 all 0.45 0.45 0.45 all 0.022 0.022 0.022 all 0.02 0.02 0.02 all 0.1 0.1 0.1 all 0.73 0.73 0.07 combined 2.2 2.2 2.2 domestic 11.2 11.2 11.2 industrial 0.432 0.432 0.432
Submicron OC Emission Factors
combined 2.29 1.19 0.66 domestic 4.77 4.77 2.92 industrial 1.10 0.298 O. 149 combined 8.55 4.45 2.46 domestic 12.3 12.3 7.5 industrial 5.94 1.61 0.804
OC, organic carbon.
*Emission factors for natural gas and other gases are given in g TJ -1. In order to
convert emission factors of C from gC kg -1 gas to gC TJ -1 energy and volume densities of 19.3 kg TJ -1 [Muhlbaier and Williams, 1982] and 1.4 m s kg -1 were used.
kg -x. Taking the emission
data of Cass
et al. [1982]
and
assuming an emission factor for BC that is 1% of OC,
we derive
emission
factors
of 0.0002
gBC kg -x and 0.02
gOC kg- x.
For aviation, two types of fuel have to be considered. Aviation gasoline is intended for use in aviation piston power units only while jet fuel is needed for aircraft which utilize jet engines. For aviation gasoline we will
assume here the median emission factor of the data set
of 0.1 gBC kg -1. According
to Cass
et al. [1982],
BC
comprises 8% of the carbonaceous aerosol emitted by
aircraft. We therefore deduce an emission factor for OC
of 1.15 gOC kg-x. Emission factors for BC and OC have also been calculated for jet fuel [Cass et al., 1982; Turco, 1983; Bocola and Cirillo, 1989; Hansen et al., 1989]. If
we use the BC:OC ratio obtained above for diesel to
partition carbonaceous aerosol [Cass et al., 1982], then
we arrive at an emission factor of 0.5 gOC kg- x for jet
fuel.
2.5.3. Gaseous Fuels. There are also several types
of gaseous fuel included in the United Nations fuel database. Natural gas is by far the largest of these fuel
types, so we will approximate the emissions of these
fuel types by the emission factors for natural gas. It is also convenient to do this as natural gas is the most studied gaseous fuel. The emission factors are, however,
particularly low (Table 3b).
3. Sensitivity of Emissions to Assumed
Emission Factors
Recent measurements of the emission of submicron
light-absorbing particles from a lignite power plant [Bond et al., 1998] suggest a possible emission factor of 0.05
COOKE ET AL.' FOSSIL FUEL CARBONACEOUS AEROSOL DATA SET 22,145
g kg -•, which is a factor 6.5 lower than that assumed
here. However, as these data became available after wehad finished our computations for the global distribu-
tions discussed later, we have not included these data in our inventory. However, we can calculate what ef-
fect this lower emission factor would have for BC. The
global emission of BC is 2.14 TgBC from hard coal and
0.7 TgBC from lignite. If the emission factor found
by Bond et al. [1998] is more representative of the cor-
rect emission, then these figures would decrease to 0.33 TgBC and 0.11 TgBC, respectively. The global emis- sion would therefore decrease by 2.4 TgBC, or close to
5O%.
For diesel fuel, there is a range of a factor of 4 in the emission factors in Table 3b. The global emission from diesel is calculated to be 1.71 TgBC, so this could range from 0.86 to 3.42 TgBC.
One can say that the emission of BC, and therefore
also of OC, is uncertain to at least a factor of 2 and may well be overestimated. Measurements of emission
factors under the appropriate operating conditions are
vital if this uncertainty is to be reduced. Other sen-
sitivity studies may need to be made with regard the lifetime of the hydrophobic aerosol, but these studies are beyond the scope of this work.
4. Comparison With Other Emission
Data Sets for Carbonaceous Aerosol
The total emission based on bulk emission factors is
10.1TgOC yr -• and 6.4 TgBC yr -•. The total emission
based
on submicron
emission
factors
is 7.0 TgOC yr -•
and 5.1 TgBC yr -•. The effect
of allowing
only for the
submicron fraction of aerosol is to decrease the global
emissions of BC by about 20%. For OC this effect is
to reduce the total emissions by 33%. The difference
in reductions is due to the greater importance of the organic fraction in coal emissions.
For both components the most important area for emissions appears to be the non-USSR area of the Asian
continent, which accounts for 35-40% of the global emis-
sions. The European Union and North American coun-
tries have similar emissions (7-9% and 6-10%). The
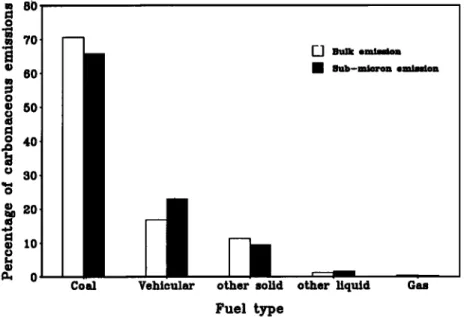
global distribution of submicron emissions of BC and OC are shown in Figures 2 and 3. The fractional con-
tribution of coal (hard and soft), vehicular (diesel and motor gasoline), and other fuel types to bulk and submi-
cron carbonaceous aerosol emission is shown in Figure 4.
One can see that the combustion of coal dominates the
global emission of carbonaceous aerosol, even for submi-
cron aerosol. This may be important for future emission
60N ß 3ON ... " E(• 30S 60S 90S 180 1 3 10 30 1 O0 300 1'000 3000 10000
22,146 COOKE ET AL- FOSSIL FUEL CARBONACEOUS .AEROSOL DATA SET 60N 30N EO 30S 60S 90S 180
.
' .-
...
:.:.:
... :.. '
...
.i•"•
'.'•
':'"'
'•. %;:.
".
ß
:.i?...,.•.
...
.•. '[' ""'•, ß .-.'..
•' •...•
•.-'-.'.:':•...
,.
.... .... .,:::•g•:•::.•f•%• ... ?•:: . . ... •... ß .'.•"*•f '• ... :::•::•::• ; * ß... ...
,-;-,
..
• '. ...
:::..:.:
-- -•• -.. • - .••
.•. , , , , ... _ ... = ...12ow •ow o •o E 12OE iso
1 3 10 30 1 O0 300 1000 3000 10000
Figure 3. Global distribution of organic carbon (OC) emissions on a 1 ø x 1 ø scale.
scenarios as developing countries, especially China, use this fuel to create the power needed by their growing
industry. This also emphasizes the need for more accu-
rate evaluation of emission factors for this fuel.
The only detailed fossil fuel global BC emission data sets which have been published are those of Cooke and
Wilson
[1996]
and Penner et al. [19931.
There is a 20%
difference in the totals of the two papers because of dif- ferences in the fuels used in compiling the data sets and
some discrepancies in the evaluation of emission factors.
Both of them are based on fuel usage and bulk emission
factors but did not explicitly take into account emission
controls or combustion efficiency. One can therefore ex-
pect that in the work presented here bulk emissions for
80 70 60 50 4.0 30 ß 2o • lO a• o
I
[_..1
Bulk
emission
I $ub-mloron enalfslonCoal Vehicular other solid other liquid Gas
Fuel type
COOKE ET AL.: FOSSIL FUEL CARBONACEOUS AEROSOL DATA SET 22,147
Table 5a. Comparison
With Cooke
and Wilson [1996] and Penner et al. [1993]
of Fossil
Fuel
Black Carbon Emissions by Region
Country or Region This Work This Work Cooke and Wilson [1996] Penner et al. [1993]
Bulk Submicron Bulk Bulk
European Union 15 0.55 0.47 1.09 0.47
Other western Europe 0.14 0.11 ...
Eastern Europe 1.05 0.68 1.56 1.50 Africa 0.20 0.17 0.34 0.04 South America 0.26 0.26 0.10 0.02 Central America 0.12 0.12 0.01 0.0 North America 0.55 0.49 1.27 0.32 Oceania 0.04 0.03 0.10 0.02 Former USSR 1.07 0.69 1.55 1.69 China 1.46 1.15 1.10 2.16 Rest of Asia 0.95 0.89 0.85 0.37 Total 6.39 5.06 7.97 6.64 Emissions are in TgBC yr -1
developed regions will be lower and for developing re-
gions will be similar or higher. Our revised inventory results in a global decrease of 20% in BC emission when compared to Cooke and Wilson [1996] but is similar to Penner et al. [1993].
Table 5a shows the regional breakdown of the two BC
emission data sets developed in this work. It must be
emphasized that in our work the contribution to global
BC emissions from South and Central America can be
attributed mainly to the use of diesel fuel in these coun-
tries.
Table 5a also compares the regional breakdown of the
two BC emission data sets developed here to those of
Cooke and Wilson [1996] and Penner et al. [1993].When compared to the Cooke and Wilson [1996] data set the
largest decreases in bulk BC emissions are for eastern
Europe and the former USSR with decreases of 30%
in each area. The emissions from western Europe and
North America have decreased by 50%, and this is pri-
marily due to the differentiation between industrialized
and nonindustrialized countries. In addition, account has been taken of emission controls in the developed
countries.
The apparent good agreement between the emissions
for China is, in fact, a coincidence as there was an over-
estimation of the industrial and underestimation of the
domestic fraction of consumption of coal in China in
the Cooke and Wilson [1996] paper, where the emis-
sions should have been estimated to be higher.
When compared to the Penner et al. [1993] data set,
the emissions for western Europe and North America
are somewhat higher. The main differences are in China
and the former USSR, where our estimates are lower. In Africa, South and Central America, and the rest of
Table 5b. Comparison With Liousse et al. [1996] of Fossil Fuel Organic
Carbon Emissions
Country or Region
This Work This Work Liousse
et al. [1996]
Bulk Submicron Bulk European Union 15 0.68 0.51 ß ß ß
Other western Europe 0.28 0.17 ß ß ß
Eastern Europe 2.68 1.68 ... Africa 0.24 0.17 ß .. South America 0.17 0.17 ... Central America 0.08 0.08 ... North America 0.48 0.39 ... Oceania 0.06 0.05 ß ß ß Former USSR 2.19 1.35 ß ß ß China 2.23 1.54 ß .. Rest of Asia 1.04 0.90 ... Total 10.12 7.01 23.75
22,148 COOKE ET AL.: FOSSIL FUEL CARBONACEOUS AEROSOL DATA SET
Asia the emission of BC is quite a bit higher than in
the work of Penner et al. [1993] because of the higher
emission factor for diesel in these regions.
There are also large differences in the fuel use inven- tories used. A calculation using the emission factors of
Penner et al. [1993] and the fuel usage data set (coal and diesel only) used in this work resulted in a global
emission of 9.6 TgBC. The 45% discrepancy should not
be due to the different years for which emissions were
calculated.
Since only the emission factors of the coal-like fu-
els have been reduced in order to estimate the submi-
cron emission of carbonaceous aerosol, one can expect
the differences between the bulk-and submicron-based
emissions to be greatest in areas where coal combus- tion is most important. The regional emission of BC
indeed decreases in eastern Europe (35%), the former
USSR (35%) and China (20%) when only submicron
emissions are considered.
The regional breakdown of the emission of primary organic aerosol is shown in Table 5b. As far as we
are aware, there has been only one other estimate of
the emission of OC aerosol from the combustion of fos-
sil fuel. Liousse et al. [1996] estimated the global or-
ganic carbon aerosol emission by multiplying the coal and diesel fraction of the fuel use BC inventory of Pen-
ner et al. [1993] by the ratio of OC to BC (3.1:1) as
measured in urban situations, resulting in a global to- tal emission of 20.35 TgOC. This method is reasonable but certainly takes into account the local and rapid
secondary production of anthropogenic organic aerosol
which leads to a higher ambient concentration of or- ganic aerosol. Following the method of Liousse et al.
[1996], the total presented here suggests that primary organic aerosol (10.1 TgOC) emitted from the combus-
tion of fossil fuel may account only for approximately
one half of the total anthropogenic organic aerosol (6.4 TgBC x 3.1 = 19.8 TgOC) in source areas.
5. Implementation
of Carbonaceous
Aerosols in ECHAM5.1. Meteorological Model
In this study we used the fourth generation Max-
Planck-Institute model, ECHAM4, which is the most recent in a series evolving from the European Centre for
Medium-Range
Weather Forecasts
(ECMWF) model.
As with the previous ECHAM versions [Roeckner et al.,
1992, 1996], ECHAM4 is based
on the primitive equa-
tions. Prognostic variables are vorticity, divergence,
surface pressure, temperature, water vapor, cloud wa-
ter, and chemical species. Except for the water compo- nents and the chemical species, the prognostic variables are represented by spherical harmonics with triangular truncation at wavenumber 30 (T30). Advection of wa-
ter vapour, cloud water and chemical species is treated
with a semi-Lagrangian scheme [Williamson and Rasch,
1989]. A semi-implicit time-stepping scheme is em-
ployed with a weak time filter. The time step is 30 min for dynamics and physics, except for radiation, which is calculated at 2-hour intervals. A hybrid sigma-pressure coordinate system is used with 19 irregularly spaced lev-
els up to a pressure level of 10 hPa. The radiation code
has been adopted from the ECMWF model [Morcrette, 1991] with a few modifications such as the consideration of additional greenhouse gases (methane, nitrous oxide, and 16 CFCs) and various types of generic aerosols. The
radiation code has two spectral intervals in the short-
wave and six in the longwave and is similar to that used
by Boucher and Anderson [1995]. The shortwave part
of the ECMWF code, developed by Fouquart and Bon-
nel [1980], solves the radiative transfer equation by inte-
grating the fluxes between 0.2 and 4 tim. Solar radiation
is attenuated by absorbing gases (mainly, water vapor, carbon dioxide, oxygen and ozone) and scattered by
molecules, aerosol, and cloud particles. For the spectral
integration the scheme considers two intervals, one for
the visible (0.2-0.68 tim) and one for the near-infrared (0.68-4 tim). The cutoff at 0.68 tim makes the scheme
computationally efficient, inasmuch as interactions be-
tween gaseous absorption and scattering processes are
accounted for only in the near-infrared interval. Optical
properties of aerosol particles are calculated from Mie
theory [Koepke et al., 1997] and adapted to the broad- band model [I. Schult and R. van Dorland, personal communication, 1996]. Fractional cloud cover is param- eterized as a function of relative humidity [Roeckner, 1995; $undqvist, 1978]. ECHAM has been extensively applied and validated in climate studies [Cess et al.,
1990; Latif et al., 1990; Lohmann and Roeckner, 1995; Lohmann et al., 1995; Bengtsson et al., 1996; Wild et al.,
1996].
Transport, dry, and wet deposition of aerosol par-
ticles are calculated on-line in the model. Advective
transport of aerosols as well as vertical exchange in the
boundary layer and in convective clouds are handled in
the same way as the transport of water vapor. The per-
formance of this scheme was successfully tested using
the aerosol-like radionuclides lead-210 and beryllium-7
[Brost et al., 1991; Feichter et al., 1991]. However, there
appear to be some problems with the transport in the
Arctic region as mass concentrations of these aerosols
were underpredicted by the model.
5.2. Implementation of Carbonaceous Aerosol
in ECHAM
The emissions of carbonaceous aerosol were trans- formed from the 10 x 10 resolution to the T30 reso-
lution (--• 3.750 x 3.75
ø) by allocating
the appropriate
fraction of each emission grid cell to the appropriate
T30 resolution ECHAM grid cell.
The aerosol module used to model the carbonaceous
aerosol is based on that used for BC particles by Cooke


![Table 5a. Comparison With Cooke and Wilson [1996] and Penner et al. [1993] of Fossil Fuel Black Carbon Emissions by Region](https://thumb-eu.123doks.com/thumbv2/123doknet/13184092.391440/12.925.129.794.135.405/table-comparison-wilson-penner-fossil-carbon-emissions-region.webp)