Dissolved Pb and Pb isotopes in the North
Atlantic from the GEOVIDE transect
(GEOTRACES GA-01) and their decadal evolution
The MIT Faculty has made this article openly available.
Please share
how this access benefits you. Your story matters.
Citation
Zurbrick, Cheryl M. et al. “Dissolved Pb and Pb Isotopes in the North
Atlantic from the GEOVIDE Transect (GEOTRACES GA-01) and Their
Decadal Evolution.” Biogeosciences 15, 16 (August 2018): 4995–5014
© 2018 Author(s)
As Published
http://dx.doi.org/10.5194/bg-15-4995-2018
Publisher
Copernicus GmbH/European Geosciences Union
Version
Final published version
Citable link
http://hdl.handle.net/1721.1/118292
Terms of Use
Creative Commons Attribution 4.0 International License
https://doi.org/10.5194/bg-15-4995-2018 © Author(s) 2018. This work is distributed under the Creative Commons Attribution 4.0 License.
Dissolved Pb and Pb isotopes in the North Atlantic from
the GEOVIDE transect (GEOTRACES GA-01) and
their decadal evolution
Cheryl M. Zurbrick1, Edward A. Boyle1, Richard J. Kayser1, Matthew K. Reuer1, Jingfeng Wu1,7, Hélène Planquette2, Rachel Shelley2,6, Julia Boutorh2, Marie Cheize2, Leonardo Contreira3, Jan-Lukas Menzel Barraqueta4, François Lacan5, and Géraldine Sarthou2
1Earth, Atmospheric and Planetary Sciences, Massachusetts Institute of Technology, Cambridge, MA 02139, USA 2Laboratoire des Sciences de l’Environnement Marin (LEMAR), Institut Universitaire Europeìen de la Mer, Technopoôle
Brest-Iroise, 13 Plouzaneì 29280, France
3Universidade Federal do Rio Grande (FURG), Institute of Oceanography, Rio Grande, Brazil
4GEOMAR, Helmholtz Centre for Ocean Research, Kiel, Wischhofstraße 1–3, Build. 12, 24148 Kiel, Germany 5LEGOS, Laboratoire d’Etudes en Géophysique et Océanographie Spatiales, Université de Toulouse,
CNRS/CNES/IRD/UPS, Observatoire Midi Pyrénées, 14 Avenue Edouard Belin, 31400 Toulouse, France
6Earth, Ocean and Atmospheric Science, Florida State University, Tallahassee, FL 32306, USA 7College of Life Science and Oceanography, Shenzhen University, Shenzhen, China
Correspondence: Edward A. Boyle (eaboyle@mit.edu)
Received: 16 January 2018 – Discussion started: 2 February 2018
Revised: 9 July 2018 – Accepted: 12 July 2018 – Published: 22 August 2018
Abstract. During the 2014 GEOVIDE transect, seawater samples were collected for dissolved Pb and Pb isotope anal-ysis. These samples provide a high-resolution “snapshot” of the source regions for the present Pb distribution in the North Atlantic Ocean. Some of these stations were previously occu-pied for Pb from as early as 1981, and we compare the 2014 data with these older data, some of which are reported here for the first time. Lead concentrations were highest in sub-surface Mediterranean Water (MW) near the coast of Por-tugal, which agrees well with other recent observations by the US GEOTRACES program (Noble et al., 2015). The re-cently formed Labrador Sea Water (LSW) between Green-land and Nova Scotia is much lower in Pb concentration than the older LSW found in the West European Basin due to de-creases in Pb emissions into the atmosphere during the past 20 years. Comparison of North Atlantic data from 1989 to 2014 shows decreasing Pb concentrations consistent with de-creased anthropogenic inputs, active scavenging, and advec-tion/convection. Although the isotopic composition of north-ern North Atlantic seawater appears more homogenous com-pared to previous decades, a clear spatiotemporal trend in isotope ratios is evident over the past 15 years and implies
that small changes to atmospheric Pb emissions continue. Emissions data indicate that the relative proportions of US and European Pb sources to the ocean have been relatively uniform during the past 2 decades, while aerosol data may suggest a greater relative proportion of natural mineral Pb. Using our measurements in conjunction with emissions in-ventories, we support the findings of previous atmospheric analyses that a significant portion of the Pb deposited to the ocean in 2014 was natural, although it is obscured by the much greater solubility of anthropogenic aerosols over natu-ral ones.
1 Introduction
Humans have greatly perturbed the biogeochemical cycle of Pb, with the most dramatic changes during the 1950s–1990s (Schwikowski et al., 2004). This resulted in large increases in Pb to not only local environments (Harris and Davidson, 2005), but also to remote areas such as Greenland (Bory et al., 2014) and Antarctica (Rosman et al., 1994). Because Pb is a potent neurotoxin (ATSDR, 2007), efforts to reduce
an-Figure 1. Map of the cruise transect. GEOVIDE samples are solid black squares (concentration and isotope data) and circles (concen-tration data only). The blue star is GA 03 (2010); the red circles are Atlantis II 123 (1989); the white squares are EN328 (1999); the white triangles are JGOFS (1989); the red pentagons are TTO 1981; the blue squares are IOC-2 (1993); the yellow stars are GA 02 (2010).
thropogenic Pb emissions were widespread throughout the 1980s–1990s. Since the phasing out of leaded gasoline by most northern European and American countries and the passing of other forms of clean air regulation, atmospheric Pb emissions have declined dramatically in the past 3 decades (EMEP WebDab, 2017). As a result, far less Pb has been mobilized into the atmosphere and less deposited in remote places such as the open ocean.
Lead pollution in the North Atlantic Ocean has been stud-ied more than the other ocean basins. The United States con-sumed the largest quantity of leaded gasoline of any nation from 1930 to 1980, and carried by the prevailing westerly winds (30–60◦N), this produced the most visible oceanic contamination in the North Atlantic Ocean. Of relevance to this study (Fig. 1), surface Pb concentrations ([Pb]) were measured in 1981 (TTO, Weiss et al., 2003), 1989 (Atlantis II123, this work; JGOFS, Martin et al., 1993), 1993 (IOC-2, Veron et al., 1999), and 1999 (Endeavor 328, Noble et al., 2015, and this work). More recent campaigns through the GEOTRACES program occurred in 2010 (GA02, Schlitzer et al., 2018) and 2010/2011 (GA03, Noble et al., 2015).
In the western North Atlantic, repeat sampling of time se-ries locations has documented the reduction in oceanic [Pb] and changes in sources with time. At BATS (Bermuda At-lantic Time Series) in the 1970s and 1980s, concentrations were 80–160 pmol kg−1 near the surface, but 25 pmol kg−1
at depth (Boyle et al., 2014, and references therein). As Pb emissions were reduced and older high-Pb surface wa-ters penetrated the interior, elevated [Pb] could be seen as a subsurface plume in waters at increasingly deeper depths over time. At the latest occupation of BATS in 2011, surface water concentrations were less than 20 pmol kg−1 (Noble et al., 2015) compared to 160 pmol kg−1 observed in 1979 (Schaule and Patterson, 1983) and ∼ 200 pmol kg−1inferred from coral data from the mid-1970s (Kelly et al., 2009). De-spite a dramatic reduction in [Pb], it is still believed that a large fraction of current Pb deposition results from coal and other combustion, and industrial processes, based on positive matrix factorization analysis of aerosols (Shelley et al., 2017, 2018; Noble et al., 2015). In the tropical Atlantic, another 2010–2011 study found that 50 %–70 % of Pb in the surface ocean was anthropogenic in origin (Bridgestock et al., 2016), with the remaining fraction from natural North African dust. Our aim in this study was to evaluate whether the North Atlantic Ocean was still dominated by anthropogenic sources as in previous expeditions, and if so which ones. This was motivated by the changes in sources documented by Noble et al. (2014) in their study of Pb sources to the mid-North At-lantic, who found a shift from North American to European to industrial sources of Pb over the past couple of decades. The North Atlantic Ocean has been well studied for Pb con-tamination since the 1970s, enabling us to place this work in the greater context of historical Pb emissions. This study was strongly enhanced by the partnership of the environmen-tal trace meenvironmen-tal GEOTRACES program with the OVIDE pro-gram’s long-term studies of physical oceanographic parame-ters in the northeastern Atlantic (García-Ibáñez et al., 2015).
2 Methods
2.1 Sample collection
The GEOVIDE cruise track began in Lisbon, Portugal, on 15 May 2014 and followed the OVIDE section from the Iberian upwelling system to the subpolar North Atlantic region up to the Greenland margin before continuing on to the Labrador Sea at the Canadian margin, finishing on 30 June 2014. One liter Nalgene HDPE sample storage bot-tles were acid cleaned and stored, and double-bagged as pre-viously described (Noble et al., 2015). Trace metal clean seawater samples were collected using the French GEO-TRACES clean rosette (General Oceanics Inc. Model 1018 Intelligent Rosette), equipped with new, pre-cleaned 12 L GO-FLO bottles (Cutter and Bruland, 2012). The rosette was deployed on a 6 mm Kevlar cable with a dedicated custom-designed clean winch. Immediately after recovery, GO-FLO bottles were individually covered at each end with plastic bags to minimize contamination. They were then transferred into a clean container (ventilated by class-100 source air) for sampling. For Stations 1, 11, 15, 17, 19, 21, 25, 26,
29, and 32, samples were filtered with 0.2 µm capsule fil-ters (SARTOBRAN® 300, Sartorius). For all other stations (13, 34, 36, 38, 40, 42, 44, 49, 60, 64, 68, 69, 71, 77) sea-water was filtered directly through paired filters (Pall Gel-man Supor 0.45 µm polystersulfone, and Millipore mixed es-ter cellulose MF 5 µm) mounted in Swinnex polypropylene filter holders, following the Planquette and Sherrell (2012) method. All samples were acidified back in the MIT labora-tory with 2 mL trace metal clean 6 M HCl per liter of seawa-ter (final pH ∼ 2).
Previously unpublished Pb and Pb isotope data from cruises from 1989 (Atlantis II cruise 123) and 1999 (En-deavor cruise EN328) are included here for evaluation of the decadal evolution of Pb in the eastern North Atlantic. We supplement our 1989 data with two published JGOFS stations (Martin et al., 1993). Our 1989 samples were col-lected using “vane bulb” samplers (Boyle et al., 1986) and the 1999 samples were collected using the MITESS moor-ing sampler (Bell et al., 2002). Samples were stored in acid-cleaned 250 mL HDPE bottles.
2.2 Pb concentrations
GEOVIDE samples were analyzed for Pb concentrations at least 1 month after acidification during more than 36 analyt-ical sessions using the isotope-dilution ICP-MS method de-scribed in Lee et al. (2011), which includes pre-concentration on nitrilotriacetate (NTA) resin and analysis on a quadrupole ICP-MS (Fisons PQ2+). Method details including all clean-ing protocols are available in the metadata file, along with the data, in the BCO-DMO repository (see Sect. 2.4).
Briefly, triplicate subsamples (1.3 mL) were spiked with a known 204Pb spike and the pH was raised to 5.3 using a trace metal clean ammonium acetate buffer, prepared at a pH of between 7.95 and 7.98. Approximately 2400 beads of cleaned NTA Superflow resin (Qiagen Inc., Valencia, CA) were added to the mixture and equilibrated. After equilibra-tion, the resin was rinsed with distilled water and then Pb was eluted with a 0.1 M solution of trace metal clean HNO3
before analysis by ICP-MS.
On each day of sample analysis, procedural blanks were determined for 12 replicates of in-house reference seawa-ter with negligible [Pb]. The blanks analyzed concurrently with these samples ranged from 2.2 to 9.9 pmol kg−1, aver-aging 4.6 ± 1.7 pmol kg−1. Within a day, procedure blanks were very reproducible, with an average standard deviation of 0.7 pmol kg−1, resulting in detection limits (3× the low-level standard deviation) of 2.1 pmol kg−1. Replicate anal-yses of three different large-volume seawater samples (one with ∼ 11 pmol kg−1, another with ∼ 24 pmol kg−1, and a third with ∼ 38 pmol kg−1) indicated that the precision of the analysis is 4 % or 1.6 pmol kg−1, whichever is larger. Tripli-cate analyses of an international reference standard, SAFe D2, were 27.2 ± 1.7 pmol kg−1.
Pb concentration analysis for 1989 samples (Atlantis II 123) was achieved by204Pb isotope dilution with Mg(OH)2
coprecipitation followed by VG PQ2+ quadrupole ICPMS (Wu and Boyle, 1997) (analyzed in 1996) and 1999 (En-deavor 328) Stations 4, 5, 7, 9, 10 and 11 (analyzed be-tween 1999 and 2003). Endeavor 328 Stations 2, 3, 8, and 10 were determined using NTA-extraction ID ICPMS (Lee et al., 2011) (determined in 2010). Long-term quality control seawater samples were included in each run, and overlapped with new QC samples when the previous QC samples were depleted. Endeavor 328 Station 10 was determined twice by two analysts 8 years apart (in 2002 by Mg(OH)2
coprecipita-tion ID-ICPMS, and in 2010 by NTA-extraccoprecipita-tion ID ICPMS). A regression of the 2010 vs. 2002 data forced through the origin had a slope of 0.945. We suggest that this small off-set provides a reasonable estimate of our inter-decadal an-alytical reproducibility. It also demonstrates that Pb is not continuously leached from well-cleaned HDPE bottles dur-ing decadal-scale storage.
2.3 Stable Pb isotopes
GEOVIDE samples were analyzed for stable Pb isotopes during 11 mass spectrometry sessions by the method of Reuer et al. (2003) as modified by Boyle et al. (2012). In brief, ∼ 500 mL of seawater was pre-concentrated using a low-blank double magnesium hydroxide co-precipitation, in-duced by minimal addition of high-purity ammonia solution and mixing (typically 8 µL ammonia per 1 mL seawater sam-ple). The precipitate was dissolved in a minimal amount of high-purity 6 M HCl before undergoing another ammonia ad-dition and second Mg(OH)2 coprecipitation. The final
pre-cipitate was dissolved in ∼ 1 mL of high purity 1.1 M HBr the day of purification by anion exchange chromatography (Eichrom AG1x8). Samples were dried and stored in PTFE vials until isotope ratio analysis on a GV / Micromass Iso-Probe multicollector ICPMS using an APEX / SPIRO desol-vator. Just before analysis, samples were dissolved for sev-eral minutes in 10 µL concentrated ultrapure HNO3followed
by addition of 400 µL of ultrapure water and spiked with an appropriate amount of Tl for mass fractionation correction. IsoProbe multicollector ICPMS Faraday cups were used to collect on202Hg, 203Tl, 205Tl,206Pb,207Pb, and208Pb. An Isotopx Daly detector with a WARP filter was used to collect on204Pb +204Hg. Because the deadtime of the Daly detector varied from day to day, we calibrated deadtime on each day by running a standard with known206Pb /204Pb at a high 204 count rate. The counter efficiency drifts during the course of a day, so we established that drift by running a standard with known206Pb /204Pb (and a 204 count rate comparable to the samples) every five samples. Tailing from one Faraday cup to the next was corrected by the209Bi half-mass method as described by Thirlwall (2000).
On each analytical date, we calibrated the instrument by running NBS981 and normalized measured sample isotope
Table 1. 2σ pooled standard deviation of duplicate Pb isotope anal-yses. [Pb] 206Pb /207Pb 208Pb /207Pb 206Pb /204Pb pmol kg−1 0–20 0.0077 (n = 10) 0.0025 (n = 10) 0.09 (n = 4) 20–40 0.0030 (n = 15) 0.0021 (n = 15) 0.08 (n = 14) 40–60 0.0007 (n = 8) 0.0021 (n = 8) 0.08 (n = 4)
ratios to our measured raw NBS981 isotope ratios to those established by Baker et al. (2004). Using this method for 22 determinations of an in-house Pb isotope standard solution shows that for samples near the upper range of the Pb signals shown for samples (∼ 1 V),206Pb /207Pb and208Pb /207Pb were reproduced to ∼ 200 ppm (2 SE). Low-level samples will be worse than that but generally better than 1000 ppm (2 SE) in this data set. Because of the drift uncertainty in the Daly detector,206Pb /204Pb for samples in the mid-to-upper range of sample concentrations will be reproducible at best to ∼ 500 ppm (2 SE).
We have intercalibrated Pb isotope analyses with two labs as reported in Boyle et al. (2012). The outcome of that inter-calibration suggests that the accuracy of our measurements approaches the internal analytical reproducibility we note above.
Pb isotope precision for the complete analytical proce-dure can be assessed by duplicate measurements of sam-ples. In most cases, the replicated samples were chosen be-cause they fell off of the trend of adjacent samples. That could be due either to contamination of the subsample used for the analysis or to the contamination of the sample in its primary sample bottle. As shown in Fig. S2 in the Supple-ment, the replicate analysis usually agreed within better than 1000 ppm for206Pb /207Pb and208Pb /207Pb, and 5000 ppm for206Pb /204Pb. Given a fixed sample size and an order of magnitude range of Pb concentrations in samples, the poorest replicates are at the lower concentrations. Using the pooled 2 sigma standard deviation of duplicates (excluding a few out-liers), the formal statistics are shown in Table 1.
Pb isotope data from the 1999 samples were obtained by IsoProbe Multicollector ICPMS after Mg(OH)2
precon-centration and anion exchange purification as described by Reuer et al. (2003). As for the GEOVIDE samples, the mass spectrometer was calibrated using NBS981.
2.4 Data management
All [Pb] and isotope data related to the GEOVIDE data set in this manuscript have been submitted to BCO-DMO and are available at http://www.bco-dmo.org/dataset/651880/ data (last access: 3 August 2018) and http://www.bco-dmo. org/dataset/652127/data (last access: 3 August 2018) (Boyle et al., 2016) and from the 2017 BODC International
GEO-Figure 2. Near-surface (11–20 m) concentrations of Pb. Plot created in Ocean Data View (Schlitzer, 2017).
TRACES Intermediate Data Product v2 (Schlitzer, 2018). All other data are available in Table 2.
3 Results and discussion 3.1 Outliers
In this data set, we did not encounter any samples that did not yield acceptably reproducible results upon repeated analysis, so we believe that the data truly represent the concentration and isotope ratio of Pb in the sample collection bottle. How-ever, there were a few samples with elevated Pb (based on comparison to adjacent samples) and for which no obvious hydrographic argument could be made for the anomaly. We observed that the samples taken from the GOFlo in rosette position 1 (usually the near-bottom sample) were always higher in [Pb] than the samples taken immediately above that, and that the excess decreased as the cruise proceeded (Fig. S1). The Pb isotope ratios of these samples were higher than the comparison bottles as well. At two stations, where our near-bottom sample was taken from rosette position 2 rather than 1, there was no Pb excess over the samples imme-diately above. We believe that this evidence points to GoFLO bottle-induced contamination that was being slowly washed out during the cruise, but never completely. A similar pattern was observed for the samples taken from rosette positions 5, 20 and 21, when compared to the depth-interpolated [Pb] from the samples immediately above and below. We do not believe that these samples should be trusted as reflecting true ocean [Pb], so all of the samples from these GOFlos are ex-cluded in our discussion of this work, although they are in-cluded and flagged as unreliable within the data repositories. In addition, we observed high [Pb] in most of the sam-ples from Station 1 and very scattered Pb isotope ratios. The majority of these concentrations were far in excess of those values observed at nearby Station 11, and also the nearby USGT10-01 (Noble et al., 2015). Discussion among
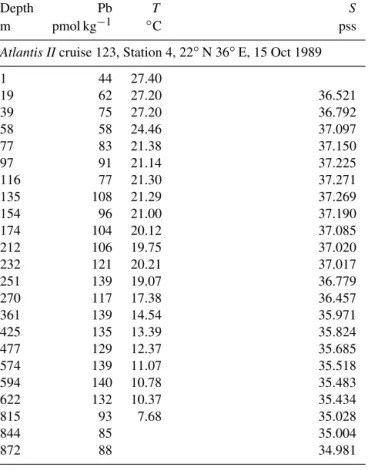
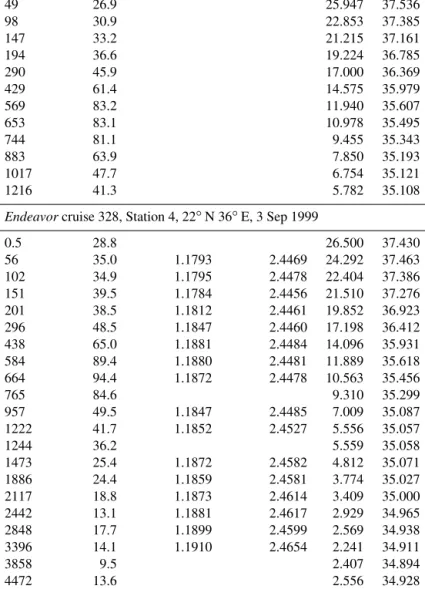
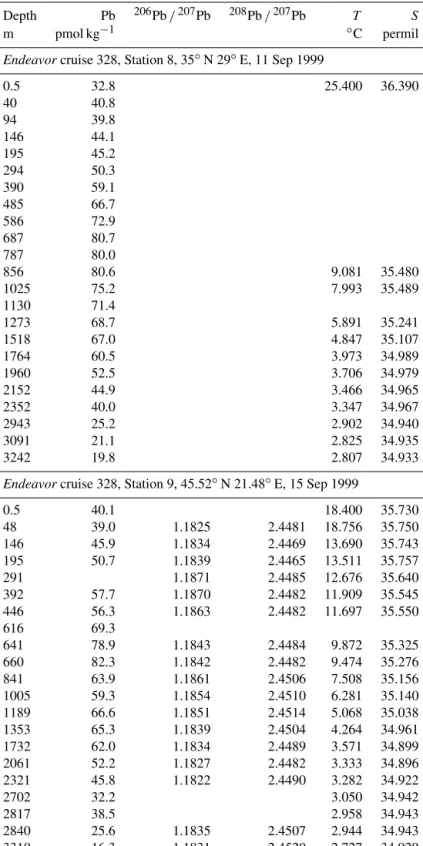
Table 2. Data from the 1989 Atlantis II 123 and 1999 EN328 cruises.
Depth Pb T S
m pmol kg−1 ◦C pss
Atlantis IIcruise 123, Station 4, 22◦N 36◦E, 15 Oct 1989
1 44 27.40 19 62 27.20 36.521 39 75 27.20 36.792 58 58 24.46 37.097 77 83 21.38 37.150 97 91 21.14 37.225 116 77 21.30 37.271 135 108 21.29 37.269 154 96 21.00 37.190 174 104 20.12 37.085 212 106 19.75 37.020 232 121 20.21 37.017 251 139 19.07 36.779 270 117 17.38 36.457 361 139 14.54 35.971 425 135 13.39 35.824 477 129 12.37 35.685 574 139 11.07 35.518 594 140 10.78 35.483 622 132 10.37 35.434 815 93 7.68 35.028 844 85 35.004 872 88 34.981
Atlantis IIcruise 123, Station 5, 26.33◦N 33.67◦E, 16 Oct 1989
1 47 27.20 37.389 19 74 27.20 37.384 39 74 27.06 37.364 77 95 21.53 37.336 97 112 21.35 37.282 116 111 21.37 37.262 135 103 21.21 37.230 154 99 20.95 37.173 174 111 20.46 37.065 193 106 19.33 36.863 212 114 18.70 36.717 359 158 14.98 36.047 476 156 13.19 35.790 575 156 11.78 35.606 595 162 11.56 35.580 624 132 11.26 35.541 879 101 35.173 1018 83 35.092 1244 89 35.063 1278 95 35.069 Table 2. Continued. Depth Pb T S m pmol kg−1 ◦C pss
Atlantis IIcruise 123, Station 7, 31◦N 31◦E, 20 Oct 1989
1 95 21.10 19 97 39 100 58 89 22.59 35.334 77 94 19.33 36.795 97 85 18.84 36.697 116 94 18.61 36.655 154 104 18.09 36.553 174 100 17.71 36.488 193 104 17.33 36.429 212 117 16.97 36.363 232 119 16.58 36.293 366 134 14.26 35.928 405 130 13.74 35.862 484 135 12.74 35.730 582 136 11.67 35.592 601 136 11.53 35.575 630 145 11.31 35.547 826 100 9.27 35.404 883 92 35.331 1244 75 35.328 1312 71 6.44 35.303
Atlantis IIcruise 123, Station 9, 35◦N 29◦E, 22 Oct 1989
1 94 22.50 36.480 19 90 22.50 36.480 58 86 22.20 36.473 97 87 16.88 36.186 194 99 14.77 35.947 253 115 14.33 35.835 272 106 13.97 35.793 389 116 13.19 35.665 409 110 13.09 35.639 488 105 11.97 35.604 587 123 11.52 35.483 607 121 11.28 35.480 836 104 10.43 35.551 865 99 10.00 35.544 1294 88 35.257 1328 91 10.67 35.225
Table 2. Continued.
Depth Pb 206Pb /207Pb 208Pb /207Pb T S
m pmol kg−1 ◦C permil
Endeavorcruise 328, Station 2, 26.5◦N 38.5◦E, 1 Sep 1999
0.5 36.9 26.600 37.590 48 39.1 26.191 37.573 146 37.9 19.896 36.832 196 41.0 18.237 36.552 293 48.3 16.741 36.318 441 60.3 14.536 35.974 589 80.3 12.503 35.689 687 89.9 10.994 35.505 785 79.4 9.246 35.326 931 65.2 7.772 35.195 1076 51.1 6.626 35.142 1273 44.6 5.820 35.150
Endeavorcruise 328, Station 3, 24◦N 37.5◦E, 2 Sep 1999
0.5 25.5 21.800 36.120 49 26.9 25.947 37.536 98 30.9 22.853 37.385 147 33.2 21.215 37.161 194 36.6 19.224 36.785 290 45.9 17.000 36.369 429 61.4 14.575 35.979 569 83.2 11.940 35.607 653 83.1 10.978 35.495 744 81.1 9.455 35.343 883 63.9 7.850 35.193 1017 47.7 6.754 35.121 1216 41.3 5.782 35.108
Endeavorcruise 328, Station 4, 22◦N 36◦E, 3 Sep 1999
0.5 28.8 26.500 37.430 56 35.0 1.1793 2.4469 24.292 37.463 102 34.9 1.1795 2.4478 22.404 37.386 151 39.5 1.1784 2.4456 21.510 37.276 201 38.5 1.1812 2.4461 19.852 36.923 296 48.5 1.1847 2.4460 17.198 36.412 438 65.0 1.1881 2.4484 14.096 35.931 584 89.4 1.1880 2.4481 11.889 35.618 664 94.4 1.1872 2.4478 10.563 35.456 765 84.6 9.310 35.299 957 49.5 1.1847 2.4485 7.009 35.087 1222 41.7 1.1852 2.4527 5.556 35.057 1244 36.2 5.559 35.058 1473 25.4 1.1872 2.4582 4.812 35.071 1886 24.4 1.1859 2.4581 3.774 35.027 2117 18.8 1.1873 2.4614 3.409 35.000 2442 13.1 1.1881 2.4617 2.929 34.965 2848 17.7 1.1899 2.4599 2.569 34.938 3396 14.1 1.1910 2.4654 2.241 34.911 3858 9.5 2.407 34.894 4472 13.6 2.556 34.928 5293 8.9 2.406 34.876
Table 2. Continued.
Depth Pb 206Pb /207Pb 208Pb /207Pb T S
m pmol kg−1 ◦C permil
Endeavorcruise 328, Station 5, 26.33◦N 33.67◦E, 6 Sep 1999
0.5 37.8 26.300 37.560 50 39.5 26.234 100 38.6 20.685 150 43.6 19.399 200 44.3 17.815 304 49.1 16.130 439 61.4 13.939 585 86.6 12.386 35.684 680 97.9 10.794 35.505 781 87.8 9.629 925 71.6 8.158 1054 64.5 7.118 1283 42.9 6.242 1459 44.4 5.623 35.207 1955 34.4 4.184 35.082 2299 25.2 3.482 35.008 2638 20.3 3.013 34.962 3810 14.4 2.453 34.899
Endeavorcruise 328, Station 6, 27.5◦N 29.33◦E, 7 Sep 1999
0.5 40.5 25.600 37.440 52 43.9 25.353 37.274 100 45.7 20.192 36.973 149 43.8 19.566 36.972 198 48.5 18.041 36.640 295 53.0 15.842 36.192 437 66.5 13.819 35.880 590 95.0 10.609 35.438 682 98.6 780 91.8 9.604 35.397 933 75.5 8.225 35.293 1078 59.4 7.464 35.248 1272 52.0 6.447 35.264
Endeavorcruise 328, Station 7, 31◦N 31◦E, 9 Sep 1999
0.5 37.8 26.000 37.050 47 38.8 1.1783 2.4452 23.523 36.932 98 32.3 1.1783 2.4458 20.337 36.763 98 34.1 1.1783 2.4445 20.337 36.763 148 42.2 7.620 34.411 197 41.3 1.1829 2.4455 18.186 36.558 295 46.4 1.1842 2.4471 16.676 36.294 436 56.8 1.1866 2.4483 14.879 36.018 586 58.3 1.1888 2.4493 12.734 35.716 680 68.1 1.1865 2.4468 11.259 35.520 782 82.4 1.1867 2.4478 9.903 35.405 937 75.9 1.1846 2.4492 8.310 35.351 1261 62.6 1.1821 2.4507 6.498 35.322 1458 65.1 1.1812 2.4505 5.725 35.264 1745 49.7 1.1806 2.4501 4.606 35.142 2038 43.9 1.1803 2.4506 3.857 35.060 2337 36.1 1.1808 2.4518 3.198 34.990 2681 16.3 2.797 34.956 3528 1.1812 2.4532 2.261 34.912 4016 12.6 2.510 0.000 4311 16.5 2.506 0.000
Table 2. Continued.
Depth Pb 206Pb /207Pb 208Pb /207Pb T S
m pmol kg−1 ◦C permil
Endeavorcruise 328, Station 8, 35◦N 29◦E, 11 Sep 1999
0.5 32.8 25.400 36.390 40 40.8 94 39.8 146 44.1 195 45.2 294 50.3 390 59.1 485 66.7 586 72.9 687 80.7 787 80.0 856 80.6 9.081 35.480 1025 75.2 7.993 35.489 1130 71.4 1273 68.7 5.891 35.241 1518 67.0 4.847 35.107 1764 60.5 3.973 34.989 1960 52.5 3.706 34.979 2152 44.9 3.466 34.965 2352 40.0 3.347 34.967 2943 25.2 2.902 34.940 3091 21.1 2.825 34.935 3242 19.8 2.807 34.933
Endeavorcruise 328, Station 9, 45.52◦N 21.48◦E, 15 Sep 1999
0.5 40.1 18.400 35.730 48 39.0 1.1825 2.4481 18.756 35.750 146 45.9 1.1834 2.4469 13.690 35.743 195 50.7 1.1839 2.4465 13.511 35.757 291 1.1871 2.4485 12.676 35.640 392 57.7 1.1870 2.4482 11.909 35.545 446 56.3 1.1863 2.4482 11.697 35.550 616 69.3 641 78.9 1.1843 2.4484 9.872 35.325 660 82.3 1.1842 2.4482 9.474 35.276 841 63.9 1.1861 2.4506 7.508 35.156 1005 59.3 1.1854 2.4510 6.281 35.140 1189 66.6 1.1851 2.4514 5.068 35.038 1353 65.3 1.1839 2.4504 4.264 34.961 1732 62.0 1.1834 2.4489 3.571 34.899 2061 52.2 1.1827 2.4482 3.333 34.896 2321 45.8 1.1822 2.4490 3.282 34.922 2702 32.2 3.050 34.942 2817 38.5 2.958 34.943 2840 25.6 1.1835 2.4507 2.944 34.943 3310 16.3 1.1831 2.4520 2.727 34.929
Table 2. Continued.
Depth Pb 206Pb /207Pb 208Pb /207Pb T S
m pmol kg−1 ◦C permil
Endeavorcruise 328, Station 10, 42◦N 17.75◦E, 16 Sep 1999
0.5 53.5 20.000 35.900 39 50.4 1.1797 2.4438 18.929 35.855 95 51.9 13.555 35.762 147 56.0 1.1794 2.4438 13.025 35.740 197 54.1 1.1808 2.4443 12.589 35.684 294 54.4 1.1830 2.4468 12.014 35.612 441 67.0 1.1811 2.4458 11.464 35.575 588 76.3 1.1830 2.4466 10.641 35.474 688 85.2 1.1814 2.4458 10.464 35.536 780 91.3 1.1821 2.4462 10.459 35.655 931 90.0 1.1804 2.4483 10.430 35.873 1078 88.3 1.1800 2.4479 9.901 35.898 1272 78.8 1.1814 2.4487 7.886 35.602 1440 74.2 1.1813 2.4471 5.519 35.211 1680 69.5 1.1814 2.4465 4.043 34.995 1864 67.5 1906 77.5 1.1819 2.4477 3.494 34.935 2215 45.3 1.1796 2.4467 3.348 34.963 2518 35.9 1.1788 2.4455 2.983 34.961 2974 33.6 3604 16.9 1.1811 2.4508 2.281 34.915 4086 17.6 1.1815 2.4522 2.176 34.905 Endeavorcruise 328, Station 11, 38.58◦N 22.28◦E, 19 Sep 1999
0.5 52.3 22.600 36.480 50 50.2 99 48.4 150 95.9 196 63.7 14.829 35.997 296 67.1 13.613 35.838 429 72.8 12.393 35.688 586 91.3 11.207 35.552 659 81.7 784 95.9 10.467 35.628 876 82.4 9.057 35.450 1150 80.9 1270 77.4 7.149 35.442 1635 75.7 4.690 35.088 1925 75.7 2046 62.6 3.707 34.976 2344 51.5 3.337 34.967 2557 37.8 3.128 34.958 2845 42.4 2.872 34.947 3025 31.1 2.767 34.937 3331 28.3 2.652 34.928 3468 28.2 2.622 34.923 3907 30.3 2.586 34.913 4212 25.1 2.568 34.908
other cruise participants revealed similarly anomalous data for other trace metals (e.g., Hg species; Lars-Eric Heim-burger, personal communication, 2016). After discussion at the 2016 GEOVIDE post-cruise workshop, we came to the conclusion that this is evidence of GoFlo bottles not having sufficient time to “clean up” prior to use, and that most or all bottles from Station 1 were contaminated. Station 1 data are not discussed in this work, but as with the suspicious GOF-los throughout the cruise, the Station 1 data are included and flagged as unreliable in the data repositories.
We include mention of these outlier data to demonstrate the high quality of our other data, and to encourage future ex-peditions to both clean their GOFlo bottles before the cruise (as was done here) and also test them for contamination-prone elements prior to embarking on their research expe-ditions or onboard (e.g., Fe as in Measures et al., 1995). As demonstrated after Station 1, although soaking in seawa-ter is often sufficient to “clean” the bottles, gaskets or other bottle components could remain as persistent contamination sources, as seen on 4 of the 24 bottles from this expedition. 3.2 Near-surface ocean
Near-surface waters (11–20 m) displayed a moderate range in [Pb] of 11–30 pmol kg−1across the transect (Fig. 2). The highest concentration was located near the Portuguese coast (30 pmol kg−1). Lead concentrations decreased 3-fold with distance from the coast, down to 11.5 pmol kg−1, in the core of the far arm of the North Atlantic Current. An excellent pic-torial representation of the relevant water masses discussed here can be found in García-Ibáñez et al. (2018). Near-surface concentrations were higher in the Iceland Basin and Irminger Sea (Stations 21–60; 18.8–23.5 pmol kg−1), and in Station 64, just past the tip of Greenland. The remainder of the Labrador Sea (Stations 68–77) had lower [Pb] (12.1– 16.2 pmol kg−1).
The pattern of decreasing [Pb] over the Iberian Abyssal Plain (Stations 11–19) correlates strongly with increasing distance from the shore (Pearson’s correlation, r = −0.989, p <0.001). This finding agrees well with atmospheric de-position models that show higher dust inputs closer to the African continent (Schepanski et al., 2009). Stations located north of 55◦in the meandering NAC have higher concentra-tions than those in the West European Basin. Although dust deposition to the North Atlantic Ocean is typically associ-ated with northern African dust from the Sahara, Prospero et al. (2012) and Bullard et al. (2016) found that high-latitude dust emissions, specifically volcanic-based soils from Ice-land, could be substantial enough to impact oceanic Fe cy-cling; therefore we suggest that the elevated Pb in the near-surface waters of the Iceland Basin and Irminger Sea may possibly be dust-derived. In the GEOVIDE shipboard aerosol data (Shelley et al., 2017, 2018), Pb concentrations were high in the Iceland Basin but low in the Irminger Sea. However, as Pb has a residence time of ∼ 1 year in this region, seasonal
changes in the flux also could account for this difference. As the North Atlantic Current becomes the Irminger Current near Greenland and joins with the East Greenland Current, they wrap around the southern tip of Greenland and flow to-ward the Arctic Circle. This entrains Pb into the northeast-ern part of the Labrador Sea, whereas the remainder of the Labrador Sea is influenced by the Labrador Current, return-ing from the Arctic, which has low [Pb].
Despite the variations in [Pb] across the Atlantic Ocean, Pb isotope ratios were relatively homogenous throughout the section, and largely decoupled from the [Pb] patterns (Figs. 3 and 4). 206Pb /207Pb isotope ratios varied from 1.178 to 1.186, with the majority of samples analyzed being 1.180– 1.183.208Pb /206Pb and206Pb /204Pb isotope ratios showed similar minimal variability. No trend in isotope ratios was observed in the Iberian Abyssal Plain extending away from the coast. The low variability of isotope ratios indicates that the majority of Pb in the North Atlantic Ocean is well mixed in the atmosphere prior to deposition. The relatively low [Pb] and similar isotope ratios contrast sharply with surface wa-ter measurements from the previous century (Figs. 5 and 6). During the 1970s to early 1990s, the predominant source of Pb to the North Atlantic was US leaded gasoline (Weiss et al., 2003; Martin et al., 1993; Veron et al., 1999), which was reflected in the high206Pb /207Pb isotope ratios (∼ 1.20).
The mixed layer [Pb] nearest the Iberian Peninsula (30 pmol kg−1) is lower than that measured by the 2010 US GEOTRACES expedition (42 pmol kg−1), which we at-tribute to the much closer proximity of the US GEOTRACES station to the coastline (50 km) than GEOVIDE Station 11 (280 km). As mentioned previously, [Pb] at GEOVIDE Sta-tions 11–19 has a strong inverse correlation with distance from the shore, and adding USGT10-01 (GA-03) main-tains this high correlation (Pearson correlation, r = −0.990, p <0.001). Isotopically, the USGT10-01 near-surface waters are similar to GEOVIDE Station 11, indicating similar Pb sources in recent years.
3.3 Iberian Abyssal Plain (S11–S19) and West European Basin (S21–S29)
Overall, [Pb] measured from this cruise was highest in the subsurface waters of the Iberian Abyssal Plain (Station 13). The core of the elevated concentrations (∼ 61 pmol kg−1, Station 13) was ∼ 1200 m deep and several hundred kilo-meters from the coast. This subsurface plume of Pb (con-centrations of 40–50 pmol kg−1) was dispersed throughout the Iberian Abyssal Plain at depths of 700–2000 m. The Pb plume was less pronounced in the rest of the West European Basin, with concentrations of 30–40 pmol kg−1. Extended Optimum MultiParameter (eOMP) water mass analysis shows that this elevated [Pb] coincides with Mediterranean Water (MW) from 700 to 1500 m and Labrador Sea Water (LSW) from 1500 to 2000 m (García-Ibáñez et al., 2018). Our finding is in good agreement with [Pb] in MW measured
Figure 3. Section plot of Pb concentrations in the GEOVIDE section. Plot created in Ocean Data View (Schlitzer, 2017).
Figure 4. Section plot of206Pb /207Pb concentrations in the GEOVIDE section. Plot created in Ocean Data View (Schlitzer, 2017).
in 2010–2011 by Noble et al. (2015) and highlights the high [Pb] previously found in the Mediterranean Sea (Moos and Boyle, 2018). In the lower portion of the plume, the LSW in the Iberian Abyssal Plain and West European Basin is among the oldest water sampled during this expedition. Ac-cording to CFC-11 data, LSW in this region has a combined age (subduction plus admixed relic age) of ∼ 25 years (Fine, 2011). That age and the elevated [Pb] observed are con-sistent with the atmospheric Pb emissions by North Amer-ica and Europe in the 1980s. The isotope ratios further support this finding, as the ocean interior has similar iso-tope ratios throughout (206Pb /207Pb = 1.1832 ± 0.0025, 1σ ;
208Pb /206Pb = 2.4525 ± 0.0024, 1σ ), but these are
distin-guishably more like US aerosols from the early 1990s (Boll-höfer and Rosman, 2001) at the core of the Pb maximum (Station 13,206Pb /207Pb = 1.1894;208Pb /206Pb = 2.4544; Fig. 5).
The offshore profiles (Stations 13–29) showed consistent decreases in [Pb] in the MW and LSW from 1989 (JGOFS S19) and 1999 (Endeavor 328 S15, 17, 21) to 2014 (Martin et al., 1993; this work). In the 10–15 years between sampling events the Pb maxima advected into the ocean interior as the more shallow waters were ventilated with lower-Pb surface
waters, a trend also seen in the western North Atlantic near Bermuda (Boyle et al., 2012).
Below the broad subsurface plume, water mass analy-sis indicates depths greater than 2500 m are predominantly Northeast Atlantic Deep Water (NEADW) that contains a major component of Antarctic Bottom Water (AABW), as evidenced by high silica concentrations (García-Ibáñez et al., 2018). In the NEADW, [Pb] were 10–20 pmol kg−1 and similar to previous sampling campaigns nearby in 1989 and 1999 (Fig. 5). Isotope ratios (206Pb /207Pb = 1.1827 ± 0.0013;208Pb /206Pb = 2.4511 ± 0.0013) were also similar across the 25 years in the West European Basin (Fig. 6). This makes sense because the estimated age of NEADW is several hundreds of years (Matsumoto, 2007).
Below 1000 m, the [Pb] at Stations 11 and 13 was very similar to the 2010 [Pb] measured on GA03 (USGT10-01; Fig. 5), but the isotope ratios are dissimilar (Fig. 6). Con-versely, the upper 1000 m of the water column had different [Pb] but similar isotope ratios. In the upper ocean, this dis-crepancy can be related to the distance of the stations from the shore, as calculated in Sect. 3.2, with greater Pb inputs and therefore greater concentrations at stations closer to the shore. In the deep ocean, the contrast in isotope ratios be-tween the more coastal GA03 station and offshore
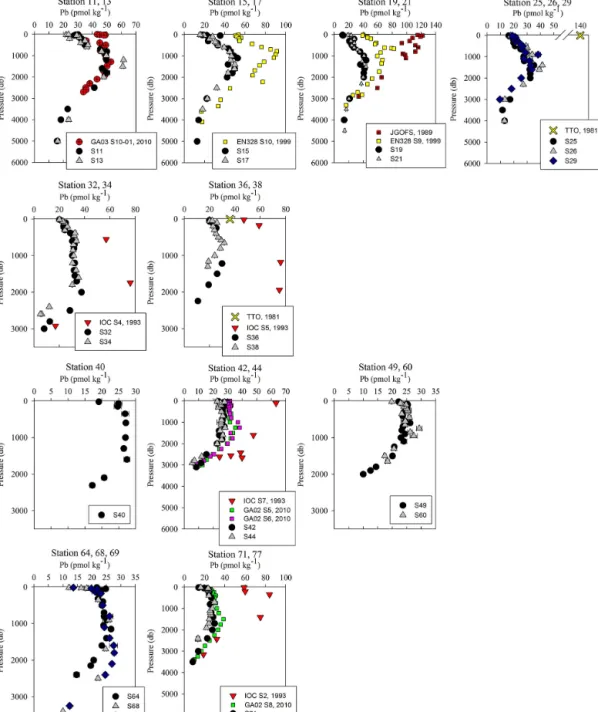
GEO-Figure 5. Pb concentration depth profiles. References: GA03 (Noble et al., 2015); EN328 (this work); JGOFS (Martin et al., 1993); TTO (Weiss et al., 2003); IOC-2 (Veron et al., 1999); GA02 (The GEOTRACES Group, 2015).
VIDE station, only 4 years apart, supports the eOMP find-ings that slightly different mixes of water masses were sam-pled in the two cruises. Despite the close proximity of the two stations (∼ 250 km), the GEOVIDE cruise sampled wa-ters > 1000 m that had relatively more LSW and less MW (or MOW per Jenkins) compared to the 2010 GA03 station (Jenkins et al., 2015; García-Ibáñez et al., 2017).
3.4 Iceland Basin (S32–S36) and Reykjanes Ridge (S38)
In the Iceland Basin and above the Reykjanes Ridge, [Pb] throughout the water column is similar to that found in the West European Basin, with a subsurface [Pb] maxi-mum (∼ 30 pmol kg−1) in the core of LSW. In the deep-est samples (2500–3000 m), [Pb] (5–10 pmol kg−1) is lower than the NEADW observed in the Iberian Abyssal Plain and West European Basin, and the 206Pb /207Pb isotope ratios
Figure 6.206Pb /207Pb isotope ratio depth profiles. References: GA03 (Noble et al., 2015); EN328 (this work); TTO (Weiss et al., 2003); IOC-2 (Veron et al., 1999).
are slightly lower (206Pb /207Pb = 1.1812 ± 0.0005) than the overlying water at 800–2000 m (206Pb /207Pb = 1.1845 ± 0.0014). Water mass analysis indicates very little NEADW was present in the Iceland Basin, and the deeper samples were strongly influenced by Iceland–Scotland Overflow Wa-ter (ISOW), particularly at Stations 32–36 (García-Ibáñez et al., 2017). The 1993 IOC-2 survey by Veron et al. (1999) found that ISOW (206Pb /207Pb = 1.173–1.176) was isotopi-cally distinct from LSW (206Pb /207Pb = 1.190–1.20) and
that ISOW reflected atmospheric emissions from Europe at that time. The differences in Pb isotopes (and 2- to 3-fold reduction in concentrations) between sampling campaigns highlight the young age of ISOW, which reflected large source changes over a 21-year time period (Figs. 5 and 6).
In addition, we note that the present-day Norwegian Sea waters must have low [Pb], and that their Pb isotope ratios reflect a greater contribution from European sources than North American sources. ISOW is formed as a mixture of
Figure 7. Triple isotope plot of (a) the surface GEOVIDE samples compared to possible sources, (b) all GEOVIDE data and (c) spa-tiotemporal trends from 1999 (EN328) and 2014∗ (dark grey cir-cles, GEOVIDE samples at all depths from Stations 11 to 26 and depths > 800 m from Stations 29 to 77) and 2014∗∗(light grey cir-cles, GEOVIDE samples at depths < 800 m from Stations 29 to 77). References: pre-Holocene sediments (Hamelin et al., 1990); corals (Kelly et al., 2009); North African dust (Bridgestock et al., 2016); US and EU aerosols, 1990s (Bollhöfer and Rosman, 2001); US aerosols, 2011 (Noble et al., 2015); 1981 seawater (Weiss et al., 2003); EN328 and GEOVIDE seawater (this work).
LSW and Norwegian Sea water that overflows the Iceland– Scotland sills. Because LSW has higher [Pb] and higher
206Pb /207Pb isotope ratios than ISOW, we hypothesize that
Norwegian Sea water must have a lower 206Pb /207Pb iso-tope ratio and much lower [Pb] because Pb is scavenged only on a decadal–century scale in deep water and retains it source signatures during decadal penetration into the deep ocean. By this, we mean that in the open ocean with relatively low particulate concentrations and minimal sediment interactions we expect Pb to behave in a quasi-conservative manner over short mixing timescales. Although other work has demon-strated that isotopic exchange with particles can influence the dissolved Pb isotope composition (Wu et al., 2010; Chen et al., 2016), this occurs over much longer timescales than the mixing of Norwegian Sea water and LSW to form ISOW. Using our Pb data for Station 32 and the eOMP analysis that the deepest samples are 100 % ISOW and ∼ 20 % LSW (García-Ibáñez et al., 2017), we back-calculate a Norwegian Sea water that is ∼ 7 pmol kg−1and206Pb /207Pb ∼ 1.180. The relatively lower206Pb /207Pb isotope ratios of the Nor-wegian Sea are consistent with what Veron et al. (1999) ob-served in 1993 (1.169), and are indicative of atmospheric Pb
from a more European provenance than a North American one (Fig. 7).
3.5 Irminger Sea (S40–S60)
In the Irminger Sea, a broad Pb maximum with little con-centration variability was observed between the near surface and 1800 m (Fig. 3). The diffuse elevation in [Pb] through-out the upper 1800 m is attributed to both Irminger Subpolar Mode Water (0–1000 m) and LSW (500–2500 m) (García-Ibáñez et al., 2017). As in the Iceland Basin, ISOW is ob-served in the Irminger Sea deep water, but in a lower propor-tion (40 %–60 %) than in the Iceland Basin (80 %–100 %). At Stations 42 and 44 ISOW is distinguished by its low [Pb] (5–8 pmol kg−1) and a low206Pb /207Pb ratio (1.1798). Fur-ther north in the Irminger Sea along the Greenland conti-nental slope, the near-bottom samples at Stations 49 and 60 are Denmark Straight Overflow Water (DSOW). The DSOW has a slightly higher [Pb] (10–18 pmol kg−1) and a higher
206Pb /207Pb ratio (1.1854) than ISOW, consistent with the
1993 data of Veron et al. (1999; 206Pb /207Pb = 1.179– 1.182). DSOW is a mix of the Nordic Sea waters overflowing the Greenland–Iceland sill and mixing with LSW; DSOW is also reported to have inputs from dense Greenland shelf wa-ter and cascading Polar Inwa-termediate Wawa-ter (García-Ibáñez et al., 2015; this study). The resulting DSOW isotope composi-tion is very similar to LSW, which could indicate shelf water has very little Pb, and so its signal is dominated by the LSW signal, although we cannot rule out the possibility that the shelf water entrained Pb with a similar isotope composition to LSW.
The Irminger Sea was previously sampled for Pb dur-ing the 1993 IOC-2 expedition (Veron et al., 1999) and the 2010 GA02 expedition near GEOVIDE Stations 42 and 44 (analyses by Middag and Bruland as reported by The GEO-TRACES Group, 2015) (Fig. 5). There is a large decrease in [Pb] at all depths from 1993 to 2010, and a surprisingly large decrease between 2010 and 2014. We suspect that the difference between 2010 and 2014 could also be a result of the 2012 deep winter convection event (∼ 1200 m) as re-ported by Fröb et al. (2016). The 206Pb /207Pb values be-tween 1993 and 2014 do not appear to have changed signifi-cantly (perhaps in view of limited 1993 water column cover-age) (Fig. 6).
3.6 Labrador Sea (S64–S77)
In the Labrador Sea, the [Pb] maximum coincides with LSW (0–2500 m) and is very broad (Fig. 3). Similar concen-trations (∼ 25 pmol kg−1) are found from 100 m to nearly 2000 m. At depths greater than 2000 m, the [Pb] decreases to ∼ 8 pmol kg−1 and water mass analysis indicates this is primarily ISOW. Throughout the entire Labrador Sea wa-ter column Pb isotope ratios are homogenous, in contrast to the Icelandic and Irminger basins, which are isotopically
Figure 8. North–south [Pb] sections in the eastern Atlantic Ocean, 1989–2014. Plot created in Ocean Data View (Schlitzer, 2017).
distinctive from overlying LSW. The similarity of the Pb throughout the Labrador Sea can be attributed to deep win-ter convection that annually varies from 1000 to 2000 m deep (Lazier et al., 2002; Lilly et al., 1999; Vage et al., 2009). Hydrographic observations and Argo floats indicate winter 2014 convection was ∼ 1700 m deep (Kieke and Yashayaev, 2015). Fine (2011) assigns a combined age of 17– 19 years to these waters. The similar Pb profiles throughout the entire water column indicate there were minimal changes in magnitude of Pb sources to the LSW over the 2 decades preceding sampling, and the isotopically indistinguishable ISOW suggests it is also relatively well mixed with LSW in this basin (Figs. 4 and 6).
The Labrador Sea also confirms the continued changes to oceanic Pb since the phase-out of leaded gasoline us-age by North America and Europe. Lead concentrations in the upper 2000 m of the water column were 3 to 4 times lower in 2014 and in 2010 than those measured in 1993 (2010 analyses by Middag and Bruland as reported by the
GEOTRACES Group, 2015; Veron et al., 1999) (Fig. 5). Surface water Pb isotope ratios in 2014 were also much lower (206Pb /207Pb = 1.186) than during the early 1990s (206Pb /207Pb = 1.209) (Fig. 6), in agreement with the rest of the North Atlantic Ocean surface Pb changes.
3.7 Sources of Pb in 1999 and 2014
Overall, Pb isotope ratios throughout the GEOVIDE expe-dition were relatively uniform, in both the upper and deep ocean, and in the eastern and western basins. This find-ing is similar to that of Noble et al. (2015) from the US GEOTRACES expeditions in the mid-Atlantic in 2010 and 2011, but differs from the expeditions of the 1980s and 1990s when Pb isotope ratios ranged much more broadly (206Pb /207Pb = 1.165–1.201) (Veron et al., 1999). Com-pared to the dramatic differences in isotope ratios of 25+ years before, it would appear there is a decoupling of variable Pb concentrations vs. uniform Pb isotopic composition in the North Atlantic. However, examining the Pb isotope ratios
us-Figure 9. North–south Pb isotope sections in the eastern Atlantic Ocean, 1999 and 2010–2014. Plot created in Ocean Data View (Schlitzer, 2017).
ing a triple isotope plot (208Pb /206Pb vs.206Pb /207Pb), it is clear that there have been small spatiotemporal Pb source changes between the 1999 EN328 cruise and regions of the 2014 GEOVIDE cruise that have the most recent atmospheric Pb inputs (Fig. 7c). Most of the 1999 data (except for the old-est deep waters) fall on the lower branch of the European– US mixing trend (yellow squares). The GEOVIDE data from Stations 11 to 26 at all depths and the > 800 m samples from Stations 29 to 77 fall on an intermediate trend, while the < 800 m samples from GEOVIDE Stations 29 to 77 (most recent Pb inputs) fall on the high side of the trend. We do not have enough source isotope information to explain these changes, but they clearly indicate spatiotemporal evolution of the evolving anthropogenic Pb transient in the northern North Atlantic Ocean. This trend is likely not as dramatic as the changes in both concentration and isotope ratios of previ-ous decades because the magnitude of the total atmospheric flux of Pb into the North Atlantic has changed far more than the proportions of Pb emitted between the various sources.
In the industrial sector, emissions by European and Cana-dian/US sources have been relatively constant over the last 15 years. Pb emissions estimates were evaluated using the EMEP (European Monitoring Evaluation Program) database. Atmospheric Pb emissions for European countries along with the USA and Canada were evaluated from 1990 to 2014 (Fig. S3). Cumulative atmospheric Pb emissions have re-duced by a factor of 10 in Europe and by a factor of 5 in North America over that time period. The ratio of Pb emissions from US and Canadian vs. European sources was 1 : 7 in 1990, but that ratio steadily increased to 1 : 3 by 1999 and has remained about the same since then, due to the much larger reductions in emissions by Europe
(follow-ing upon earlier US emission reductions). The similarity of emissions for ∼ 15 years contrasted with the spatiotemporal trend in the isotope ratios could be a result of several phe-nomena. First, despite maintaining similar overall emissions, the sources of atmospheric Pb from each nation could have changed in characteristic but not quantity. Second, the evolu-tion of Pb isotope ratios could be a result of uncounted emis-sions from non-point sources. Finally, natural mineral dust could be playing an influential role in seawater Pb isotope composition.
Atmospheric deposition is the main source of Pb to the ocean, with trace metals in anthropogenic-sourced carbona-ceous aerosols known to be far more seawater soluble than silicate-bound metals in naturally derived aerosols (Des-boeufs et al., 2005). Trace metal enrichment factors of dry aerosols and wet deposition were collected during the GEO-VIDE cruise (Shelley et al., 2017, 2018). Results for Pb en-richment indicated atmospheric Pb was predominantly an-thropogenic in origin (20–120, median 30). Using positive matrix factorization of the aerosol concentration data, Shel-ley et al. (2017, 2018) estimated that ∼ 60 % of the Pb was from a mineral dust source and only 40 % was of anthro-pogenic origin. This finding parallels the 2010 study of Pb in the tropical North Atlantic by Bridgestock et al. (2016) that found 30 %–50 % of total dissolvable Pb in seawater was from natural mineral dust from the North African dust plume. Despite a large fraction of the total atmospheric flux of Pb be-ing natural in origin, the seawater isotope ratios are skewed towards the anthropogenic ratios due to the higher solubi-lization of anthropogenic Pb compared to mineral Pb. In the North Atlantic GEOVIDE, a larger contribution of mineral
dust Pb could be obscured in the dissolved Pb signal because of the differing solubility.
Lead isotope ratios are a useful tool in resolving possi-ble sources because they are not fractionated significantly by scavenging or other natural processes (compared to the large differences due to radiogenic sources). In the open ocean water column there is minimal opportunity for exchange of Pb between particles and water (unlike the sediment–water interface), so we would expect dissolved Pb isotopes to be representative of atmospheric inputs. Triple isotope plots of the waters from this cruise (Fig. 7a, b) compare the possible sources of Pb to the North Atlantic. Pre-Holocene sediments and corals from the North Atlantic (Hamelin et al., 1990; Kelly et al., 2009) are representative of the pre-industrial Pb background ratio we would expect to find in seawater if there were no anthropogenic inputs; unfortunately the Icelandic dust end-member is not known, but we suspect it is similar to North African dust. Because there is significant overlap in historic USA Pb emissions and modern North African dust with these isotope ratios, it is difficult to fully resolve the different sources. The aerosol signatures of anthropogenic sources in the USA and Europe fall along a linear mixing line, while the more natural Pb sources deviate from this line. The spatiotemporal trend (Fig. 7c) supports the hypothesis that an increasing amount of the most recent Pb inputs to the ocean is increasingly natural in origin. However, the seawa-ter Pb isotope ratios will lag in reflecting the atmospheric Pb changes due to the preferential solubility of anthropogenic Pb, so the ocean will never fully reflect natural atmospheric Pb sources until all anthropogenic Pb sources are eliminated. 3.8 Evolution of Pb and Pb isotopes in the Eastern
Atlantic Water Column, 1989–2014
Data for [Pb] from the 1989 (Atlantis II 123), 1999 (En-deavor328), and 2010–2014 (GA03, and GA01 GEOVIDE) cruises, and Pb isotopes from 1999 and 2010–2014, are plot-ted as north–south sections in Figs. 8 and 9. It is evident that Pb is strongly decreasing in the upper ocean during this period, a fact that can be attributed to the phasing out of tetraethyl Pb gasoline in North America and Europe. All three periods show a Pb maximum in the deep thermocline, and this maximum deepens from decade to decade, as it has also done in the western North Atlantic water column near Bermuda (Boyle et al., 2014; Noble et al., 2015). As Noble et al. (2015) demonstrated for the 2010/2011 GA-03 trans-North Atlantic section, this maximum is located in waters with SF6ventilation dates from the 1970s, when leaded
gaso-line Pb utilization was at its maximum. A similar result can be seen in the 1989 data based on3He–3H dating (Jenkins, 1987). Hence the location of the maximum is dominantly a reflection of Pb emissions at the ventilation age of the wa-ter rather than an association with a particular wawa-ter mass. When considered in this light – as a snapshot of an evolving three-dimensional transient tracer experiment – some of the
Figure 10. CTD data from EN328 Station 10 (42◦N, 17◦450W) showing a strong salinity maximum due to the Mediterranean out-flow eddy.
features in these sections require an interpretation that dif-fers substantially from that usually placed on quasi-steady-state tracers such as salinity, oxygen, and nutrients. For ex-ample, the [Pb] maximum seen at ∼ 25◦N is not the source of a northward-spreading plume, it is the southern extent of high-[Pb] waters that were subducted into the thermocline in the 1970s and advected southwestwards by the dynamics of the ventilated thermocline (Luyten et al., 1983). In addi-tion to the general ventilaaddi-tion of the North Atlantic water col-umn, some [Pb] features are due to specific hydrographic fea-tures. The 1999 [Pb] maximum near 1000 m was enhanced by a strong “meddy”, a coherent mesoscale feature created by pulses of dense salty water from out of the Mediterranean Sea (Armi et al., 1989), as demonstrated by the salinity data from that profile (Fig. 10). It is also evident that the ∼ 1800 m Labrador Sea water has had consistently higher Pb than the denser Greenland–Scotland overflow water.
It is likely that the evident decline in the Pb inventory of the eastern North Atlantic is decreasing not only because of advective–diffusive spreading of the water out of the basin,
but also because of scavenging. Radiochemical studies (Ba-con et al., 1976) have shown that deep water column210Pb activities are lower than226Ra activities, signifying removal of 210Pb from the deep water column. Some of this scav-enging is due to sinking particles, but in near-bottom waters, “boundary scavenging” accounts for a higher fraction (Ba-con, 1988).
The evolution of the Pb isotope data between 1999 and 2010–2014 is striking in that the deepest waters in the tropical eastern Atlantic are significantly changed between these periods. Near the surface, recent changes are mainly due to a greater reduction of the relative North Ameri-can high206Pb /207Pb sources relative to the European low
206Pb /207Pb sources, and possibly some influence of natural
dust. But in the deep water, this change probably represents the “conveyor belt” motion of deep high 206Pb /207Pb in-troduced from the surface in the early 1900s being replaced by lower206Pb /207Pb from the 1920s and later (as seen in historical Pb isotope ratios in Bermuda corals – Kelly et al., 2009).
4 Conclusions
In the past 30 years, massive reductions in Pb emissions to the environment have been evidenced by sampling cam-paigns in the North Atlantic Ocean. Evolution of [Pb] and Pb isotope ratios will continue as human-derived emissions continually decline, Pb is naturally scavenged from the wa-ter column, and the oceanic “conveyor belt” continues to mix deep waters. Like Bridgestock et al. (2016) found in the trop-ical Atlantic, we see evidence of a natural Pb source to the northern North Atlantic which was previously obscured in the 1980s and 1990s by enormous anthropogenic inputs, and which is still obscured in magnitude by the relatively greater solubility of anthropogenic-derived atmospheric Pb. Aerosol samples collected concurrently with our seawater samples support our determination that Pb in the surface waters is partially of natural origin (Shelley et al., 2017, 2018), and work by Prospero et al. (2012) introduces the possibility that much of the dust in the Irminger Sea and Iceland Basin is actually from high-latitude sources such as Icelandic dust. Future work to better constrain end-members could validate this hypothesis.
Data availability. All GEOVIDE Pb and Pb isotope data are deposited in the BCO-DMO repository at http://lod.bco-dmo.org/ id/dataset/651880 and http://lod.bco-dmo.org/id/dataset/652127 (Boyle et al., 2016). They are also included in GEOTRACES IDP2017 at https://doi.org/10.1016/j.chemgeo.2018.05.040 (Schlitzer, 2017).
The Supplement related to this article is available online at https://doi.org/10.5194/bg-15-4995-2018-supplement.
Author contributions. CZ analyzed the samples and prepared fig-ures and the first draft of the manuscript. EB helped with Pb iso-tope analysis, revised the manuscript, and acted as correspondence author. RK prepared sample bottles, maintained ICPMS instrumen-tation, and performed Pb analysis on 1989 and 1999 samples. JW analyzed some 1989 samples. MR analyzed Pb isotopes on 1999 samples. RS analyzed trace metals on atmospheric aerosols on the GOEVIDE cruise and offered comments on the discussion. GS was the chief scientist of the GEOVIDE cruise. HP supervised the trace metal sampling on the GEOVIDE cruise. All other co-authors helped in the trace metal sampling during the GEOVIDE cruise.
Competing interests. The authors declare that they have no conflict of interest.
Special issue statement. This article is part of the special is-sue “GEOVIDE, an international GEOTRACES study along the OVIDE section in the North Atlantic and in the Labrador Sea (GA01)”. It is not associated with a conference.
Acknowledgements. The GEOVIDE project was funded by the French National Research Agency (13-BS06-0014, ANR-12-PDOC-0025-01), the French National Center for Scientific Research (CNRS-LEFE-CYBER), the LabexMER (ANR-10-LABX-19), and Ifremer. We also thank the shipboard technical team: Pierre Branellec, Floriane Desprez de Gésincourt, Michel Ha-mon, Catherine Kermabon, Philippe Le Bot, Stéphane Leizour, Olivier Ménage, Fabien Pérault, and Emmanuel de Saint-Léger. GEOVIDE nutrient data were obtained by Manon Le Goff, Emilie Grossteffan, Morgane Gallinari, and Paul Tréguer. We thank Greg Cutter for assistance in setting up the clean GOFlo rosette. We also thank the officers and crews of R/V Atlantis II (1989) and R/V Endeavor (1999) for their efforts on our behalf. Our GEO-VIDE sample analyses were funded by the US National Science Foundation by grant OCE-1357224. We thank Dominik Weiss and two anonymous reviewers for their constructive comments. Edited by: Catherine Jeandel
Reviewed by: Dominik Weiss and two anonymous referees
References
Armi, L., Hebert, D., and Oakey, N.: Two years in the life of a Mediterranean salt lens, J. Phys. Oceanogr., 19, 354–370, 1989. ATSDR (Agency for Toxic Substances and Disease Registry):
Re-port: Toxicological profile for lead, U.S. Department of Health and Human Services, available at: https://www.atsdr.cdc.gov/ toxprofiles/tp13.pdf (last access: 24 November 2017), 2007. Bacon, M. P.: Tracers of chemical scavenging in the ocean:
bound-ary effects and large-scale chemical fractionation, Philos. T. R. Soc. Lond., 325, 147–160, 1988.
Bacon, M. P., Spencer, D. W., and Brewer, P. G.:210Pb /226Ra and
210Po /210Pb disequilibria in seawater and suspended
Baker, J., Peate, D., Waight, T., and Meyzena, C.: Pb iso-topic analysis of standards and samples using a 207Pb–204Pb double spike and thallium to correct for mass bias with a double-focusing MC-ICP-MS, Chem. Geol., 211, 275–303, https://doi.org/10.1016/j.jchemgeo.2004.06.030, 2004.
Bell, J., Betts, J., and Boyle, E. A.: MITESS: a moored in situe trace element serial sampler for deep-sea moorings, Deep-Sea Res. Pt. I, 49, 2103–2118, https://doi.org/10.1016/S0967-0637(02)00126-7, 2002.
Bollhöfer, A. and Rosman, K. J.: Isotopic source signatures for atmospheric lead: The Northern Hemisphere, Geochim. Cos-mochim. Ac., 65, 1727–1740, https://doi.org/10.1016/S0016-7037(00)00630-X, 2001.
Bory, A. J. M., Abouchami, W., Galer, S. J. G., Svensson, A., Chris-tensen, J. N., and Biscaye, P. E.: A Chinese imprint in insolu-ble pollutants recently deposited in central Greenland as indi-cated by lead isotopes, Environ. Sci. Technol., 48, 1451–1457, https://doi.org/10.1021/ew4035655, 2014.
Boyle, E. A., Chapnick, S. D., Shen, G. T., and Bacon, M. P.: Tem-poral Variability of Lead in the Western North Atlantic Ocean, J. Geophys. Res., 91, 8573–8593, 1986.
Boyle, E. A., John, S. Abouchami, W., Adkins, J. F., Echegoyen-Sanz, Y., Ellwood, M., Flegal, R. Fornace, K., Gallon, C., Galer, S., Gault-Ringold, M., Lacan, F., Radic, A., Rehkam-per, M., Rouxel, O., Sohrin, Y., Stirling, C., Thompson, Cl., Vance, D., Xue, Z., and Zhao, Y.: GEOTRACES IC1 (BATS) Contamination-Prone Trace Element Isotopes Cd, Fe, Pb, Zn, (and Mo) Intercalibration, Limnol. Oceanogr. Method., 10, 653– 665, https://doi.org/10.4319/lom.2012.10.653, 2012.
Boyle, E. A., Lee, J.-M., Echegoyen, Y., Noble, A., Moos, S., Car-rasco, G., Zhao, N., Kayser, R., Zhang, J., Gamo, T., Obata, H., and Norisuye, K.: Anthropogenic lead emissions in the ocean – the evolving global experiment, Oceanography, 27, 69–74, 2014. Boyle, E. A., Zurbrick, C., and Kayser, R.: Dissolved lead data collected from the R/V Pourquoi pas (GEOVIDE) in the North Atlantic, Labrador Sea (section GA01) during 2014, Biolog-ical and ChemBiolog-ical Oceanography Data Management Office (BCO-DMO), Dataset version 2016-08-01, available at: http: //lod.bco-dmo.org/id/dataset/651880 (last access: 10 September 2017), 2016.
Bullard, J. E., Baddock, M., Bradwell, T., Crusius, J., Darlington, E., Gaiero, D., Gassoì, S., Gisladottir, G., Hodgkins, R., Mc-Culloch, R., McKenna-Neuman, C., Mockford, T., Stewart, H., and Thorsteinss, T.: High latitude dust in the earth system, Rev. Geophys. 54, 447–485, https://doi.org/10.1002/2016RG000518, 2016.
Bridgestock, L., van der Flierdt, T., Rehkamper, M., Paul, M., Middag, R., Milne, A., Lohan, M. C., Baker, A. R., Chance, R., Khondoker, R., Strekopytov, S., Humphreys-Williams, E., Achterberg, E. P., Rijkenberg, M. J. A., Gerringa, L. J. A., and de Baar, H. J. W.: Return of naturally sourced Pb to Atlantic surface waters, Nat. Commun., 7, 12921, https://doi.org/10.1038/ncomms12921, 2016.
Chen, M., Boyle, E. A., Lee, J.-M., Nurhati, I., Zurbrick, C., Switzer, A. D., and Carrasco, G.: Lead isotope exchange between dissolved and fluvial particulate matter: a laboratory study from the Johor River estuary, Philos. T. R. Soc. Lond., 374, 20160054, https://doi.org/10.1098/rsta.2016.0054, 2016.
Cutter, G. A. and Bruland, E. B.: Rapid and noncontami-nating sampling system for trace elements in global ocean surveys, Limnol. Oceanogr. Method., 10, 425–436, https://doi.org/10.4319/lom.2012.10.425, 2012.
Desboeufs, K. V., Sofikitis, A, Losno, R., Colin, J. L., and Ausset, P.: Dissolution and solubility of trace metals from natural and anthropogenic aerosol particulate matter, Chemosphere, 58, 195– 203, 2005.
EMEP (European Monitoring Evaluation Program) WebDab: Con-vention on Long-range Transboundary Air Pollution, available at: http://Webdab1.umweltbundesamt.at/official_country_trend. html, last access: 24 November 2017.
Fine, R. A.: Observations of CFCs and SF6 as Ocean Tracers, Annu. Rev. Mar. Sci., 3, 173–95, https://doi.org/10.1146/annurev.marine.010908.163933, 2011. Fröb, F., Olsen, A., Vage, K., Moore, G. W. K., Yashayaev, I.,
Jeansson, E., and Rajasakaren, B.: Irminger Sea deep convection injects oxygen and anthropogenic carbon to the ocean interior, Nat. Commun., 7, 13244, https://doi.org/10.1038/ncomms13244, 2016.
García-Ibáñez, M. I., Pardo, P. C., Carracedo, L. I., Mercier, H., Lherminier, P., Ríos, A. F., and Pérez, F. F.: Struc-ture, transports, and transformations of the water masses in the Atlantic Subpolar Gyre, Prog. Oceanogr., 135, 18–36, https://doi.org/10.1016/j.pocean.2015.03.009, 2015.
García-Ibáñez, M. I., Pérez, F. F., Lherminier, P., Zunino, P., Mercier, H., and Tréguer, P.: Water mass distributions and trans-ports for the 2014 GEOVIDE cruise in the North Atlantic, Biogeosciences, 15, 2075–2090, https://doi.org/10.5194/bg-15-2075-2018, 2018.
Hamelin, B., Grousset, F., and Sholkovitz, E. R.: Pb isotopes in surficial pelagic sediments from the North Atlantic, Geochim. Cosmochim. Ac., 54, 37–47, https://doi.org/10.1016/0016-7037(90)90193-O, 1990.
Harris, A. R. and Davidson, C. I.: The role of resuspended soil in lead flows in the California South Coast Air Basin, Environ. Sci. Technol., 39, 7410–7415, https://doi.org/10.1021/es050642s, 2005.
Jenkins, W. J.:3H and3He in the Beta Triangle: observations of gyre ventilation and oxygen utilization rates, J. Phys. Oceanogr., 17, 763–783, 1987.
Jenkins, W. J., Smethie Jr., W. M., Boyle, E. A., and Cut-ter, G. A.: Water mass analysis for the U.S. GEOTRACES (GA03) North Atlantic secions, Deep-Sea Res. Pt. II, 116, 6–20, https://doi.org/10.1016/j.dsr2.2014.11.018, 2015.
Kelly, A. E., Reuer, M. K., Goodkin, N. F., and Boyle, E. A.: Lead concentrations and isotopes in corals and water near Bermuda, 1780–2000, Earth Planet. Sc. Lett., 283, 93–100, https://doi.org/10.1016/j.epsl.2009.03.045, 2009.
Kieke, D. and Yashayaev, I.: Studies of Labrador Sea Water for-mation and variability in the subpolar North Atlantic in the light of international partnership and collaboration, Prog. Oceanogr., 132, 220–232, https://doi.org/10.1016/j.pocean.2014.12.010, 2015.
Lazier, J., Hendry, R., Clarke, A., Yashayaev, I., and Rhines, P.: Convection and restratification in the Labrador Sea, 1990–2000, Dee-Sea Res. Pt. I, 49, 1819–1835, https://doi.org/10.1016/S0967-0637(02)00064-X, 2002.
Lee, J.-M., Boyle, E. A., Echegoyen-Sanz, Y., Fitzsimmons, J. N., Zhang, R., and Kayser, R.: Analysis of trace met-als (Cu, Cd, Pb, and Fe) in seawater using single batch ni-trilotriacetate resin and isotope dilution inductively coupled plasma mass spectrometry, Anal. Chim. Acta, 686, 93–101, https://doi.org/10.1016/j.aca.2010.11.052, 2011.
Lilly, J. M., Rhines, P. B., Visbeck, M., Davis, R., Lazier, J. R. N., Schott, F., and Farmer, D.: Observing deep con-vection in the Labrador Sea during Winter 1994/95, J. Phys. Oceanogr., 29, 2065–2098, https://doi.org/10.1175/1520-0485(1999)029<2065:ODCITL>2.0.CO;2, 1999.
Luyten, J. R., Pedlosky, J., and Stommel, H.: The ventilated ther-mocline, J. Phys. Oceanogr., 13, 292–309, 1983.
Martin, J. H., Fitzwater, S. E., Gordon, R. M., Hunter, C. N., and Tanner, S. J.: Iron, primary production and carbon-nitrogen flux studies during the JGOFS North Atlantic Bloom experiment, Deep-Sea Res. Pt. II, 40, 115–134, https://doi.org/10.1016/0967-0645(93)90009-C, 1993.
Matsumoto, K.: Radiocarbon-based circulation age of the worlds oceans, J. Geophys. Res., 112, C09004, https://doi.org/10.1029/2007JC004095, 2007.
Measures, C. I., Yuan, J., and Resing, J. A.: Determination of iron in seawater by flow injection analysis using in-line preconcen-tration and spectrophotometric detection, Mar. Chem., 50, 3–12, https://doi.org/10.1016/0304-4203(95)00022-J, 1995.
Moos, S. B. and Boyle, E. A.: Trace metal concentrations (Ba, Cd, Cu, Ni, Pb, Zn) and Pb isotopic signatures throughout the 1980s surface Mediterranean Sea and the deep Alboran Sea, Mar. Chem., in preparation, 2018.
Noble, A. E., Echegoyen-Sanz, Y., Boyle, E. A., Ohnemus, D. C., Lam, P. J., Kayser, R., Reuer, M., and Wu, J.: Dynamic variability of dissolved Pb and Pb isotope composition from the U.S. North Atlantic GEOTRACES Transect, Deep-Sea Res. Pt. II, 116, 208– 225, https://doi.org/10.1016/j.dsr2.2014.11.011 2015.
Planquette, H. and Sherrell, R. M.: Sampling for particulate trace el-ement determination using water sampling bottles: methodology and comparison to in situ pumps, Limnol. Oceanogr. Method., 10, 5, 367–388, https://doi.org/10.4319/lom.2012.10.367, 2012. Prospero, J. M., Bullard, J. E., and Hodgkins, R.:
High-latitude dust over the North Atlantic: Inputs from Ice-landic proglacial dust storms, Science, 335, 6072, 1078–1082, https://doi.org/10.1126/science.1217447, 2012.
Reuer, M. K., Boyle, E. A., and Grant, B. C.: Lead isotope analy-sis of marine carbonates and seawater by multiple collector ICP-MS, Chem. Geol., 200, 137–153, https://doi.org/10.1016/S0009-2541(03)00186-4, 2003.
Rosman, K. J. R., Chisholm, W., Boutron, C. F., Cande-lone, J. P., and Patterson, C. C.: Anthropogenic lead iso-topes in Antarctica, Geophys. Res. Lett., 21, 2669–2672, https://doi.org/10.1029/94GL02603, 1994.
Schaule, B. K. and Patterson, C. C.: Perturbations of the natural Pb depth profile in the Sargasso Sea by industrial Pb, in: Trace Elements in Seawater, edited by: Wong, C. S., Boyle, E. A., Bru-land, K., Burton, D., and Goldberg, E. D., New York, Plenum, 487–504, 1983.
Schepanski, K., Tegen, I., and Macke, A.: Saharan dust transport and deposition towards the tropical northern Atlantic, Atmos. Chem. Phys., 9, 1173–1189, https://doi.org/10.5194/acp-9-1173-2009, 2009.
Schlitzer, R.: Ocean Data View, available at: https://odv.awi.de, last access: 24 November 2017. Schlitzer, R. et al.: The GEO-TRACES Intermediate Data Product 2017: Chemical Geology, in press, https://doi.org/10.1016/j.chemgeo.2018.05.040, 2018. Schwikowski, M., Barbante, C., Doering, T., Gaeggeler, H. W.,
Boutron, C., Schotterer, U., Tobler, L., Van de Velde, K., Ferrari, C., Cozzi, G., Rosman, K., and Cescon, P.: Post-17th-Century changes of European lead emissions recorded in high-altitutde alpine snow and ice, Environ. Sci. Technol., 38, 4, 957–964, https://doi.org/10.1021/es034715o, 2004.
Shelley, R. U., Roca-Marti, M., Castrillejo, M., Sanial, V., Masque, P., Landing, W. M., van Beek, P., Planquette, H., and Sarthou, G.: Quantification of trace element atmospheric deposition fluxes to the Atlantic Ocean (> 40◦N; GEOVIDE, GEOTRACES GA01) during spring 2014, Deep-Sea Res. Pt. I, 119, 34–49, https://doi.org/10.1016/j.dsr.2016.11.010, 2017.
Shelley, R. U., Landing, W. M., Ussher, S. J., Planquette, H., and Sarthou, G.: Regional trends in the fractional solubility of Fe and other metals from North Atlantic aerosols (GEOTRACES cruises GA01 and GA03) following a two-stage leach, Biogeosciences, 15, 2271–2288, https://doi.org/10.5194/bg-15-2271-2018, 2018. The GEOTRACES Group: The GEOTRACES Inter-mediate Data Product 2014, Mar. Chem., 177, 1–8, https://doi.org/10.1016/j.marchem.2015.04.005, 2015.
Thirlwall, M. F.: Multicollector ICP-MS analysis of Pb iso-topes using a 207Pb–204Pb double spike demonstrates up to 400 ppm/amu systematic errors in Tl-normalization, Chem. Geol., 284, 255–279, https://doi.org/10.1016/S0009-2541(01)00365-5, 2002.
Vage, K., Pickart, R. S., Thierry, V., Reverdin, G., Lee, C. M., Petrie, B., Agnew, T. A., Wong, A., and Ribergaard, M. H.: Surprising return of deep convection to the subpolar North Atlantic Ocean in winter 2007–2008, Nat. Geosci., 2, 67–72, https://doi.org/10.1038/ngeo382, 2009.
Veron, A. J., Church, T. M., Rivera-Duarte, I., and Flegal, A. R.: Stable lead isotope ratios trace thermohaline circulation in the subarctic North Atlantic, Deep-Sea Res. Pt. II, 46, 919–935, https://doi.org/10.1016/S0967-0645(99)00009-0, 1999. Weiss, D., Boyle, E. A., Wu, J., Chavagnac, V., Michel,
A., and Reuer, M. K.: Spatial and temporal evolution of lead isotope ratios in the North Atlantic Ocean be-tween 1981 and 1989, J. Geophys. Res., 108, C103306, https://doi.org/10.1029/2000JC000762, 2003.
Wu, J. and Boyle, E. A.: Low blank preconcentration technique for the determination of lead, copper and cadmium in small-volume samples by isotope dilution ICPMS, Anal. Chem., 69, 2464– 2470, https://doi.org/10.1021/ac961204u, 1997.
Wu, J., Rember, R., Jin, M., Boyle, E. A., and Flegal, A. R.: Isotopic evidence for the source of lead in the North Pa-cific abyssal water, Geochim. Cosmochim. Ac., 74, 4629–4638, https://doi.org/10.1016/j.gca.2010.05.017, 2010.

![Table 1. 2σ pooled standard deviation of duplicate Pb isotope anal- anal-yses. [Pb] 206 Pb / 207 Pb 208 Pb / 207 Pb 206 Pb / 204 Pb pmol kg − 1 0–20 0.0077 (n = 10) 0.0025 (n = 10) 0.09 (n = 4) 20–40 0.0030 (n = 15) 0.0021 (n = 15) 0.08 (n = 14) 40–60 0.00](https://thumb-eu.123doks.com/thumbv2/123doknet/14751330.580325/5.918.474.832.113.331/table-pooled-standard-deviation-duplicate-isotope-anal-anal.webp)