HAL Id: hal-00301689
https://hal.archives-ouvertes.fr/hal-00301689
Submitted on 10 Aug 2005HAL is a multi-disciplinary open access
archive for the deposit and dissemination of sci-entific research documents, whether they are pub-lished or not. The documents may come from teaching and research institutions in France or abroad, or from public or private research centers.
L’archive ouverte pluridisciplinaire HAL, est destinée au dépôt et à la diffusion de documents scientifiques de niveau recherche, publiés ou non, émanant des établissements d’enseignement et de recherche français ou étrangers, des laboratoires publics ou privés.
Impact of mixing and chemical change on ozone-tracer
relations in the polar vortex
R. Müller, S. Tilmes, P. Konopka, J.-U. Grooß, H.-J. Jost
To cite this version:
R. Müller, S. Tilmes, P. Konopka, J.-U. Grooß, H.-J. Jost. Impact of mixing and chemical change on ozone-tracer relations in the polar vortex. Atmospheric Chemistry and Physics Discussions, European Geosciences Union, 2005, 5 (4), pp.5841-5874. �hal-00301689�
ACPD
5, 5841–5874, 2005
Ozone/tracer relations in the polar
vortex R. M ¨uller et al. Title Page Abstract Introduction Conclusions References Tables Figures J I J I Back Close Full Screen / Esc
Print Version Interactive Discussion
EGU Atmos. Chem. Phys. Discuss., 5, 5841–5874, 2005
www.atmos-chem-phys.org/acpd/5/5841/ SRef-ID: 1680-7375/acpd/2005-5-5841 European Geosciences Union
Atmospheric Chemistry and Physics Discussions
Impact of mixing and chemical change on
ozone-tracer relations in the polar vortex
R. M ¨uller1, S. Tilmes1,*, P. Konopka1, J.-U. Grooß1, and H.-J. Jost2
1
ICG I, Forschungszentrum J ¨ulich, 52425 J ¨ulich, Germany
2
Bay Area Envrionmental Research Institute, Sonoma, CA, USA
*
now at: ACD, NCAR, Boulder, CO, USA
Received: 8 June 2005 – Accepted: 6 July 2005 – Published: 10 August 2005 Correspondence to: R. M ¨uller (ro.mueller@fz-juelich.de)
ACPD
5, 5841–5874, 2005
Ozone/tracer relations in the polar
vortex R. M ¨uller et al. Title Page Abstract Introduction Conclusions References Tables Figures J I J I Back Close Full Screen / Esc
Print Version Interactive Discussion
EGU
Abstract
Tracer-tracer relations have been used for a long time to separate physico-chemical change from change caused by transport processes. In particular, for more than a decade, ozone-tracer relations have been used to quantify chemical ozone loss in the polar vortex. The application of ozone-tracer relations for quantifying ozone loss relies
5
on two hypotheses; that a compact ozone-tracer relation is established in the ‘early’ polar vortex and that any change of the ozone-tracer relation in the vortex over the course of winter is caused predominantly by chemical ozone loss. Here, we revisit this issue analysing various sets of measurements and the results from several models. We find that mixing across the polar vortex edge impacts ozone-tracer relations in a
10
way that may solely lead to an “underestimation” of chemical ozone loss and not to an overestimation. Further, differential descent in the vortex and internal mixing has only a negligible impact on ozone loss estimates. Moreover, the representation of mixing in three-dimensional atmospheric models can have a substantial impact on the develop-ment of tracer relations in the model. Rather compact ozone-tracer relations develop –
15
in agreement with observations – in the vortex of a Lagrangian model (CLaMS) where mixing is anisotropic and driven by the deformation of the flow. We conclude that, if a reliable ‘early vortex’ reference can be obtained and if vortex measurements are sepa-rated from mid-latitude measurements, ozone-tracer relations constitute a reliable tool for the quantitative determination of chemical ozone loss in the polar vortex.
20
1. Introduction
In the stratosphere, compact relations are expected between tracers for which quasi-horizontal mixing along isentropes is fast compared to their local chemical lifetimes (Plumb and Ko,1992). This fact has been exploited in a variety of studies addressing a wide range of stratospheric research issues (e.g.,Roach,1962;Fahey et al.,1990;
25
ACPD
5, 5841–5874, 2005
Ozone/tracer relations in the polar
vortex R. M ¨uller et al. Title Page Abstract Introduction Conclusions References Tables Figures J I J I Back Close Full Screen / Esc
Print Version Interactive Discussion
EGU has been suggested that observed tracer-tracer relations can be used as a tool for the
validation of chemistry climate models (Proffitt et al.,2003;Khosrawi et al.,2004); the results of such models are otherwise difficult to compare with observations.
Moreover, as long as a strong polar vortex exists, compact relations are also ex-pected for the air mass inside the polar vortex. In particular, as (in the absence of
5
halogen catalyzed chemical loss) ozone in the winter polar vortex can be considered long-lived (e.g., Proffitt et al., 1992; Sankey and Shepherd, 2003), compact ozone-tracer relations are expected for the polar vortex (e.g.,Proffitt et al.,1993;M ¨uller et al., 2001;Tilmes et al.,2004).
Therefore, tracer-tracer correlations (TRAC) have been used, for more than a decade
10
now, to quantify chemical ozone loss in the polar vortices. Measurements from aircraft (Proffitt et al., 1990, 1993; Richard et al., 2001; Ross et al., 2004; Ulanovskii et al., 2004), satellites (M ¨uller et al.,1996;Tilmes et al.,2003b,2004), balloons (M ¨uller et al., 2001;Salawitch et al.,2002;Vogel et al.,2003;Robinson et al.,2005), and from the space shuttle (Michelsen et al.,1998) were used for such analyses.
15
The TRAC methodology has been described in detail elsewhere (e.g.,Proffitt et al., 1990; M ¨uller et al., 1996, 2001; Salawitch et al., 2002; Tilmes, 2004; Tilmes et al., 2004); briefly, an ozone-tracer relation that is established in the ‘early’ polar vortex will be unaltered (“frozen in”) throughout the existence of the polar vortex in the absence of mixing and chemical ozone loss. In particular, diabatic descent inside the vortex alone
20
cannot change an ozone-tracer relation.
Considering the change of ozone-tracer relations within the vortex for quantifying chemical ozone loss in the polar vortex hinges on two hypotheses: First, that a compact ozone-tracer relation is established in the ‘early’ polar vortex, i.e., before the onset of chemical ozone loss. Second, that any change of the ozone-tracer relation in the vortex
25
over the course of winter is caused predominantly by chemical ozone loss.
The validity of these hypotheses has been debated and the question was raised whether mixing across the vortex edge changes the ozone-tracer relation in a way that leads to an overestimate or an underestimate of ozone loss (e.g., Michelsen et al.,
ACPD
5, 5841–5874, 2005
Ozone/tracer relations in the polar
vortex R. M ¨uller et al. Title Page Abstract Introduction Conclusions References Tables Figures J I J I Back Close Full Screen / Esc
Print Version Interactive Discussion
EGU 1998;Plumb et al.,2000;M ¨uller et al.,2001;Salawitch et al.,2002;Rex et al.,2002;
Sankey and Shepherd,2003;Tilmes et al.,2003b,2004). Indeed, the impact of mixing on tracer-tracer relationships was neglected in early studies using the TRAC method (e.g., M ¨uller et al., 1996, 1997). However, over the course of winter and spring, the vortex air mass will be influenced to a certain extent by mixing-in of air from outside
5
the vortex. Inside and outside vortex air is characterised by different ozone-tracer relationships, with the outside vortex relationships showing greater ozone mixing ratios (and a stronger variability) for equal values of the tracer than inside relationships (e.g., Proffitt et al.,1990;M ¨uller et al.,1999,2002;Jost et al.,2002;Tilmes et al.,2003b). Therefore, if mixing occurs between air masses inside and outside of the vortex, it will
10
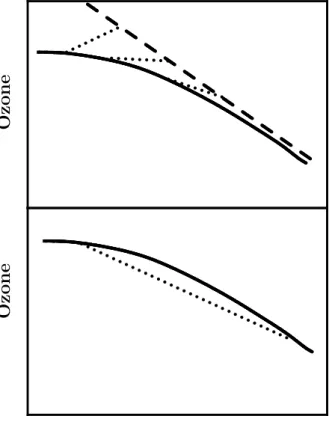
lead to points lying along the dotted mixing lines and thus above the original ozone-tracer relation in the vortex (Fig. 1, top panel). In contrast, mixing between two air masses that correspond to different points on the same non-linear, compact ozone-tracer relation, results in points that fall below the compact relation (Fig. 1, bottom panel).
15
Moreover, differential descent with subsequent mixing within the vortex impacts tracer-tracer relations. Although Ray et al. (2002) and Salawitch et al. (2002) con-clude that the effect of differential descent increased the uncertainty of column ozone loss estimates by not more than ≈3–4% in Arctic winter 1999–2000, this mechanism could potentially have an influence on ozone loss estimates deduced using TRAC.
20
Here, we revisit the question of the validity of the two major hypotheses that TRAC is based on. We consider the question of the compactness of the ozone-tracer rela-tion in the ‘early’ polar vortex. Further, we discuss the impact of mixing across polar vortex edge on ozone loss estimates deduced using TRAC and extend the discussion to the related issue of differential descent within the vortex. Moreover, we examine the
25
representation of ozone-tracer relations in a variety of models. We conclude that, if applied with care, ozone-tracer relations constitute a reliable tool for the quantitative determination of chemical ozone loss in the polar vortex.
ACPD
5, 5841–5874, 2005
Ozone/tracer relations in the polar
vortex R. M ¨uller et al. Title Page Abstract Introduction Conclusions References Tables Figures J I J I Back Close Full Screen / Esc
Print Version Interactive Discussion
EGU
2. Reference ozone-tracer relations in the ‘early’ polar vortex
2.1. Reference relations constructed from mixing lines
Michelsen et al.(1998) analysed ATMOS observations of ozone and N2O in the Arctic in March/April 1993. By considering the O3/N2O relationship they find that, on the same N2O level, much lower (≈50–60%) ozone mixing ratios are observed inside compared
5
to outside of the polar vortex. Michelsen et al.(1998) interpret this difference between the out-of-vortex reference (blue line in Fig.2) and the measurements inside the vortex as a signature of chemical ozone loss, but emphasise that chemical effects are unlikely to account for the entire difference. They also construct an alternative reference for the O3/N2O relation (the yellow line in their plate 4a, also shown in Fig. 2). This reference
10
relation is constructed as a mixing line for a single mixing event (Fig.1, bottom panel) and is derived considering mixing in the N2O/CH4tracer space. However, it is unlikely that mixing of air between the two end-points of a mixing line that are separated by ≈25 km in altitude for an out-of-vortex profile (Michelsen et al.,1998, Plate 3) occurred in reality. Thus, this line should only be seen as an approximation to a reference relation
15
that would develop by continuous mixing.
Comparing this reference with the March/April 1993 vortex observations from AT-MOS, Michelsen et al. (1998) deduce only half of the ozone deficit that they deduce from an out-of-vortex reference. This finding is sometimes erroneously generalised to cases (e.g., M ¨uller et al.,1996; Salawitch et al.,2002;Tilmes et al., 2004) where
20
ozone-tracer relationships in the late vortex are compared with an “early vortex” ref-erence (that is, a refref-erence derived from observations made inside the vortex, at a time before chemical ozone loss occurs) to deduce chemical ozone loss. Out-of-vortex ozone-tracer relations are characterised by greater ozone mixing ratios for a given tracer value than vortex relations (Proffitt et al.,1993;M ¨uller et al.,2001;Tilmes et al.,
25
2004). Therefore, it is incorrect to interpret the finding of Michelsen et al. (1998) as “mixing could produce about half the changes in the O3/N2O relation” (Plumb et al., 2000).
ACPD
5, 5841–5874, 2005
Ozone/tracer relations in the polar
vortex R. M ¨uller et al. Title Page Abstract Introduction Conclusions References Tables Figures J I J I Back Close Full Screen / Esc
Print Version Interactive Discussion
EGU In Fig. 2, we compare the out-of-vortex measurements from ATMOS in April 1993
(blue line), theMichelsen et al.(1998) ‘mixing reference’ (the yellow line in their plate 4a shown here again as a yellow line) and the early vortex reference derived from HALOE early vortex measurements in 1992 (Tilmes et al.,2004, black line). Obviously, the latter reference and the best reference (yellow line) suggested byMichelsen et al.
5
(1998) are in reasonable agreement. Certainly, they are closer to each other than any of them to the out-of-vortex ATMOS measurements. Therefore, ozone loss estimates deduced from these two references will be rather similar. Using the early vortex ref-erence fromTilmes et al.(2004) yields an ozone loss of 117±17 DU for April 1993 in the altitude range 380–550 K (corresponding to 1.4 ppm<CH4<0.5 ppm) whereas
em-10
ploying the ‘mixing line reference’ fromMichelsen et al.(1998), yields an ozone loss of 98 DU, that is, only 16% less ozone loss than obtained from the Tilmes et al.(2004) reference. Nonetheless, long-range (in tracer space) mixing lines can only yield an approximation to the atmospheric conditions. Therefore, if used as reference relations for ozone loss estimates, mixing line references will be associated with a greater
un-15
certainty than an early vortex reference deduced from measurements.
Note that the HALOE measurements between late March and late April 1993 in the polar vortex (Fig. 2) show a compact relation, clearly distinct from any of the refer-ence relations. These HALOE measurements are rather similar to the ATMOS vortex observations in April 1993 (Plumb et al.,2000). The out-of-vortex HALOE
observa-20
tions at 71◦N (blue diamonds in Fig. 2) in April 1993 are comparable to the ATMOS out-of-vortex data.
2.2. The representation of ozone-tracer reference relations in models
While classical two-dimensional models have been used in the past to study tracer-tracer relations (Plumb and Ko, 1992; Proffitt et al., 1992), today three-dimensional
25
models are available for the simulation of transport and chemistry in the stratosphere. A particular advantage of three-dimensional models is that transport barriers in the stratosphere can be better represented than in two-dimensional models. The most
ACPD
5, 5841–5874, 2005
Ozone/tracer relations in the polar
vortex R. M ¨uller et al. Title Page Abstract Introduction Conclusions References Tables Figures J I J I Back Close Full Screen / Esc
Print Version Interactive Discussion
EGU important stratospheric transport barriers, the polar vortex edge and the subtropical
barrier, are essential for the formation of different compact tracer-tracer relations in the stratosphere (e.g.,Michelsen et al.,1998;Plumb,2002;Proffitt et al.,2003).
Nevertheless, even state-of-the-art three-dimensional models will misrepresent transport, and thus tracer-tracer relations, in some way. Depending on the numerical
5
advection scheme employed, transport errors are introduced through numerical di ffu-sion and disperffu-sion (e.g.,Rood,1987;M ¨uller,1992). Dispersion errors that arise par-ticularly strongly in centred difference and in spectral schemes, may lead to spurious scatter in simulations of nonlinear tracer-tracer relationships (Thuburn and McIntyre, 1997).
10
2.2.1. Three-dimensional Eulerian models
Recently, Sankey and Shepherd (2003) presented a thorough investigation of tracer relations in the stratosphere using the Canadian Middle Atmosphere Model (CMAM); they used a number of observed tracer-tracer relations to validate the model results. The model uses a (T32) spectral transport scheme with 50 layers in the vertical and
15
a ≈3 km vertical resolution in the middle atmosphere. The vertical diffusion coefficient Kzzis set to 1 m2s−1. In the model simulations, distinct tracer-tracer relations develop in the tropics, the mid-latitude surf zone, and in the Antarctic winter vortex in accordance with observations (e.g.,Michelsen et al.,1998; Ray et al., 2002;Proffitt et al.,2003) and with the theoretical arguments ofPlumb(2002).
20
However, the model is incapable of producing a strong polar vortex in the Arctic; “there is virtually no barrier at all in the CMAM Arctic vortex” (Sankey and Shepherd, 2003). A transport barrier at the Arctic vortex edge (together with rapid mixing within the vortex) is the reason why compact tracer-tracer relations develop inside the polar vortex that are distinct from the tracer-tracer relations outside the vortex (e.g.,Plumb,2002).
25
The segregation between compact tracer-tracer relationships inside and outside of the vortex has been observed on many occasions (e.g., Proffitt et al., 1993; Michelsen et al.,1998;M ¨uller et al.,1999;Ray et al.,2002;Tilmes et al.,2003b).
ACPD
5, 5841–5874, 2005
Ozone/tracer relations in the polar
vortex R. M ¨uller et al. Title Page Abstract Introduction Conclusions References Tables Figures J I J I Back Close Full Screen / Esc
Print Version Interactive Discussion
EGU The existence of such a segregation and of a transport barrier at the edge of the
Arctic vortex is the central assumption for applying the TRAC method for deducing chemical ozone loss inside the vortex (e.g.,M ¨uller et al.,1996;Tilmes,2004). Thus, the fact that based on CMAM data it would be impossible using the TRAC method to de-duce chemical ozone loss in the Arctic vortex (Sankey and Shepherd,2003), is caused
5
by the lack of a transport barrier at the edge of the Arctic vortex in CMAM. Indeed, in the CMAM Antarctic vortex, for which a transport barrier is produced in the model, a compact ozone-tracer relation develops in the model. In CMAM it takes months for the compact correlation to develop; a truly compact correlation is established in August. A recent analysis of ILAS II measurements in Antarctic winter 2003 indicates that a
10
compact relation had developed by the end of June (Tilmes et al., 2005a1, b2). More-over, the fact that the simulated ozone-tracer relation in the Antarctic vortex in CMAM does not resemble measurements by HALOE, ATMOS, and ILAS II (M ¨uller et al.,1996; Michelsen et al.,1998, Tilmes et al., 2005b2) is most likely due to an underestimate of halogen catalyzed ozone depletion in the CMAM Antarctic vortex.
15
Sankey and Shepherd (2003) raised the question whether, given limited observa-tions at a particular latitude, one could be under the false impression that a compact ozone-tracer relation exists, when in reality this is not the case. To illustrate their point, they consider (their Fig. 19) CMAM data for the O3/CH4 relation inside the polar vor-tex for 1 January. (The vorvor-tex being defined as a column of air with potential vorticity
20
greater than 400 PVU at 10 hPa, D. Sankey, pers. comm.). The CMAM model vortex is then sampled at the actual locations of HALOE measurements in January 1992. Due to the HALOE measurement geometry, these measurement locations intercept
1
Tilmes, S., M ¨uller, R., Grooß, J.-U., Nakajima, H., and Sasano, Y.: Development of tracer relations and chemical ozone loss during the setup phase of the polar vortex, J. Geophys. Res., to be submitted, 2005a.
2
Tilmes, S., M ¨uller, R., Grooß, J.-U., Spang, R., Sugita, T., Nakajima, H., and Sasano, Y.: Chemical ozone loss and related processes in the Antarctic winter 2003 based on ILAS II observations, J. Geophys. Res., submitted, 2005b.
ACPD
5, 5841–5874, 2005
Ozone/tracer relations in the polar
vortex R. M ¨uller et al. Title Page Abstract Introduction Conclusions References Tables Figures J I J I Back Close Full Screen / Esc
Print Version Interactive Discussion
EGU the CMAM vortex only very rarely. The CMAM O3/CH4 values at the HALOE
mea-surement locations form a compact relation for CH4 lower than ≈1.3 ppm; for CH4 greater than ≈1.3 ppm, the CMAM O3 values at the HALOE measurement locations show some scatter, albeit less scatter than all the CMAM vortex model points (Sankey and Shepherd,2003). That is, if the real atmosphere were as simulated by CMAM, and
5
had HALOE observed that model atmosphere during January 1992 the apparent cor-relation would have been the result of insufficient sampling. This thought experiment indicates the possible existence of a problem (Sankey and Shepherd,2003).
To address the question whether such a problem might exist for conditions in the early polar vortex in the Arctic, we consider the actual HALOE measurements in mid
10
January 1992 (Fig. 3) colour-coded according to equivalent latitude. Based on the selection criteria ofTilmes et al.(2004), three HALOE measurements (black symbols in Fig.3) are located in the polar vortex in January 1992. These profiles show a rather compact O3/CH4relation, clearly more compact than the CMAM relation at the location of the HALOE measurements. An exception are the measurements at top altitudes that
15
show characteristics of outside vortex air. The O3/CH4relation for outside vortex, mid-latitude air shows considerable scatter, but always greater ozone values than the vortex air.
Further, measurements of the ILAS instrument (Sasano et al.,1999) which provides a very good coverage of the polar area in winter 1996–1997 demonstrate that a
com-20
pact ozone-tracer relation develops in the Arctic vortex which is clearly separated from the out-of-vortex relation (Tilmes et al.,2003b). The ILAS Arctic vortex measurements show no indication of a variability of the ozone-tracer relation resembling that in the CMAM model vortex. Also, HALOE measurements of the early spring vortex in years when HALOE provides a good coverage of the polar area (e.g., early April 1992, 1995,
25
1996) show compact relations of both HCl and ozone with long-lived tracers (M ¨uller et al.,1996;Tilmes et al.,2004).
In summary, the lack of a compact O3/CH4 relationship in the CMAM3 Arctic
vor-3
ACPD
5, 5841–5874, 2005
Ozone/tracer relations in the polar
vortex R. M ¨uller et al. Title Page Abstract Introduction Conclusions References Tables Figures J I J I Back Close Full Screen / Esc
Print Version Interactive Discussion
EGU tex could be leading to the conclusion that compact correlations in the vortex may be
deluded by insufficient sampling of the vortex air-mass when in reality no compact relation exits (Sankey and Shepherd,2003). However, there is no evidence from mea-surements in the polar regions that such a problem occurs in reality.
2.2.2. Three-dimensional Lagrangian models
5
In the Chemical Lagrangian Model of the Stratosphere (CLaMS), advection and mixing are represented in a way that is very different from the transport schemes employed in Eulerian models. The mixing intensity in CLaMS can be controlled and is anisotropic in space and time (McKenna et al.,2002b;Konopka et al.,2004,2005c). Owing to these features, transport barriers can be represented particularly well in CLaMS.
10
For Arctic winter 2002/2003, Konopka et al. (2005b)4 calculated the development over the course of the winter of passive ozone (Opass3 ) and CH4, both treated as pure transport quantities. The probability distribution function (PDF) for Opass3 and CH4 on 11 January 2003 shows that a clear separation between mid-latitude and vortex air masses develops in the model (Fig.4); shown are all CLaMS model points poleward of
15
an equivalent latitude of 40◦N between the 350 K and 700 K isentropes.
These CLaMS results suggest that in early January a transport barrier has formed in the model at the edge of the polar vortex leading to a separation between inside and outside tracer relations. Further, by that time, mixing within the vortex has ho-mogenised the vortex air mass resulting in a compact ozone-tracer relation in the
20
CMAM model results are compared in detail with measurements. The aim of this discussion is not to point to any particular weakness of the CMAM model; ratherSankey and Shepherd
(2003) should be commended for conducting such a rather detailed comparison of results from a general circulation model with measurements.
4
Konopka, P., Grooß, J.-U., R.M ¨uller, G ¨unther, G., Riese, M., von Clarmann, T., Glatthor, N., Kellmann, S., Stiller, G., Funke, B., and L ´opez-Puertas, M.: Halogen-versus NOx-induced ozone loss in the Arctic middle stratosphere during the 2002–2003 winter and spring, Atmos. Chem. Phys. Discuss., to be submitted, 2005b.
ACPD
5, 5841–5874, 2005
Ozone/tracer relations in the polar
vortex R. M ¨uller et al. Title Page Abstract Introduction Conclusions References Tables Figures J I J I Back Close Full Screen / Esc
Print Version Interactive Discussion
EGU vortex.
3. The impact of mixing on ozone-tracer relationships in the polar vortex
3.1. Impact of differential descent on tracer relations
Differential descent of air-masses within an otherwise isolated polar vortex may impact non-linear tracer-tracer relations for the vortex (Ray et al.,2002;Salawitch et al.,2002).
5
Potentially, this mechanism could have an influence on ozone loss estimates deduced using TRAC.
Here, we conduct a rather simple calculation to assess the impact of differential descent on ozone-tracer relationships in the polar vortex. We consider idealised con-ditions: the vortex is described by a single column of air; the vertical coordinate being
10
potential temperature θ. In a given timestep∆t the main vortex air mass is descending by∆θ, with a fraction α of the vortex air mass assumed to be descending (unmixed) by δ∆θ with δ>1. The vortex airmass is then assumed to be immediately homogenised by horizontal mixing. This procedure is repeated n times with the intention to approxi-mately describe the development of the vortex over a winter season.
15
For the vortex air mass typical vertical profiles of ozone and N2O are prescribed as initial conditions, resulting in an initial O3/N2O relation in the polar vortex (black solid line in Fig.5). The change of this initial O3/N2O relation due to the action of differential descent and subsequent mixing in the vortex can then be followed. In Fig. 5, this change is shown for a rather extreme case, where∆θ=5 K, α=0.33, δ=2 (that is, one
20
third of the vortex air mass is descending twice as much as the remaining two thirds) and the number of timesteps n=20. Obviously, even for such conditions, the O3/N2O relation is affected rather little by the effect of differential descent.
Ozone-tracer relations were used in the TRAC method for calculating a proxy ozone profile from a tracer profile in late winter, early spring. If the two relations shown in
25
ACPD
5, 5841–5874, 2005
Ozone/tracer relations in the polar
vortex R. M ¨uller et al. Title Page Abstract Introduction Conclusions References Tables Figures J I J I Back Close Full Screen / Esc
Print Version Interactive Discussion
EGU characterised by vertical descent, the column ozone corresponding to these profiles
differs by only ≈2.5 DU. In a scenario that is perhaps a bit more realistic, where ∆θ=2 K, α=0.33, δ=1.5 and the number of timesteps n=50, the corresponding difference in column ozone is less than 1 DU; the maximum change of ozone for a given tracer value due to differential descent and subsequent mixing under these conditions is ≈50 ppb.
5
This means that the contribution of the effect of differential descent to the overall uncertainty in the deduced chemical loss will be small. Given the magnitude of other sources of uncertainty, the contribution from differential descent is very likely to be insignificant. This finding corroborates conclusions ofRay et al.(2002) andSalawitch et al. (2002) who report, based on balloon measurements in winter 1999–2000, that the
10
effect of differential descent increased the uncertainty of column ozone loss estimates by ≈3–4%.
3.2. Impact of cross vortex edge mixing on ozone-tracer relations in the polar vortex
Mixing across the vortex edge is usually non-local in tracer-tracer space and thus has the potential to alter tracer-tracer relations. The ozone-tracer relation shows greater
15
ozone mixing ratios outside of the vortex than inside (e.g.,Proffitt et al.,1993;M ¨uller et al.,2001;Rex et al.,2002;Jost et al.,2002;Tilmes et al.,2004), mixing lines con-necting inside and outside vortex air masses are thus expected to lie between the inside and the outside vortex ozone-tracer relation (Fig.1, top panel).
3.2.1. Observations of mixing across the vortex edge
20
Rex et al.(2002) andJost et al.(2002), based on high altitude aircraft measurements in the Arctic in early 2000, demonstrated that mixing across the vortex edge leads to an increase in the mixing ratio of ozone for a given value of N2O. Moreover, Rex et al. (2002) andRay et al.(2002) emphasise that although in this winter mixing lines were observed, entrainment of extra-vortex air did not significantly alter the composition
25
ACPD
5, 5841–5874, 2005
Ozone/tracer relations in the polar
vortex R. M ¨uller et al. Title Page Abstract Introduction Conclusions References Tables Figures J I J I Back Close Full Screen / Esc
Print Version Interactive Discussion
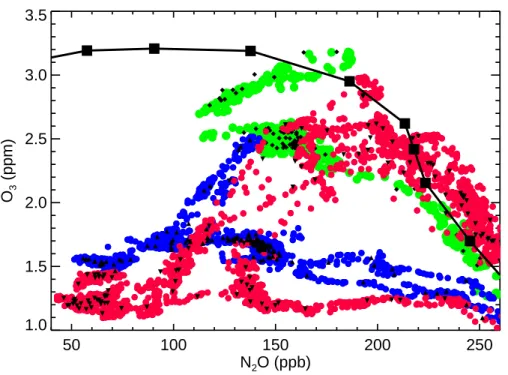
EGU measurements of such mixing lines between vortex air, depleted in ozone, and
outside-vortex air. The outside-vortex air is characterised on 23 January 2000 by ozone mixing ratios up to about 2.5 ppm (green symbols), on 7 March 2000 by ozone mixing ratios up to about 1.7 ppm (blue symbols), and on 11 March 2000 by ozone mixing ratios of about 1.2 ppm. Clearly noticeable are the mixing lines towards air with greater ozone and
5
greater N2O mixing ratios, that is air of mid-latitude characteristics. Clearly, there is no evidence from the measurements of mixing lines on the ‘low ozone’ side of the O3/N2O relations.
Under conditions when the transport barrier at the edge of the vortex is weak, mixing is expected to noticeably influence the ozone-tracer relation inside the vortex.
Accord-10
ing to the arguments above, one expects ozone to increase for a given tracer mixing ratio. This effect was indeed observed by the ILAS instrument in winter 1996–1997 (Tilmes et al.,2003b). In this winter, the vortex was perturbed by a stratospheric warm-ing in early winter and therefore the vortex edge was permeable until late December. ILAS provided a good coverage of the Arctic polar region in winter 1996–1997
cover-15
ing a latitude range between 55◦–77◦N and measuring about fourteen profiles per day. These measurements show (see Fig. 7 inTilmes et al.,2003b) that inside the vortex ozone increased at a given N2O level in December (when the vortex was still relatively weak) and that a compact O3/N2O relation was established by early January (when a strong vortex had formed).
20
Mixing across the vortex edge is likewise important for establishing the ozone tracer relation in the very early, incipient vortex. The air in high latitudes in autumn that the polar vortex forms from, is characterised by low ozone mixing ratios, a remainder of summertime ozone loss. Because the transport barrier of the incipient vortex, while established, is still somewhat permeable, ozone rich, mid-latitude air is being mixed
25
into the vortex. In this way, the ozone-tracer relation in the vortex recovers from sum-mertime ozone loss. This process was first noted byProffitt et al.(1992) and recently analysed in detail based on ILAS II measurements in the high latitudes of both hemi-spheres (Tilmes et al., 2005a1).
ACPD
5, 5841–5874, 2005
Ozone/tracer relations in the polar
vortex R. M ¨uller et al. Title Page Abstract Introduction Conclusions References Tables Figures J I J I Back Close Full Screen / Esc
Print Version Interactive Discussion
EGU 3.2.2. Cross vortex edge mixing in conceptual models
Plumb et al.(2000) presented a conceptual model, a simple advective diffusive model in cylindrical geometry, to describe the impact of mixing on tracer-tracer relations. In their model, the effect of mixing on the relationship of two artificial tracers χ1 and χ2 is simulated that are designed to resemble N2O and NOy. The relation of χ1 and χ2
5
is the same on both sides of a transport barrier that represents the vortex edge in the model. The typical time scale T for the model is the lifetime of the vortex, say four months or ≈107s and the typical horizontal length scale R is from the pole to the subtropical transport barrier, say ≈7·106m. The dimensionless diffusivity in the vortex edge region is chosen to be K=0.05 byPlumb et al.(2000). If this
dimension-10
less diffusivity is converted to a dimensioned diffusivity D, where D=(K · R2)/T , one obtains D≈3·105m2s−1. This value may be compared with effective atmospheric diffu-sivities deduced from aircraft measurements Deff=5·103m2s−1(Waugh et al.,1997) or diffusivities (D=1.1·103m2 s−1) employed in the chemical transport model CLaMS for reproducing observed filamentary tracer structures at the polar vortex edge (Konopka
15
et al.,2003a). That means, the cross vortex edge diffusivity is likely to be substantially greater in thePlumb et al.(2000) conceptual model than in the stratosphere. Therefore, conclusions based on the results of this conceptual model do not carry over directly to stratospheric conditions.
A further caveat for the application of conclusions from this conceptual model on
20
the behaviour of ozone-tracer relations in the stratospheric polar vortex is thatPlumb et al. (2000) assume the same tracer-tracer relation inside and outside the vortex; an assumption that is not valid for the ozone-tracer relation in the polar region (M ¨uller et al.,2001, see also discussion below).
3.2.3. Cross vortex mixing in Lagrangian chemical transport models
25
Konopka et al.(2005a) and Konopka et al. (2005b)4have shown that in the Lagrangian model CLaMS rather little exchange occurs across the polar vortex edge as long as
ACPD
5, 5841–5874, 2005
Ozone/tracer relations in the polar
vortex R. M ¨uller et al. Title Page Abstract Introduction Conclusions References Tables Figures J I J I Back Close Full Screen / Esc
Print Version Interactive Discussion
EGU a stable vortex exists. If exchange occurs, air masses will mix approximately along
isentropic surfaces leading to an increase of ozone mixing ratios with respect to the vortex reference relation (Fig.4). However, the lower the potential temperature level at which the mixing occurs, the lesser is the deviation of the isentropic surfaces from the vortex reference relation in ozone-tracer space (Fig.4). That means, the lower down in
5
the vortex mixing occurs, the smaller the impact of mixing events is on the ozone tracer relation.
4. Discussion
We have discussed here the validity of the two major hypotheses which the use of ozone-tracer relations for deducing chemical ozone loss in the polar vortex is based
10
on, namely that a compact ozone-tracer relation is established in the ‘early’ polar vor-tex before the onset of chemical ozone loss and that any change of the ozone-tracer relation in the vortex over the course of winter is caused predominantly by chemical ozone loss.
Based on both measurements in the polar stratosphere and model results, we argue
15
that a compact ozone-tracer relation develops within the polar vortex. Model results (Sankey and Shepherd,2003) showing no compact ozone-tracer relation in the Arctic vortex and a rather slow development of compactness of the ozone-tracer relation in the Antarctic vortex are likely caused by an insufficient representation of the transport barrier at the vortex edge in the employed model.
20
Recently,Konopka et al.(2005a) analysed the development of ozone-tracer relations in simulations of the Lagrangian model CLaMS (McKenna et al.,2002b), a model in which a strong transport barrier develops at the edge of the polar vortex (e.g.Konopka et al.,2003b,2004;Steinhorst et al.,2005). Compact ozone-tracer relations are found in the CLaMS results between simulated tracer (CH4) and passive ozone mixing
ra-25
tios in the Antarctic vortex for September to November 2002 (Konopka et al.,2005a). Compact correlations are likewise found for the ozone-tracer relation, when ozone is
ACPD
5, 5841–5874, 2005
Ozone/tracer relations in the polar
vortex R. M ¨uller et al. Title Page Abstract Introduction Conclusions References Tables Figures J I J I Back Close Full Screen / Esc
Print Version Interactive Discussion
EGU deduced from POAM satellite measurements interpolated to the CLaMS model grid
points. Similarly, CLaMS model simulations for the mid-winter Arctic vortex (Fig. 4, Konopka et al., 2005b4) show both a clear separation between mid-latitude and vortex air masses and a compact ozone-tracer relation within the vortex.
Indeed, HALOE measurements in the Arctic vortex in January 1992 show a compact
5
ozone-tracer relation (Fig.3). The same is true for ILAS measurements in the Arctic vortex in January 1997 that provide a better coverage of the vortex (Fig.7, see also Tilmes et al.,2003b).
Reference relations for deducing ozone loss that are derived from mixing lines (Michelsen et al., 1998) yield comparable results for the deduced chemical ozone
10
loss than those obtained from using an ‘early vortex’ relation from within the vortex. Nonetheless, we consider an ‘early vortex’ relation as a more reliable reference than one derived from mixing lines.
Inside and outside vortex air is characterised by different ozone-tracer relation-ships, with the outside vortex relationships showing greater ozone mixing ratios (and a
15
stronger variability) for equal values of the tracer than inside relationships (e.g., Prof-fitt et al.,1990;M ¨uller et al.,1999,2002;Tilmes et al.,2003b). Consequently, mixing between air masses inside and outside of the vortex should lead to points lying above the original ozone-tracer relation in the vortex (Fig.1, top panel), as it has been indeed observed in Arctic winter 2000 (Rex et al.,2002;Jost et al.,2002, see also Fig.6).
20
Therefore, mixing across the vortex edge, if it occurs during the period of chemical ozone loss, should lead to an “underestimation” of ozone loss. This finding is in contrast to the conclusions ofPlumb et al.(2000) who state that “estimates of ozone depletion inferred from ozone-tracer relations are likely to be overestimates”. We argue here that this different conclusion is reached by Plumb et al.(2000) because they assume
25
the same tracer-tracer relation inside and outside of the vortex and use a rather high diffusivity at the vortex edge in their conceptual model.
Simulations with the Lagrangian model CLaMS (Konopka et al.,2005a, b4) indicate that if exchange across the transport barrier at the vortex edge occurs, it will lead
ACPD
5, 5841–5874, 2005
Ozone/tracer relations in the polar
vortex R. M ¨uller et al. Title Page Abstract Introduction Conclusions References Tables Figures J I J I Back Close Full Screen / Esc
Print Version Interactive Discussion
EGU to an increase of ozone mixing ratios in the vortex. Further, as air masses will mix
approximately along isentropic surfaces crossing the vortex edge, mixing will have an increasingly smaller impact on the ozone tracer relation in the vortex, the lower down a mixing event occurs (Fig.4). Indeed,Jost et al.(2002) report a case where mixing across the vortex edge occurred at ≈380 K in Arctic winter 2000 in early March that did
5
not change noticeably the O3/N2O relation.
Esler and Waugh(2002) proposed to construct an artificial reference tracer from a linear combination of several long-lived tracers so that a linear relation of a chemically active tracer with the artificial reference tracer would result. In this way, the impact of a mixing event of the type shown in Fig. 1, bottom panel, can be removed from the
10
analysis since linear tracer-tracer relationships are unaffected by such mixing events. However, since inside and outside vortex air is characterised by different ozone-tracer relationships, the construction of an artificial reference tracer as suggested by Esler and Waugh (2002) (for estimating denitrification) could not help to eliminate the impact of mixing between inside and outside vortex air masses on ozone-tracer relations inside
15
the polar vortex.
Differential descent within the vortex with subsequent horizontal mixing results in mixing events of the type shown in Fig. 1, bottom panel. We have shown here that over the life time of the polar vortex this mechanism can have only a minor impact on ozone-tracer relations within the vortex (Fig. 5), corroborating conclusions based on
20
measurements in winter 1999/2000 (Ray et al.,2002;Salawitch et al.,2002).
In any event, if chemical ozone loss in the polar vortex occurs, it will reduce ozone mixing ratios in the vortex and thus it will alter the reference ozone-tracer relation. In winter 1996/97 (Fig. 7), the beginning ozone depletion is clearly noticeable as a moderate deviation of the ozone-tracer relation from the reference relation. In late
25
March, after substantial ozone loss, a very strong deviation from the reference relation is obvious. The ozone-tracer relation in March is “not” compact because of a chemical reason, namely substantially different chemical ozone loss in different parts of the polar vortex (McKenna et al., 2002a; Tilmes et al., 2003b). In early May 1997, compact
ACPD
5, 5841–5874, 2005
Ozone/tracer relations in the polar
vortex R. M ¨uller et al. Title Page Abstract Introduction Conclusions References Tables Figures J I J I Back Close Full Screen / Esc
Print Version Interactive Discussion
EGU ozone-tracer relations were observed again in the remaining vortex consistent with the
view that mixing in the vortex had, by that time, homogenised the vortex air mass again. The chemical ozone loss deduced using the TRAC method has been compared against the results from other methods (Harris et al.,2002;Tilmes et al.,2004). The results deduced with TRAC are in general agreement with those from other methods;
5
however, the very strong ozone loss deduced from SAOZ measurements for January in some winters (e.g.,Goutail et al.,1999) cannot be identified with TRAC.
5. Conclusions
Ozone-tracer relations have been used for more than a decade to quantify chemical ozone loss in the polar vortex. An issue neglected in the early studies is that it is
10
necessary to assess the impact of mixing processes on tracer-tracer relationships in the polar vortex for a reliable quantification of ozone loss. Recently, also the question of the behaviour of ozone-tracer correlations in the results of model simulations has attracted interest.
Analysing various sets of measurements and the results from several models we
15
find here that mixing across the vortex edge can only lead to an “underestimation” of ozone loss and not to an overestimation as it has been suggested. Further, differential descent within the vortex and the subsequent internal mixing has only a negligible impact on ozone loss estimates.
Moreover, the representation of mixing in three-dimensional atmospheric models can
20
have a substantial impact on the development of tracer relation in the model. Of par-ticular importance is a realistic representation of transport barriers (such as the polar vortex edge) in the model. Rather compact ozone-tracer relations develop – in agree-ment with observations – in the vortex of a Lagrangian model (CLaMS) where mixing is anisotropic and driven by the deformation of the flow.
25
Drawing together all pieces of information considered here, the following picture of the development of ozone-tracer relations in the polar vortex develops (Fig.8): In the
ACPD
5, 5841–5874, 2005
Ozone/tracer relations in the polar
vortex R. M ¨uller et al. Title Page Abstract Introduction Conclusions References Tables Figures J I J I Back Close Full Screen / Esc
Print Version Interactive Discussion
EGU incipient vortex the vortex air mass is characterised by low ozone mixing ratios; the
remainders of polar ozone destruction due to NOx driven chemical cycles in summer (e.g.,Farman,1985) and autumn (Kawa et al.,2002, Tilmes et al., 2005a1). Although the vortex air mass is separated to a certain extent from ozone-rich, mid-latitude air, the vortex is not yet completely isolated. Thus, through mixing, ozone values in the vortex
5
increase during this period (Tilmes et al., 2003b, 2005b2). When the vortex is well established, the transport barrier at the vortex edge effectively separates the vortex air from mid-latitude air. Mixing within the vortex air mass is producing a compact ozone-tracer relation in the vortex. This is the point in time when the reference relation for the TRAC method should ideally be derived.
10
In cold winters, a beginning chemical ozone loss becomes first noticeable at greater altitudes (≈500 K), typically in late January/early February in the Arctic (Tilmes et al., 2003b). Towards late winter, with solar illumination strongly increasing, the ozone loss is accelerating. Thus, in early spring, the signal of accumulated ozone loss is very pronounced in the ozone-tracer relation (Fig.8, bottom panel). Under such conditions,
15
mixing across the vortex edge is clearly leading to an underestimate of ozone loss. We conclude that for using ozone-tracer relations to deduce chemical ozone loss, it is crucial that a reliable ‘early vortex’ reference can be obtained and that vortex mea-surements are well separated from mid-latitude meamea-surements. If these conditions are met, ozone-tracer relations constitute a reliable tool for the quantitative determination
20
of chemical ozone loss in the polar vortex.
Acknowledgements. We thank D. Sankey, T. S. Shepherd, and C. Lemmen for fruitful
discus-sions and for helpful comments on the paper. Further, we thank J. W. Elkins for the ACATS data, E. Richard for the ozone photometer data, G. C. Toon for the MkIV data, C. R. Webster for the ALIAS data, and J. M. Russell III and the HALOE team for the HALOE (v19) data. 25
ACPD
5, 5841–5874, 2005
Ozone/tracer relations in the polar
vortex R. M ¨uller et al. Title Page Abstract Introduction Conclusions References Tables Figures J I J I Back Close Full Screen / Esc
Print Version Interactive Discussion
EGU
References
Elkins, J. W., Fahey, D. W., Gilligan, J. M., Dutton, G. S., Baring, T. J., Volk, C. M., Dunn, R. E., Myers, R. C., Montzka, S. A., Wamsley, P. R., Hayden, A. H., Butler, J. H., Thomp-son, T. M., SwanThomp-son, T. H., Dlugokencky, E. J., Novelli, P. C., Hurst, D. F., Lobert, J. M., Ciciora, S. J., McLaughlin, R. J., Thompson, T. L., Winkler, R. H., Fraser, P. J., Steele, L. P., 5
and Lucarelli, M. P.: Airborne gas chromatograph for in situ measurements of long-lived species in the upper troposphere and lower stratosphere, Geophys. Res. Lett., 23(4), 347– 350, doi:10.1029/96GL00244, 1996. 5872
Esler, J. G. and Waugh, D. W.: A method for estimating the extent of denitrification of arctic polar vortex air from tracer-tracer scatter plots, J. Geophys. Res., 107(6), 1–14, 10
doi:10.1029/2001JD001071, 2002. 5857
Fahey, D. W., Kelly, K. K., Kawa, S. R., Tuck, A. F., Loewenstein, M., Chan, K. R., and Heid, L. E.: Observations of denitrification and dehydration in the winter polar stratosphere, Nature, 344, 321–324, 1990. 5842
Farman, J. C.: Ozone photochemistry in the Antarctic stratosphere in summer, Q. J. R. Meteo-15
rol. Soc., 111, 1013–1025, 1985. 5859
Goutail, F., Pommereau, J.-P., Phillips, C., Deniel, C., Sarkssian, A., Lef `evre, F., Kyr ¨o, E., Rummukainen, M., Ericksen, P., Andersen, S. B., Kaastad-Hoiskar, B.-A., Braathen, G., Dorokhov, V., and Khattatov, V. U.: Depletion of Column Ozone in the Arctic during the winter of 1993–94 and 1994–95, J. Atmos. Chem., 32, 1–34, 1999. 5858
20
Harris, N. R., Rex, M., Goutail, F., Knudsen, B. M., Manney, G. L., M ¨uller, R., and von der Ga-then, P.: Comparison of empirically derived ozone loss rates in the Arctic vortex, J. Geophys. Res., 107(D20), doi:10.1029/2001JD000482, 2002. 5858
Jost, H.-J., Loewenstein, M., Greenblatt, J. G., Podolske, J. R., Bui, T. P., Hurst, D. F., Elkins, J. W., Herman, R. L., Webster, C. R., Schauffler, S. M., Atlas, E. L., Newman, P. A., Lait, 25
L., and Wofsy, S. C.: Mixing events revealed by anomalous tracer relationships in the Arctic vortex during winter 1999/2000, J. Geophys. Res., 107, 4795, doi:10.1029/2002JD002380, 2002. 5844,5852,5856,5857
Kawa, S. R., Bevilacqua, R. M., Margitan, J. J., Douglass, A. R., Schoeberl, M. R., Hop-pel, K. W., and Sen, B.: Interaction between dynamics and chemistry of ozone in the 30
setup phase of the Northern Hemisphere polar vortex, J. Geophys. Res., 108, 8310, doi:10.1029/2001JD001527, 2002. 5859
ACPD
5, 5841–5874, 2005
Ozone/tracer relations in the polar
vortex R. M ¨uller et al. Title Page Abstract Introduction Conclusions References Tables Figures J I J I Back Close Full Screen / Esc
Print Version Interactive Discussion
EGU
Khosrawi, F., M ¨uller, R., Proffitt, M., and Nakajima, H.: Monthly averaged ozone and nitrous oxide from the Improved Limb Atmospheric Spectrometer (ILAS) in the Northern and South-ern Hemisphere polar regions, J. Geophys. Res., 109, D10301, doi:10.1029/2003JD004365, 2004. 5843
Konopka, P., Grooß, J.-U., Bausch, S., M ¨uller, R., McKenna, D. S., Morgenstern, O., and 5
Orsolini, Y.: Dynamics and chemistry of vortex remnants in late Arctic spring 1997 and 2000: Simulations with the Chemical Lagrangian Model of the Stratosphere (CLaMS), At-mos. Chem. Phys., 3, 839–849, 2003a,
SRef-ID: 1680-7324/acp/2003-3-839. 5854
Konopka, P., Grooß, J. U., G ¨unther, G., McKenna, D. S., M ¨uller, R., Elkins, J. W., Fahey, D., 10
and Popp, P.: Weak impact of mixing on chlorine deactivation during SOLVE/THESEO2000: Lagrangian modeling (CLaMS) versus ER-2 in situ observations, J. Geophys. Res., 108, 8324, doi:10.1029/2001JD000876, 2003b. 5855
Konopka, P., Steinhorst, M., Grooß, J.-U., G ¨unther, G., M ¨uller, R., Elkins, J. W., Jost, H.-J., Richard, E., Schmidt, U., Toon, G., and McKenna, D. S.: Mixing and Ozone Loss in the 15
1999–2000 Arctic Vortex: Simulations with the 3-dimensional Chemical Lagrangian Model of the Stratosphere (CLaMS), J. Geophys. Res., 109, D02315, doi:10.1029/2003JD003792, 2004. 5850,5855
Konopka, P., Grooß, J.-U., Hoppel, K., Steinhorst, H.-M., and M ¨uller, R.: Mixing and chemical ozone loss during and after the Antarctic polar vortex major warming in September 2002, J. 20
Atmos. Sci., 62(3), 848–859, 2005a. 5854,5855,5856
Konopka, P., G ¨unther, G., McKenna, D. S., M ¨uller, R., Offermann, D., Spang, R., and Riese, M.: How homogeneous and isotropic is stratospheric mixing? Comparison of CRISTA-1 obser-vations with transport studies based on the Chemical Lagrangian Model of the Stratosphere (CLaMS), Q. J. R. Meteorol. Soc., 131(606), 565–579, doi:10.1256/qj.04.47, 2005c. 5850
25
Loewenstein, M., Jost, H., Grose, J., Eilers, J., Lynch, D., Jensen, S., and Marmie, J.: Argus: A new instrument for the measurement of the stratospheric dynamical tracers, N2O and CH4, Spectrochimica Acta Part A-Molecular and Biomolecular Spectroscopy, 58(11), 2329–2345, 2002. 5872
McKenna, D. S., Grooß, J.-U., G ¨unther, G., Konopka, P., M ¨uller, R., Carver, G., and 30
Sasano, Y.: A new Chemical Lagrangian Model of the Stratosphere (CLaMS): Part II Formulation of chemistry-scheme and initialisation, J. Geophys. Res., 107(D15), 4256, doi:10.1029/2000JD000113, 2002a. 5857
ACPD
5, 5841–5874, 2005
Ozone/tracer relations in the polar
vortex R. M ¨uller et al. Title Page Abstract Introduction Conclusions References Tables Figures J I J I Back Close Full Screen / Esc
Print Version Interactive Discussion
EGU
McKenna, D. S., Konopka, P., Grooß, J.-U., G ¨unther, G., M ¨uller, R., Spang, R., Offer-mann, D., and Orsolini, Y.: A new Chemical Lagrangian Model of the Stratosphere (CLaMS): Part I Formulation of advection and mixing, J. Geophys. Res., 107(D16), 4309, doi:10.1029/2000JD000114, 2002b. 5850,5855
Michelsen, H. A., Manney, G. L., Gunson, M. R., and Zander, R.: Correlations of stratospheric 5
abundances of NOy, O3, N2O, and CH4 derived from ATMOS measurements, J. Geophys. Res., 103, 28 347–28 359, 1998. 5843,5845,5846,5847,5848,5856,5868
M ¨uller, R.: The performance of classical versus modern finite-volume advection schemes for atmospheric modelling in a one-dimensional test-bed, Mon. Wea. Rev., 120, 1407–1415, 1992. 5847
10
M ¨uller, R., Crutzen, P. J., Grooß, J.-U., Br ¨uhl, C., Russel III, J. M., and Tuck, A. F.: Chlorine activation and ozone depletion in the Arctic vortex: Observations by the Halogen Occultation Experiment on the Upper Atmosphere Research Satellite, J. Geophys. Res., 101, 12 531– 12 554, 1996. 5843,5844,5845,5848,5849
M ¨uller, R., Grooß, J.-U., McKenna, D. S., Crutzen, P. J., Br ¨uhl, C., Russell, J. M., and Tuck, A. F.: 15
HALOE observations of the vertical structure of chemical ozone depletion in the Arctic vortex during winter and early spring 1996–1997, Geophys. Res. Lett., 24, 2717–2720, 1997. 5844
M ¨uller, R., Grooß, J.-U., McKenna, D. S., Crutzen, P. J., Br ¨uhl, C., Russell, J. M., Gordley, L. L., Burrows, J. P., and Tuck, A. F.: Chemical ozone loss in the Arctic vortex in the winter 1995–1996: HALOE measurements in conjunction with other observations, Ann. Geophys., 20
17, 101–114, 1999,
SRef-ID: 1432-0576/ag/1999-17-101. 5844,5847,5856
M ¨uller, R., Schmidt, U., Engel, A., McKenna, D. S., and Proffitt, M. H.: The O3/N2O relationship from balloon-borne observations as a measure of Arctic ozone loss in 1991–1992, Q. J. R. Meteorol. Soc., 127, 1389–1412, 2001. 5843,5844,5845,5852,5854
25
M ¨uller, R., Tilmes, S., Grooß, J.-U., McKenna, D. S., M ¨uller, M., Schmidt, U., Toon, G. C., Stach-nik, R. A., Margitan, J. J., Elkins, J. W., Arvelius, J., and Russell III, J. M.: Chlorine Activation and Chemical Ozone Loss Deduced from HALOE and Balloon Measurements in the Arctic during the Winter of 1999–2000, J. Geophys. Res., 107, 8302, doi:10.1029/2001JD001423, 2002. 5844,5856
30
Nash, E. R., Newman, P. A., Rosenfield, J. E., and Schoeberl, M. R.: An objective determination of the polar vortex using Ertel’s potential vorticity, J. Geophys. Res., 101, 9471–9478, 1996.
ACPD
5, 5841–5874, 2005
Ozone/tracer relations in the polar
vortex R. M ¨uller et al. Title Page Abstract Introduction Conclusions References Tables Figures J I J I Back Close Full Screen / Esc
Print Version Interactive Discussion
EGU
Plumb, R. A.: Stratospheric transport, J. Meteorol. Soc. Jpn., 80(4B), 793–809, 2002. 5847
Plumb, R. A. and Ko, M. K. W.: Interrelationships between mixing ratios of long-lived strato-spheric constituents, J. Geophys. Res., 97, 10 145–10 156, 1992. 5842,5846
Plumb, R. A., Waugh, D. W., and Chipperfield, M. P.: The effect of mixing on tracer relationships in the polar vortices, J. Geophys. Res., 105, 10 047–10 062, 2000. 5844,5845,5846,5854, 5
5856
Proffitt, M. H. and McLaughlin, R. J.: Fast-response dual-beam UV absorption ozone photome-ter suitable for use on stratospheric balloons, Rev. Sci. Instr., 54, 1719–1728, 1983. 5872
Proffitt, M. H., Margitan, J. J., Kelly, K. K., Loewenstein, M., Podolske, J. R., and Chan, K. R.: Ozone loss in the Arctic polar vortex inferred from high altitude aircraft measurements, Na-10
ture, 347, 31–36, 1990. 5843,5844,5856
Proffitt, M. H., Solomon, S., and Loewenstein, M.: Comparison of 2-D model simulations of ozone and nitrous oxide at high latitudes with stratospheric measurements, J. Geophys. Res., 97, 939–944, 1992. 5843,5846,5853
Proffitt, M. H., Aikin, K., Margitan, J. J., Loewenstein, M., Podolske, J. R., Weaver, A., Chan, 15
K. R., Fast, H., and Elkins, J. W.: Ozone loss inside the northern polar vortex during the 1991–1992 winter, Science, 261, 1150–1154, 1993. 5843,5845,5847,5852
Proffitt, M. H., Aikin, K., Tuck, A. F., Margitan, J. J., Webster, C. R., Toon, G. C., and Elkins, J. W.: Seasonally averaged ozone and nitrous oxide in the northern hemisphere lower stratosphere, J. Geophys. Res., 108, 4110, doi:10.1029/2002JD002657, 2003. 5843,5847
20
Ray, E. A., Moore, F. L., Elkins, J. W., Hurst, D. F., Romashkin, P. A., Dutton, G. S., and Fahey, D. W.: Descent and mixing in the 1999–2000 northern polar vortex inferred from in situ tracer measurements, J. Geophys. Res., 107, 8285, doi:10.1029/2001JD000961, 2002.
5844,5847,5851,5852,5857
Rex, M., Salawitch, R. J., Harris, N. R. P., von der Gathen, P., Schulz, G. O. B. A., Deckelman, 25
H., Chipperfield, M., Sinnhuber, B.-M., Reimer, E., Alfier, R., Bevilacqua, R., Hoppel, K., Fromm, M., Lumpe, J., K ¨ullmann, H., Kleinb ¨ohl, A., von K ¨onig, H. B. M., K ¨unzi, K., Toohey, D., V ¨omel, H., Richard, E., Aiken, K., Jost, H., Greenblatt, J. B., Loewenstein, M., Podolske, J. R., Webster, C. R., Flesch, G. J., Scott, D. C., Herman, R. L., Elkins, J. W., Ray, E. A., Moore, F. L., Hurst, D. F., Romanshkin, P., Toon, G. C., Sen, B., Margitan, J. J., Wennberg, 30
P., Neuber, R., Allart, M., Bojkov, B. R., Claude, H., Davies, J., Davies, W., De Backer, H., Dier, H., Dorokhov, V., Fast, H., Kondo, Y., Kyr ¨o, E., Litynska, Z., Mikkelsen, I. S., Molyneux, M. J., Moran, E., Nagai, T., Nakane, H., Parrondo, C., Ravegnani, F., Viatte, P. S. P., and
ACPD
5, 5841–5874, 2005
Ozone/tracer relations in the polar
vortex R. M ¨uller et al. Title Page Abstract Introduction Conclusions References Tables Figures J I J I Back Close Full Screen / Esc
Print Version Interactive Discussion
EGU
Yushkov, V.: Chemical depletion of Arctic ozone in winter 1999/2000, J. Geophys. Res., 107, 8276, doi:10.1029/2001JD000533, 2002. 5844,5852,5856
Richard, E. C., Aikin, K. C., Andrews, A. E., Daube, B. C., Gerbig, C., Wofsy, S. C., Romashkin, P. A., Hurst, D. F., Ray, E. A., Moore, F. L., Elkins, J. W., Deshler, T., and Toon, G. C.: Severe chemical ozone loss in the Arctic polar vortex during winter 1999–2000 inferred from in-situ 5
airborne measurements, Geophys. Res. Lett., 28(11), 2197–2000, 2001. 5843
Roach, W.: Aircraft observations in the lower sub-arctic stratosphere in winter, Meteorol. Res. Comm. Pap., 1962. 5842
Robinson, A., Millard, G., Danis, F., Guirlet, M., Harris, N., Lee, A., McIntyre, J., Pyle, J., Arvelius, J., Dagnesjo, S., Kirkwood, S., Nilsson, H., Toohey, D., Deshler, T., Goutail, F., 10
Pommerau, J.-P., Elkins, J., Moore, F., Ray, E., Schmidt, U., Engel, A., and M ¨uller, M.: Ozone loss derived from balloon-borne tracer measurements and the SLIMCAT CTM, Atmos. Chem. Phys., 5, 1423–1436, 2005,
SRef-ID: 1680-7324/acp/2005-5-1423. 5843
Rood, R. B.: Numerical advection algorithms and their role in atmospheric transport and chem-15
istry models, Rev. Geophys., 25(1), 71–100, 1987. 5847
Ross, D., Pyle, J., Harris, N., McIntyre, J., Millard, G., Robinson, A., and Busen, R.: Inves-tigation of Arctic ozone depletion sampled over midlatitudes during the Egrett campaign of spring/summer 2000, Atmos. Chem. Phys., 4, 1407–1417, 2004,
SRef-ID: 1680-7324/acp/2004-4-1407. 5843
20
Russell, J. M., Gordley, L. L., Park, J. H., Drayson, S. R., Tuck, A. F., Harries, J. E., Cicerone, R. J., Crutzen, P. J., and Frederick, J. E.: The Halogen Occultation Experiment, J. Geophys. Res., 98, 10 777–10 797, 1993. 5868
Salawitch, R. J., Margitan, J., Sen, B., Toon, G. C., Osterman, G. B., Rex, M., Elkins, J. W., Ray, E. A., Moore, F. L., Hurst, D. F., Romashkin, P. A., Bevilacqua, R. M., Hoppel, K., 25
Richard, E. C., and Bui, T. P.: Chemical loss of ozone during the Arctic winter of 1999– 2000: an analysis based on balloon-borne observations, J. Geophys. Res., 107(D20), 8269, doi:10.1029/2001JD000620, 2002. 5843,5844,5845,5851,5852,5857
Sankey, D. and Shepherd, T. G.: Correlations of long-lived chemical species in a middle atmosphere general circulation model, J. Geophys. Res., 108(D16), 4494, 30
doi:10.1029/2002JD002799, 2003. 5842,5843,5844,5847,5848,5849,5850,5855,5869
Sasano, Y., Suzuki, M., Yokota, T., and Kanzawa, H.: Improved Limb Atmospheric Spectrome-ter (ILAS) for stratospheric ozone layer measurements by solar occultation technique,
Geo-ACPD
5, 5841–5874, 2005
Ozone/tracer relations in the polar
vortex R. M ¨uller et al. Title Page Abstract Introduction Conclusions References Tables Figures J I J I Back Close Full Screen / Esc
Print Version Interactive Discussion
EGU
phys. Res. Lett., 26, 197–200, doi:10.1029/1998GL900276, 1999. 5849
Steinhorst, H.-M., Konopka, P., G ¨unther, G., and M ¨uller, R.: How permeable is the edge of the Arctic vortex – Model studies of the winter 1999–2000, J. Geophys. Res., 110, D06105, doi:10.1029/2004JD005268, 2005. 5855
Thuburn, J. and McIntyre, M.: Numerical advection schemes, cross-isentropic random walks, 5
and correlations between chemical species, J. Geophys. Res., 102(D6), 6775–6797, 1997.
5847
Tilmes, S.: Chemical ozone loss in the Arctic polar stratosphere, Institute for Chemistry and Dynamics of the Geosphere, Schriften des Forschungszentrums J ¨ulich, Reihe Umwelt, 43, Germany, 2004. 5843,5848,5869
10
Tilmes, S., M ¨uller, R., Grooß, J.-U., H ¨opfner, M., Toon, G. C., and Russell, J. M.: Very early chlo-rine activation and ozone loss in the Arctic winter 2002–2003, Geophys. Res. Lett., 30(23), 2201, doi:10.1029/2003GL018079, 2003a. 5870
Tilmes, S., M ¨uller, R., Grooß, J.-U., McKenna, D. S., Russell, J. M., and Sasano, Y.: Calculation of chemical ozone loss in the Arctic winter 1996–1997 using ozone-tracer correlations: Com-15
parison of Improved Limb Atmospheric Spectrometer (ILAS) and Halogen Occultation Exper-iment (HALOE) results, J. Geophys. Res., 108, 4045, doi:10.1029/2002JD002213, 2003b.
5843,5844,5847,5849,5853,5856,5857,5859,5873
Tilmes, S., M ¨uller, R., Grooß, J.-U., and Russell, J. M.: Ozone loss and chlorine activation in the Arctic winters 1991–2003 derived with the tracer-tracer correlations, Atmos. Chem. Phys., 4, 20
2181–2213, 2004,
SRef-ID: 1680-7324/acp/2004-4-2181. 5843,5844,5845,5846,5849,5852,5858,5868
Toon, G. C., Blavier, J.-F., Sen, B., Margitan, J. J., Webster, C. R., May, R. D., Fahey, D., Gao, R., Del Negro, L., Proffitt, M., Elkins, J. W., Romashkin, P. A., Hurst, D. F., Oltmans, S., Atlas, E., Schauffler, S., Flocke, F., Bui, T. P., Stimpfle, R. M., Bonne, G. P., Voss, P. B., and Cohen, 25
R. C.: Comparison of MkIV balloon and ER-2 aircraft measurements of atmospheric trace gases, J. Geophys. Res., 104, 26 779–26 790, 1999. 5872
Ulanovskii, A., Luk’yanov, A., Yushkov, V., Sitnikov, N., Volk, M., Ivanova, E., and Ravegnani, F.: Estimation of the chemical loss of ozone in the Antarctic stratosphere in the 1999 winter-spring season from direct measurements and simulations, Izv. Atmos. Ocean. Phys., 40(6), 30
695–703, 2004. 5843
Vogel, B., M ¨uller, R., Deshler, T., Grooß, J.-U., Karhu, J., McKenna, D. S., M ¨uller, M., Toohey, D., Toon, G. C., and Stroh, F.: Vertical profiles of activated ClO and ozone loss in the Arctic
ACPD
5, 5841–5874, 2005
Ozone/tracer relations in the polar
vortex R. M ¨uller et al. Title Page Abstract Introduction Conclusions References Tables Figures J I J I Back Close Full Screen / Esc
Print Version Interactive Discussion
EGU
vortex in January and March 2000: In situ observations and model simulations, J. Geophys. Res., 108(D22), 8334, doi:10.1029/2002JD002564, 2003. 5843
Volk, C. M., Elkins, J. W., Fahey, D. W., Salawitch, R. J., Dutton, G. S., Gilligan, J. M., Proffitt, M. H., Loewenstein, M., Podolske, J. R., Minschwaner, K., Margitan, J. J., and Chan, K. R.: Quantifying transport between the tropical and mid-latitude lower stratosphere, Science, 272, 5
1763–1768, 1996. 5842
Waugh, D. W., Plumb, R. A., Elkins, J. W., Fahey, D. W., Boering, K. A., Dutton, G. S., Volk, C. M., Keim, E., Gao, R.-S., Daube, B. C., Wofsy, S. C., Loewenstein, M., Podolske, J. R., Chan, K. R., Proffitt, M. H., Kelly, K. K., Newman, P. A., and Lait, L. R.: Mixing of polar vortex air into middle latitudes as revealed by tracer-tracer scatterplots, J. Geophys. Res., 690
102, 13 119–13 134, 1997. 5854
Webster, C. R., May, R. D., Trimble, C. A., Chave, R. G., and Kendall, J.: Aircraft laser infrared absorption spectrometer (ALIAS) for in situ atmospheric measurements of HCl, N2O, CH4, NO2, and HNO3, Appl. Opt., 33, 454–472, 1994. 5872
ACPD
5, 5841–5874, 2005
Ozone/tracer relations in the polar
vortex R. M ¨uller et al. Title Page Abstract Introduction Conclusions References Tables Figures J I J I Back Close Full Screen / Esc
Print Version Interactive Discussion EGU r rrrrrrrrrrrrrrrrrrrrrrrrrrrr rrrrrrrrrrrrrrrrrrrrrrrrrrrrr r r rrrrrrrrrrrrrrrrrrrrrrrrrrr rrrrrrrrrrrrrrrrrrrrrrrrrrrrr r r rrrrrrrrrrrrrrrrrrrrrrrrrrr r rrrrrrrrrrrrrrrrrrrrrrrrrrrr rrrrrrrrrrrrrrrrrrrrrrrrrrrrr r rrrrrrrrrrrrrrrrrrrrrrrrrrrr rrrrrrrrrrrrrrrrrrrrrrrrrrrrr r rrrrrrrrrrrrrrrrrrrrrrrrrrrr rrrrrrrrrrrrrrrrrrrrrrrrrrrrr r r rrrrrrrrrrrrrrrrrrrrrrrrrrr r r r r r r r r r r r r r r r r rr r r r r r r r r r r r r r rr rrrrrrrrr rr rr rr rr r rr rrrr rrr rrrr rrrrrrrrrrrrrrrrrrrrrrrrrrrrrrrrrrrrrrrrrrrrrrrrrrrrrrrrrrrrrrrrrrrrrrrrrrrrrrrrrrrrrrrrrrrrrrrrrrrrrrrrrrrrrrrrrrrrrrrrrrrrrrrrrrrrrrrrrrrrrrrrrrrrrrrrrrrrrrrrrrrrrrrrrrrrrrrrrrrrrrrrrrrrrrrrrrrrrrrrrrrrrrrrrrrrrrrrrrrrrrrrrrrrrrrrrrrrrrrrrrrrrrrrrrrrrrrrrrrrrrrrrrrrrrrrrrrrrrrrrrrrrrrrrrrrrrrrrrrrrrrrrrrrrrrrrrrrrrrrrrrrrrrrrrrrrrrrrrrrrrrrrrrrrrrrrrrrrrrrrrrrrrrrrrrrrrrrrrrrrrrrrrrrrrrrrrrrrrrrrrrrrrrrrrrrrrrrrrrrrrrrrrrrrrrrrrrrrrrrrrrrrrrrrrrrrrrrrrrrrrrrrrrrrrrrrrrrrrrrrrrrrrrrrrrrrrrrrrrrrrrrrrrrrrrrrrrrrrrrrrrrrrrrrrrrrrrrrrrrrrrrrrrrrrrrrrrrrrrrrrrrrrrrrrrrrrrrrrrrrrrrrrrrrrrrrrrrrrrrrrrrrrrrrrrrrrrrrrrrrrrrrrrrrrrrrrrrrrrrrrrrrrrrrrrrrrrrrrrrrrrrrrrrrrrrrrrrrrrrrrrrrrrrrrrrrrrrrrrrrrrrrrrrrrrrrrrrrrrrrrrrrrrrrrrrrrrrrrrrrrrrrrrrrrrrrrrrrrrrrrrrrrrrr rrrr rrrrrrrrrrrrrrrrrrrrrrrrrrrrrrrrrrrrrrrrrrrrrrrrrrrrrrrrrrrrrrrrrrrrrrrrrrrrrrrrrrrrrrrrrrrrrrrrrrrrrrrrrrrrrrrrrrrrrrrrrrrrrrrrrrrrrrrrrrrrrrrrrrrrrrrrrrrrrrrrrrrrrrrrrrrrrrrrrrrrrrrrrrrrrrrrrrrrrrrrrrrrrrrrrrrrrrrrrrrrrrrrrrrrrrrrrrrrrrrrrrrrrrrrrrrrrrrrrrrrrrrrrrrrrrrrrrrrrrrrrrrrrrrrrrrrrrrrrrrrrrrrrrrrrrrrrrrrrrrrrrrrrrrrrrrrrrrrrrrrrrrrrrrrrrrrrrrrrrrrrrrrrrrrrrrrrrrrrrrrrrrrrrrrrrrrrrrrrrrrrrrrrrrrrrrrrrrrrrrrrrrrrrrrrrrrrrrrrrrrrrrrrrrrrrrrrrrrrrrrrrrrrrrrrrrrrrrrrrrrrrrrrrrrrrrrrrrrrrrrrrrrrrrrrrrrrrrrrrrrrrrrrrrrrrrrrrrrrrrrrrrrrrrrrrrrrrrrrrrrrrrrrrrrrrrrrrrrrrrrrrrrrrrrrrrrrrrrrrrrrrrrrrrrrrrrrrrrrrrrrrrrrrrrrrrrrrrrrrrrrrrrrrrrrrrrrrrrrrrrrrrrrrrrrrrrrrrrrrrrrrrrrrrrrrrrrrrrrrrrrrrrrrrrrrrrrrrrrrrrrrrrrrrrrrrrrrrrrrrrrrrrrrrrrrrrrrrrrrrrrrrrrrrrrrrr
Ozone
Ozone
Tracer
Fig. 1. Schematic view of the impact of mixing on high-latitude ozone-tracer relationships. The
solid line indicates a vortex ozone-tracer relation, the dashed line a mid-latitude ozone-tracer relation, the dotted lines show possible mixing lines. Top panel shows the conditions for mixing across the vortex edge on isentropes. Note that there is a substantial difference in tracer mixing ratio between vortex and mid-latitude air masses on the same potential temperature level caused by the descent in the polar vortex. Bottom panel shows the conditions for mixing between two air parcels characterised by the same ozone-tracer relation.
ACPD
5, 5841–5874, 2005
Ozone/tracer relations in the polar
vortex R. M ¨uller et al. Title Page Abstract Introduction Conclusions References Tables Figures J I J I Back Close Full Screen / Esc
Print Version Interactive Discussion
EGU Fig. 2. Reference relations for the ozone-methane relation in the early vortex in winter 1992/93
from HALOE (Russell et al.,1993) and ATMOS (Michelsen et al.,1998). The black line shows the reference relation deduced from HALOE measurements in November 1992 in the early vortex, the dotted lines give the range of uncertainty (Tilmes et al., 2004). The yellow line shows the ‘mixing line’ reference estimated byMichelsen et al.(1998) based on ATMOS mea-surements, the solid blue line shows the out-of-vortex, high latitude (63◦N–69◦N), reference based on ATMOS measurements from 8–16 April 1993 (Michelsen et al.,1998). The ATMOS relations were converted from a N2O/O3 relation to a CH4/O3 relation using the reported AT-MOS CH4/N2O relation (Michelsen et al., 1998). Further shown are HALOE measurements
inside the vortex in late March (purple diamonds), early April (orange diamonds), and late April 1993 (red diamonds). The blue diamonds indicate HALOE measurements in April 1993 in high latitudes outside the vortex.
ACPD
5, 5841–5874, 2005
Ozone/tracer relations in the polar
vortex R. M ¨uller et al. Title Page Abstract Introduction Conclusions References Tables Figures J I J I Back Close Full Screen / Esc
Print Version Interactive Discussion
EGU Fig. 3. The ozone-methane relation in the Northern hemisphere in January 1992. Shown are
HALOE observations for the altitude range 10–100 hPa for the period 10 to 14 January 1992. The observations were made at equivalent latitudes of 25◦–40◦N (purple symbols), 40◦–50◦N (green symbols), 50◦–60◦N (blue symbols), 60◦–65◦N (red symbols). The black diamonds are observations inside the polar vortex according to the potential vorticity criterion ofTilmes
(2004). The grey shaded area shows the range of CMAM model results for the vortex in a simulated January (Sankey and Shepherd,2003). (The vortex is defined for the model results as potential vorticity greater than 400 PVU at 10 hPa).