MITLibraries
Document Services Room 14-0551 77 Massachusetts Avenue Cambridge, MA 02139 Ph: 617.253.5668 Fax: 617.253.1690 Email: [email protected] http://libraries.mit.edu/docsDISCLAIMER OF QUALITY
Due to the condition of the original material, there are unavoidable
flaws in this reproduction. We have made every effort possible to
provide you with the best copy available. If you are dissatisfied with
this product and find it unusable, please contact Document Services as
soon as possible.
Thank you.
Some pages in the original document contain pictures,
graphics, or text that is illegible.
Compositional studies of cartilage matrix
using NMR spectroscopy
by
Leann Marie Lesperance B.S.E. Marquette University (1985) M.S.E.E. Marquette University (1987)
SUBMITTED TO
THE HARVARD - MASSACHUSETTS INSTITUTE OF TECHNOLOGY DIVISION OF HEALTH SCIENCES AND TECHNOLOGY
IN PARTIAL FULFILLMENT OF THE REQUIREMENTS FOR THE DEGREE OF DOCTOR OF PHILOSOPHY
at the
Massachusetts Institute of Technology September 1993
© Leann Marie Lesperance, 1993
The author hereby grants to MIT permission to reproduce and to distribute copies of this thesis document in whole or in part.
Signature of Author
Harvard-Massachusetts Institute of Technology Division of Health Sciences and Technology July 29, 1993 Certified by Martha Gray Thesis Supervisor Certified by Deborah Burstein
K
Thesis Supervisor Accepted b)Accepted b Roger G. Mark
Chairperson, Graduate Committee Ax rq.PLOu,,,3
Compositional studies of cartilage matrix using NMR spectroscopy by
Leann Marie Lesperance
Submitted to the Harvard-Massachusetts Institute of Technology Division of Health Sciences and Technology on July 29, 1993 in partial fulfillment of the requirements for
the degree of Doctor of Philosophy in Medical Engineering
ABSTRACT
Cartilage is a dense connective tissue which functions as a load bearing material in synovial j oats and provides a smooth surface for joint articulation. It is composed of a highly charged solid phase (the extracellular matrix), an electrolyte fluid, and relatively few cells. Many of the structural and functional properties of cartilage are dependent on the two major constituents of the extracellular matrix: glycosaminoglycans and collagen. The goal of this project was to develop NMR spectroscopy techniques to provide nondestructive and noninvasive determinations of 'cartilage structural and functional integrity. As described below, sodium NMR was used to measure sodium content of cartilage from which fixed charge density (FCD) was calculated, giving an estimate of glycosaminoglycan content. Magnetization transfer NMR was used to evaluate collagen content and structure. These techniques were verified and then used to study changes in matrix composition following perturbations which mimic physiologic and pathophysiologic states.
Because glycosaminoglycans (GAGs) have a net charge under physiological conditions, GAG concentration in the tissue is directly related to tissue fixed charge density (FCD). In turn, FCD is a determinant of the concentration of sodium in tissue water. The NMR method of determining GAG concentration involves detection of the NMR signal from sodium nuclei (the magnitude of this signal is directly proportional to the number of sodium ions in the sample). Sodium concentration is calculated from sodium and water content. GAG concentration can then be calculated using Donnan equilibrium theory. We have verified the NMR visibility of sodium in cartilage by comparison of sodium measured by NMR to sodium measured by inductively coupled plasma emission spectroscopy. Using NMR sodium measurements in calf articular cartilage, we have calculated FCD on the order of that measured using other techniques. For calf epiphyseal cartilage, FCD varied with the position of the sample within the tissue, in a manner consistent with tissue GAG content determined using a biochemical assay. Preliminary NMR images of intact ulnar epiphyseal cartilage demonstrated similar variations in sodium content. NMR measurements for cartilage exposed to baths of differing salt composition, pH, or ionic strength demonstrated the ability of this technique to track changes in tissue sodium content. FCD was also observed to decrease when cartilage was depleted of GAGs by exposure to trypsin. These results demonstrate the ability of sodium NMR to nondestructively measure FCD in cartilage and to follow changes in FCD with changes in matrix charge and composition.
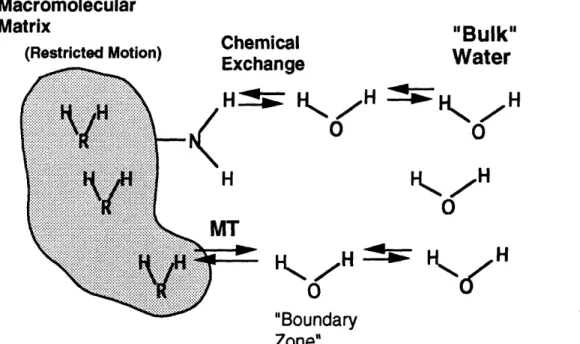
To examine collagen, an NMR experiment known as magnetization transfer (MT) was performed. With a type of MT known as saturation transfer, the protons on macromolecules are perturbed with a radiofrequency pulse until the magnetic moments are randomized. These protons are then given time to exchange magnetization with bulk
water protons, leading to a randomization of the magnetic moments in the water. Observation of the water signal at this point results in less signal relative to the case without MT. The amount of relative signal decrease, expressed as Ms/Mo, provides an indication of the amount of macromolecules present and of the interaction between macromolecular and water protons. MT experimental parameters were characterized for collagen suspensions and cartilage. Based on these results, the saturation pulse length in subsequent experiments was chosen to be at least 5T1 (typically 12 sec for cartilage, 16 sec for collagen model systems), saturation pulse power was 12 kT (set with 1 msec 180 degree pulse), and frequency offset was 6 kHz. Ms/Mo did not change significantly in samples after freezing. Repeated measurements of Ms/Mo on the same sample varied by less than 5% (SD/mean). We have shown that the MT effect is dependent on collagen concentration in collagen suspensions, collagen gels, soluble collagen suspensions, and cartilage, with an approximately logarithmic relationship. However, at concentrations on the order of those seen in vivo, MT is relatively insensitive to changes in concentration. In addition, we have demonstrated that factors other than concentration affect the MT signal in collagen suspensions and cartilage. For example, Ms/Mo was -20% greater for highly crosslinked insoluble collagen suspensions than for soluble suspensions of equal collagen content. Ms/Mo also varied among cartilage from different sources with similar collagen content. We have shown that an intact triple helix is important for MT; loss of the triple helix with thermal denaturation of soluble collagen suspensions resulted in substantially increased Ms/Mo. Furthermore, treatment with enzymes or low pH led to measurable differences in Ms/Mo which were not explained by differences in collagen concentration. They may be attributable to changes in matrix charge, structure and/or collagen fibril hydration (although changes in fibril hydration with trypsin and low pH produced conflicting results). These data demonstrate the ability of MT to detect changes in collagen concentration and collagen structure.
Osteoarthritis is a degenerative disease of cartilage, particularly common among the aging population, which results in diarthrodial joint failure. The ability to fully understand the disease and formulate sensible preventive and therapeutic strategies has been hampered by the inability to assess the in vivo functional status of cartilage. Clinical diagnosis of degenerative diseases like osteoarthritis is typically only possible once the disease has progressed to some advanced state in which gross structural changes have occurred. We have shown that sodium and magnetization transfer NMR can be used to study cartilage matrix composition, specifically the glycosaminoglycan and collagen constituents. In the future, these techniques should be applicable in a clinical setting for early diagnosis and monitoring progression of degenerative diseases.
Thesis Supervisors:
Martha L. Gray, Ph.D.
J.W. Kieckhefer Associate Professor of Electrical and Medical Engineering Department of Electrical Engineering and Computer Science
MIT and Harvard-MIT Division of Health Sciences and Technology Deborah Burstein, Ph.D.
Associate Professor of Radiology Beth Israel Hospital
Members of Thesis Committee
Martha L. Gray (chairperson)
J.W. Kieckhefer Associate Professor of Electrical and Medical Engineering Department of Electrical Engineering and Computer Science, MIT
Harvard-MIT Division of Health Sciences and Technology Deborah Burstein
Associate Professor of Radiology Department of Radiology,
Beth Israel Hospital and Harvard Medical School
Harvard-MIT Division of Health Sciences and Technology Alan J. Grodzinsky
Professor of Electrical, Mechanical, and Bioengineering
Department of Electrical Engineering and Computer Science, MIT Harvard-MIT Division of Health Sciences and Technology
Solomon R. Eisenberg
Associate Professor of Biomedical and Electrical Engineering Department of Biomedical Engineering,
ACKNOWLEDGMENTS
I left these pages until the end because the experimental details seemed more urgent. Yet in the final analysis, nothing is more important. None of this work would have been possible without the support of all the people mentioned below and the others whom I'll forget to thank in my haste to turn this document over to the proper authorities.
First I would like to thank my advisors, Martha and Debbie, for years of support and encouragement. They taught me about NMR and about cartilage, but more importantly they taught me to believe in myself. They have been incredibly enthusiastic about this project and about my role in it. But they have also been positive role models for me, getting engaged, married, having children, and keeping a sense of humor, all while juggling the rigorous demands of academic life. Yet they managed to save more than a few hours to talk with me about work or life or whatever. In addition, I should thank Dickie, Drew, Mark, and Aviva for the hours I kept Martha and Debbie from them. Although my six year tenure as a graduate student at MIT has been filled with ups and downs, the overall experience has been fruitful, educational, and enjoyable, in large part due to Martha and Debbie, and for them I am truly thankful.
I would also like to thank the other members of my committee, Al and Sol, for their assistance with this project. They have been generous with helpful ideas and comments, participated in many long committee meetings, read many drafts of abstracts, papers, and this thesis, and are also positive role models in balancing family and career.
Numerous other individuals contributed to the experiments discussed in this thesis. Lee Gehrke provided the IL-1 for the degradation experiments. Jill Urban and Alice
Maroudas gave us many helpful comments over the years and analyzed some of our samples for comparison of fixed charge density. Lou Gerstenfeld helped set up the hydroxyproline analysis. David Eyre listened to my naive questions about collagen and provided excellent feedback on the magnetization transfer experiments. Many of his suggestions will appear in future theses from this lab! Bill Landis also eagerly listened to a discussion of the MT data and shared his thoughts on collagen. Olena Jacenko and Jim San Antonio spent a few hours giving me their thoughts on collagen, too. Dr. Donald Reilly from the Beth Israel Hospital provided the post-operative pathologic human
My introduction to laboratory life at MIT came from the Continuum Electromechanics Group. Paul Grimshaw and Eliot Frank probably answered more questions during my
years at MIT than anyone; correctly, too! One of the three bikes in my basement is due to an infection with their particular brand of cycle-mania. I don't think I've ridden that bike since my ride to the cape! Minerva Garcia shared the office with me but she also shared her friendship. Young-Jo Kim and Bob Sah gave me a similar mix of advice and
friendship.
Brent Foy taught me much of what I know about NMR and spent many hours teaching me the tricks of the trade. Recently, PV Prasad has helped me learn more about magnetization transfer. Finishing up this thesis would not have been half as fun if I hadn't been going through it with Kathleen Donahue. Whenever either of us said we would "never finish," the other would jump and say "yes, you will!"
Eric Fossel answered many questions and asked a few unanswerable ones himself. Lunches were never long enough when shared with Chris Brosnihan, Nishan Mahendran, Cathy Sanders, and Christine Zanella. I also spent many enjoyable hours with Audrey Hartman, Rob Gipe, and Chitra Raman.
Ann Black and Steve Gladstone gave me technical assistance whenever I needed it. Steve also helped motivate me to finish this thesis with his reverse "you'll never finish" psychology. It was well worth the five dollar bet I lost to him. Administrative tasks were made easier by Linda Bragmann, Jackie Solberg, and Christine Holbrook. They were also more fun because Linda, Jackie and Christine were always willing to share a joke or listen to my latest story.
Everyone in HST has been helpful from day one. The friendliness and cheerfulness all began with Almena Palombo who remembered my name after meeting me once and then continued with Roger Mark, Gloria McAlvenia and her never-empty candy jar, Barbara Jaskela, Keiko Oh, Carol Campbell, Sally Mokalled, and Ron Smith.
I can not thank Patty Cunningham enough for everything! We have talked, listened, laughed and cried. I am so glad to be continuing my education in HST because it means another two years to hang out in Patty's office!
I would like to thank my roommate Jon Come who took the EM photos of collagen, answered my chemistry questions, gave me tons of late night rides home and worried about me a lot. I also thank my other roommates, Scott Jaynes, King Taft, Mike Strange, Alexe Page, and Sandy Gould for meals and conversations shared.
My life has been richer by far because of the friends I have made. Tom Mullen has kept me laughing (and singing) for years. Steve Blacker understands me perhaps better than anyone in this world. Michelle Guyton, Brian Benda, and Tobi Nagel have "been there" for me time and time again. And then there are the friends I have made through the Paulist Center 6pm music group who have given me love and encouragement, especially this last year: Cathy Ford, John and Janet Moreland, Joe Richard and Rene Morrissette, Pat Wilkinson and Annie Foley, Diane and Paul Morruzzi, Julie and Jim Buras Zigo, Maggie McCarthy and Gordon Woode, Jim Haungs and Joe Cambone, Jacqui Paradis and Joe Haungs, David and Carolyn Ward, Bob Siefert and Maureen Shea, and Mark and Jane Widzinski. I have to thank Richard Davis and Viki Vasquez (the thesis police) separately because it would make them too nervous to be included with that big Catholic bunch!
Most of all, I thank my family and my friend Drew, for their love and support. My parents have always encouraged me to follow my dreams. They have been supportive of my academic endeavors even though none of my degrees has yet resulted in gainful employment. My step-parents, Len and Jackie, my sister Kelly and her family, and my grandma Charlotte have been equally encouraging. Drew had the courage to enter into a relationship with me during the last six months of this thesis, which was no easy task. Whenever I called, he always had a smile or cheery word to brighten my day. He also provided technical (Mac) support in addition to the emotional support. I owe him my deepest gratitude.
I would like to express my gratitude for fellowships received from the National Science Foundation, the Fred M. Roddy Foundation, and Clement Vaturi. This project was funded in part by grants from NIH, the JW Kieckhefer Foundation, Procter and Gamble Company, DePuy Company, and the Johnson and Johnson Research Fund.
Table of Contents
List of figures ... 11 List of tables ... 12 Introduction ... 13 Part I Sodium ... 19 Background ... 20 A. Proteoglycans ... 20 B. Proteoglycans in cartilage ... 20C. Techniques for measuring proteoglycan content . ... 22
1. Chem ical determ ination ... 22
2. Nondestructive techniques ... 22
Theory ... 24
A. General NM R theory ... 24
B. Specific NM R experim ents ... 25
1. One pulse ... 25 2. T1 relaxation ... 28 3. T2 relaxation ... 28 4. Im aging ... 29 C. FCD calculation ... 29 M ethods ... 32 A. NM R m ethods ... 32 B. Cartilage preparation ... 34 C. FCD calculations ... 34
Experim ental protocols ... 35
A. Control studies ... 35
1. Calibration ... 35
2. ICP analysis ... 35
3. Sensitivity and precision ... 36
B. Tissue ion concentration and FCD ... 36
C. Changing tissue FCD with com pression ... 36
D. Varying bath com position ... 36
1. Equilibration kinetics ... 37
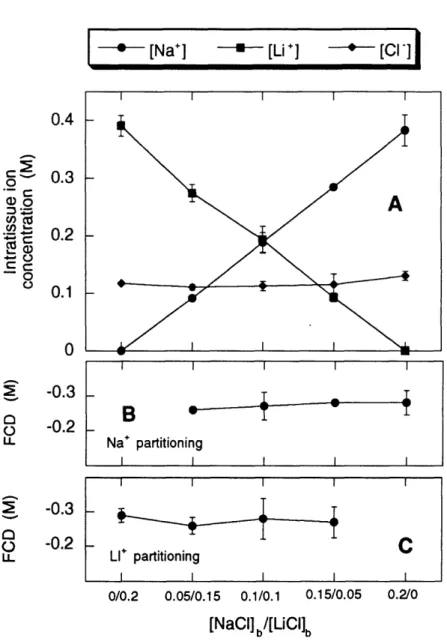
2. Intratissue versus bath [Na+], [Li+], and [C1-] at constant ionic strength ... 37
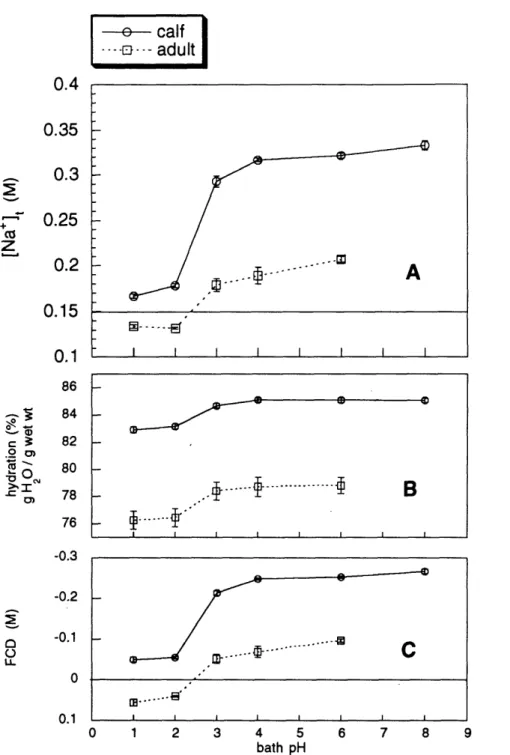
3. Intratissue [Na+] versus bath pH . ... 37
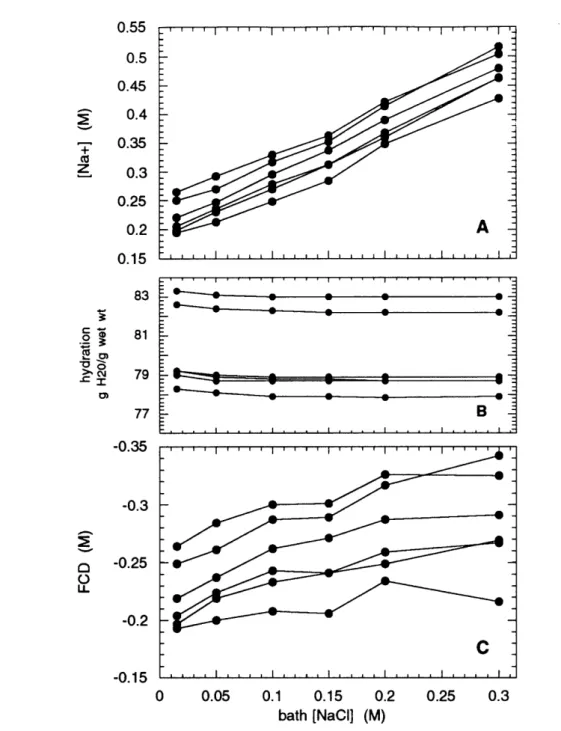
4. Intratissue [Na+] versus bath ionic strength ... 37
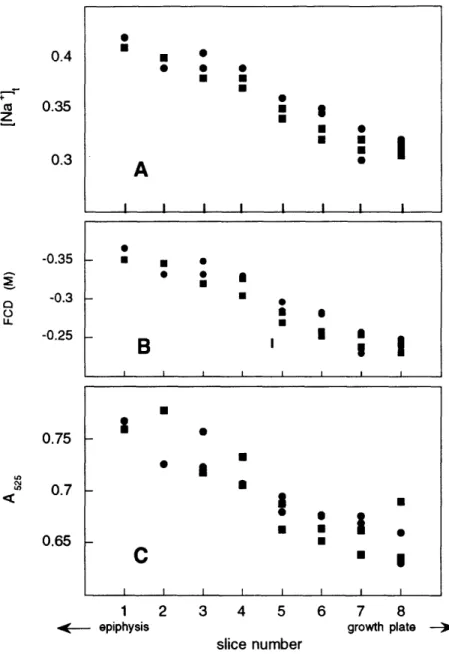
E. Tissue ion concentration versus anatomic position ... 38
F. FCD with loss of proteoglycans ... 38
G. Im aging studies ... 38
Results ... 40
A. Control studies ... 40
1. Calibration ... 40
2. ICP analysis ... 40
3. Sensitivity and precision ... 40
B. Tissue ion concentration and FCD ... 41
C. Changing tissue FCD with com pression ... 41
D. Varying bath com position ... 43
2. Intratissue versus bath [Na+], [Li+], and [Cl-] at constant ionic
strength ... 44
3. Intratissue [Na+] versus bath pH. ... 44
4. Intratissue [Na+] versus bath ionic strength ... 44
E. Tissue ion concentration versus anatomic position ... 44
F. FCD with loss of proteoglycans ... 49
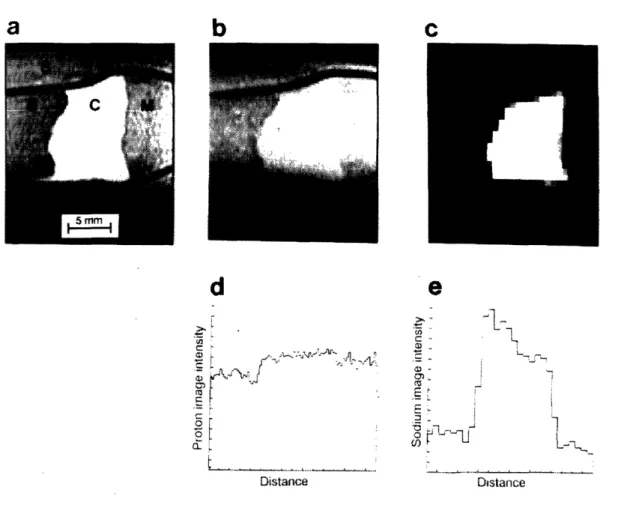
G. Imaging studies ... 50
Discussion ... 53
Part II Magnetization Transfer (MT) ... ... 59
Background ... 60
A. Collagen ... 60
B. Collagen model systems ... 64
C. Collagen in cartilage... 64 D. Perturbations to collagen ... 65 Theory ... 68 M ethods ... 74 A. NMR methods ... 74 B. NMR experiments ... 74 1. One pulse... 74 2. T1 ... 74 3. T2 ... 75 4. MT ... 75
C. Collagen model system preparations... 75
D. Cartilage preparations ... 77
E. Chemical analysis ... 78
Experimental protocols ... 80
A. Characterize experimental parameters ... ... 80
1. Saturation pulse length, power, and frequency offset ... 80
2. Other experimental parameters ... ... 80
B. Dependence of MT on collagen concentration ... 81
1. Model systems... 81
2. Cartilage ... 81
C. Dependence of MT on collagen structure and/or state ... 82
D. MT for detection of cartilage degradation ... 83
1. Mimic tissue pathology ... 83
a. Loss of proteoglycans with trypsin ... 83
b. Cartilage at low pH ... ... 83
c. Enzymatic degradation of collagen ... 84
2. Clinical specimens ... 85
Results ... 1 ... I... 86
A. Characterize experimental parameters ... ... 86
1. Saturation pulse length, power, and frequency offset ... 86
2. Other experimental parameters ... ... 95
B. Dependence of MT on collagen concentration ... 96
1. Model systems... 96
2. Cartilage ... 99
C. Dependence of MT on collagen structure and/or state ... 102
D. MT for detection of cartilage degradation ... ... 107
1. Mimic tissue pathology ... 107
a. Loss of proteoglycans with trypsin ... 107
2. Clinical specimens ... 117
Discussion . . . ... ... 119
A. Specific aims ... 119
1. Characterization of experimental parameters ... 119
2. Dependence of MT on collagen concentration ... 121
3. Dependence of MT on collagen structure and/or state ... 123
4. MT for detection of cartilage degradation ... 130
B. General conclusions and discussion ... 135
C. Summary ... 139
Summary ... 140
List of Figures
1 FID and Fourier Transform ... 27
2 Cartilage water content determined from proton NMR spectra ... 33
3 [Na+], FCD, and total charge before and after compression ...42
4 Equilibration kinetics ... 43
5 Sodium, lithium, and chloride for varying bath composition ... 45
6 Sodium, hydration, and FCD for varying bath pH ... 46
7 Sodium, hydration, and FCD for varying bath ionic strength ... 47
8 FCD as function of position in epiphyseal cartilage ... 48
9 FCD over time with loss of proteoglycans ... 49
10 Histologic sections of cartilage exposed to trypsin ... 50
11 Sodium and proton images of intact epiphyseal cartilage ... 52
12 Diagram of collagen molecule and fibril ... 61
13 Diagram of magnetization transfer process ... 69
14 Frequency spectrum illustrating saturation transfer experiment ... 70
15 Ms/Mo versus saturation pulse length, varying power . ... 87
16 Ms/Mo versus saturation pulse length, varying offset . ... 88
17 Ms/Mo versus saturation power ... 90
18 Ms/Mo versus offset frequency ... 91
19 Ms/Mo versus offset frequency, varying power ... 93
20 Ms/Mo as a function of both positive and negative offset frequency ... 94
21 Ms/Mo measured for varying sample temperature ... 96
22 Ms/Mo versus collagen concentration ... 97
23 Difference in Ms/Mo as a function of offset frequency ... 98
24 Ms/Mo in trypsin digested cartilage under compression ... 99
25 Ms/Mo measured for different types of cartilage ... 101
26 Estimation of collagen content from dry weights ... 102
27 Ms/Mo for soluble versus insoluble collagen suspensions ... 103
28 Ms/Mo as a function of temperature in soluble collagen suspensions ... 105
29 Ms/Mo in suspensions before and after heating ... 106
30 Ms/Mo, wet weight, water content, and FCD in cartilage after trypsin ... 108
31 Ms/Mo and FCD with prolonged exposure to trypsin ... 109
32 Collagen concentration before and after trypsin ... 110
35 Ms/Mo and FCD for cartilage at varying pH in 0.5 M NaCI ... 117
36 Sodium concentration and Ms/Mo for samples exposed to IL- 113... 118
37 Proton spectrum as hypothetical superposition of distinct components ... 121
38 Electron microscopy of acid soluble collagen ... 127
39 Electron microscopy of insoluble collagen... 128
40 Ms/Mo and k versus collagen concentration ... 138
41 Ms/Mo and k for cartilage in varying pH ... 138
List of Tables 1 Parameters utilized for the NMR experiments ... 3... 33
2 Estimation of the error inherent in the FCD calculation ... 54
3 Tlsat measured for varying saturation power... 88
4 Tlsat measured for varying offset frequencies ... 89
5 Tlsat and T1 measured in cartilage ... ... 89
6 Ms/Mo measured in cartilage before and after freezing ... 95
7 Ms/Mo with thermal denaturation of collagen gels ... 104
8 Ms/Mo and T1 measured as a function of temperature ... 105
9 Ms/Mo measured for insoluble collagen suspensions at varying pH ... 114
10 Results of hydroxyproline analysis on collagen and trypsin-digested cartilage ... 124
INTRODUCTION
Cartilage is a dense connective tissue which performs several functions in the human body. For example, epiphyseal cartilage serves as the primordial tissue of long bones while articular cartilage acts as a load bearing material in synovial joints and between vertebral bodies. Cartilage is composed of a highly charged solid phase known as the extracellular matrix (ECM), electrolyte fluid, and relatively few cells (Stockwell and Meachim 1979). The major constituents of cartilage ECM include collagen type II fibrils (50-60% of dry weight), large aggregating proteoglycans, small proteoglycans, and a variety of noncollagenous proteins (Heinegard and Oldberg 1989, Meachim and Stockwell 1979). The collagen and proteoglycan molecules contain sulfate, carboxyl, and amino groups which are ionized under physiologic conditions. With nearly equal numbers of anionic and cationic groups, collagen contributes little to the net matrix charge. In contrast, the glycosaminoglycan (GAG) side chains of the proteoglycans contain up to two anionic groups per disaccharide subunit and thus provide a net negative charge to the matrix. This net matrix charge, referred to as fixed charge density (FCD), in adult articular cartilage has been reported to be on the order of 0.2 moles of negative charge per liter tissue water (Maroudas 1979, Grodzinsky 1983).
Many of the biomechanical and chemical properties of cartilage are dependent on the constituents of the ECM (Grodzinsky 1983, Frank 1990). Proteoglycans provide elasticity and stiffness on compression due to electrostatic repulsion of their abundant negative charges. FCD may be important to cartilage for its cellular activity. The ionic composition of the intratissue fluid surrounding the chondrocytes is determined in part by the FCD in a manner consistent with electroneutrality and Donnan equilibrium. Furthermore, compression-induced changes in mobile ion composition provide one mechanism by which cells may sense and respond to an applied load. Collagen is believed to help immobilize proteoglycans within the tissue and provides tensile and shear strength to the tissue.
Osteoarthritis (OA) is a degenerative disease of cartilage, particularly common among the aging population, in which diarthrodial (movable, synovial-lined) joints fail (Grushko 1989, Brandt and Kovalov 1991). The ability to fully understand the disease and to formulate sensible preventive and therapeutic strategies has been hampered by the
for magnetic resonance imaging, computed tomography, and arthroscopy now make possible the diagnosis of many cartilage lesions and structural abnormalities. However, for degenerative cartilage diseases like OA, diagnosis is typically only possible once the disease has progressed to some advanced state in which gross structural changes have occurred. In fact, for most degenerative diseases there is not a definitive diagnostic test, but rather a list of clinical criteria. The diagnosis of osteoarthritis is made from a combination of clinical, radiologic, and laboratory findings.
Advanced degenerative joint disease is routinely evaluated using weight-bearing radiography of the knee. Joint space narrowing (JSN) generally, but not always, reflects loss of articular cartilage. In a recent study of 161 patients at a sports medicine clinic who complained of chronic knee pain, weight-bearing radiographic evidence of JSN was not a confident predictor of the condition of the articular cartilage as assessed by arthroscopy (Fife 1991). In this study, Fife et al concluded that in patients with radiologically mild OA, serial measurement of joint space width could not confidently be used to assess the efficacy of a therapeutic intervention. Despite the uncertainties, conventional radiography remains the mainstay for examination of patients with arthritis when combined with a physical examination, careful history, and laboratory data (Kaye 1990). The staging or progression of the disease is often followed by comparing recent with previous radiographs; however, small changes are difficult to detect.
Efforts are now being made to use magnetic resonance imaging (MRI) for the diagnosis of degenerative diseases such as osteoarthritis, particularly for the assessment of early degenerative changes. One group of investigators performed in vitro NMR studies on aspirated synovial fluid and minced joint tissues to investigate possible differences in proton relaxation times and mobile proton content between inflamed and noninflamed articular tissue (Baker 1985). They were unable to predict the amount of inflammation present or correlate values obtained for T1, T2, and proton content with a direct diagnosis but suggested that with further refinement, MRI might provide "superb images of articular soft tissue structures."
In the last several years, many studies have been performed on the clinical use of MRI in the evaluation of the knee. MRI has proven useful for characterizing meniscal tears and evaluating the articular surface (Burk 1986, Mink 1988) and for detecting surface lesions (Gylys-Morin 1987) and anterior cruciate ligament tears (Mink 1988).
Using an experimental model of surgically induced OA, one group obtained MR images of dog knees (Sabiston 1987). Meniscal changes, osteophytes, and capsular fibrosis were visualized; changes seen on MR images correlated positively and significantly with changes seen on gross pathological examination. Furthermore, these changes were detected on MR images up to eight weeks earlier than initial radiologic evidence of disease. The authors conclude that MRI offers improved visibility of earlier pathologic changes with OA that traditional radiography. This study, however, did not address the issue of detection of the earliest changes seen with OA, such as collagen structural damage, increased hydration, and proteoglycan loss.
While the etiologic event or agent for primary osteoarthritis has not been clearly defined, one major theory is based on biomechanical failure of the cartilage matrix. Much of the current research in the area of osteoarthritis pathogenesis involves animal models which alter the normal loading pattern of a joint and result in osteoarthritic changes to the cartilage. It has been hypothesized that the inciting event for osteoarthritis is structural damage to the collagen network (due to abnormal joint loading) which reduces its restraining force. The decrease in tensile strength allows increased swelling by the proteoglycans and thus, increased hydration (Maroudas 1973). Proteoglycans are then lost into the surrounding synovial fluid. Ultimately, both proteoglycan and collagen concentrations decrease. The resulting decrease in charge density (due to decreased proteoglycan concentration) further compromises the functional integrity of the tissue, leading to further loss of proteoglycans and eventual matrix degeneration.
Chemical analysis of osteoarthritic cartilage has shown reduction in total proteoglycan content and fixed charge density compared with normal cartilage (e.g. Matthews 1953, Mankin and Lippiello 1971, Venn and Maroudas 1977, Heinegard 1987, Inerot 1991). Additionally, the structure of the remaining proteoglycans has been shown to vary from those found in normal tissue. In a surgically-induced model of hip OA in dogs, proteoglycans in OA tissue were smaller than normal and had lost the ability to aggregate with hyaluronic acid (Inerot 1991). McDevitt and Muir (1976) found that proteoglycans were more easily extracted from osteoarthritic cartilage. Several studies have shown changes in the relative amounts of GAG constituents (chondroitin sulfate, keratan sulfate) in osteoarthritic cartilage compared to normal (Mankin and Lippiello 1971, McDevitt and Muir 1976, Venn and Maroudas 1977, Heinegird 1987). The GAG composition of OA tissue resembles that of immature cartilage. Thus, it has been suggested that the
form, effectively altering its pattern of matrix synthesis to resemble that of immature tissue. A comparison of aged versus osteoarthritic human tissue revealed that the changes which are observed with osteoarthritis are opposite those which occur during the normal aging process; fixed charge density increased in normal, aged samples but decreased in cartilage from osteoarthritic joints (Grushko 1989).
Increased water content has also been observed in osteoarthritic tissue. In one study of experimental dog OA (McDevitt and Muir 1976), water content was 73.0 ± 4.8% for osteoarthritic samples versus 68.0 + 5.0% in the contralateral samples. In studies of the human femoral head, the mean water content for normals was around 70% while that for fibrillated specimens increased to around 80% (Venn and Maroudas 1977, Grushko
1989).
Since it is the charges on the GAGs which account for swelling of the tissue, it might seem that loss of proteoglycans would result in decreased water content, rather than the observed increased water content. However, in osteoarthritic tissue, the swelling forces exerted by the proteoglycans are not adequately restrained by the damaged collagen network. Proteoglycans are therefore free to imbibe greater amounts of water. Eventually, the decreased charge density seen with increased hydration (and loss of proteoglycans) will decrease the tendency to swell. After a large fraction of proteoglycans is lost from the matrix, swelling would be expected to decrease. Therefore, as cartilage degeneration progresses, water content would first increase and then decrease. In fact, severely fibrillated cartilage has been shown to have a decreased water content when compared with cartilage from less severe stages of arthritis (McDevitt and Muir 1976).
Because proteoglycans are depleted and water content is increased in osteoarthritic tissue, one would expect to observe a decrease in the overall net matrix charge when expressed per tissue water. Studies conducted with radiotracers showed a significant reduction in fixed charge density of osteoarthritic tissue compared to normal (Maroudas 1973, Venn and Maroudas 1977, Grushko 1989). Maroudas et al (1973) further observed that the difference in fixed charge density between normal and osteoarthritic tissue was greater when expressed as charge per wet weight than as charge per dry weight.
Venn and Maroudas (1977) measured collagen content in normal and osteoarthritic femoral head cartilage; osteoarthritic samples had less collagen than normal cartilage
when expressed per wet weight. However, no significant difference in the collagen content was observed when normalized to dry weight. This suggests that total collagen as a proportion of total solid material is not decreasing but hydration is increasing. These authors note that one might not expect to see much change in collagen content since it is the predominant solid in cartilage, i.e. a small change may be difficult to detect biochemically.
In summary, the degeneration of cartilage is presumed to begin with alterations to the collagen structure resulting in decreased collagen structural integrity. In addition, osteoarthritic tissue has lower total proteoglycan content than normal tissue. Osteoarthritic tissue also has higher water content than normal, resulting in decreased proteoglycan and collagen concentrations. Therefore, early degenerative changes in cartilage may be detected by determination of collagen structural integrity or measurement of proteoglycan or collagen concentration, well before radiologic or other
anatomic evidence is available.
Nuclear magnetic resonance (NMR) spectroscopy and magnetic resonance imaging (MRI) have the potential to evaluate cartilage integrity nondestructively and noninvasively. Specifically, sodium NMR may be used to estimate proteoglycan content and magnetization transfer NMR may be used to evaluate collagen content and structure.
Sodium NMR spectroscopy can be used to measure sodium content in isolated cartilage samples. With knowledge of tissue water content (determined from proton NMR spectroscopy or from the difference between wet and dry weights), sodium content can be converted to sodium concentration. Donnan equilibrium theory can then be used to calculate FCD from intratissue sodium concentrations. Since proteoglycans provide the dominant source of charge in cartilage, FCD is an indicator of proteoglycan content. Thus, sodium NMR can provide an estimate of proteoglycan content.
The magnetization transfer (MT) technique has been used to improve contrast in MR images of the knee (Wolff and Balaban 1989) and has recently been proposed as an NMR method for staging cartilage degeneration (Kim 1993). Kim et al had shown that the phenomenon of MT is specifically related to the collagen component of cartilage. This technique may provide an indication of the amount of collagen present and of its structural integrity.
The general aim of this project was to develop techniques using NMR spectroscopy which provide noninvasive and nondestructive in vitro determinations of cartilage structural and functional integrity. The work was divided into two parts: sodium experiments measuring proteoglycan content and magnetization transfer experiments evaluating collagen content and structure.
The first half of this thesis involves determination of proteoglycan content using sodium NMR. Specifically, we (1) verify the determination of FCD using sodium NMR, (2) investigate the influence of changing bath ionic composition, ionic strength, and pH on intratissue ion measurements and subsequent FCD calculations, (3) determine the degree to which the sodium measurement can be used to evaluate intact cartilage degradation and (4) extend this technique to an imaging mode.
The second half of this thesis involves the evaluation of the magnetization transfer technique for the determination of collagen content and/or structure. Specifically, we (1) characterize the MT experimental parameters, (2) examine the dependence of MT on collagen concentration or content, (3) examine the dependence of MT on collagen structure, and (4) determine the specificity with which MT can be used to evaluate cartilage degradation in intact cartilage samples.
The ability to fully understand degenerative joint diseases and formulate sensible preventive and therapeutic strategies has been hampered by the inability to assess the
in vivo functional status of cartilage. Clinical diagnosis of degenerative diseases like
osteoarthritis is typically only possible once the disease has progressed to some advanced state in which gross structural changes have occurred. We show that sodium and magnetization transfer NMR can be used to study cartilage matrix composition, specifically the glycosaminoglycan and collagen constituents. In the future, these techniques should be applicable to the clinical setting for early diagnosis and monitoring
PART I SODIUM
SODIUM NMR
TO CALCULATE FCD AND
BACKGROUND
A. PROTEOGLYCANS
Proteoglycans are composed of glycosaminoglycan (GAG) side chains (chondroitin sulfate and keratan sulfate) covalently linked to a core protein (Rosenberg and Buckwalter 1986). Proteoglycan monomers are then assembled into large aggregates by association of the core protein and a link protein with a large hyaluronate backbone. It is the GAG side chains which contribute the large negative charge, containing up to two anionic groups per disaccharide subunit (one sulfate, or one carboxyl and one sulfate). Since the ionic charge groups are "fixed" to the solid matrix, the net charge per volume is referred to as the fixed charge density (FCD). FCD in adult articular cartilage and intervertebral disc has been reported to be on the order of 0.2 moles of negative charge per liter tissue water, ranging from -0.05 M to -0.35 M, depending on age and anatomical site (Grushko 1989, Maroudas 1969, Maroudas 1979, Maroudas and Thomas 1970, Phillips 1984, Urban and Maroudas 1979).
B. PROTEOGLYCANS IN CARTILAGE
For its function as a load-bearing material, articular cartilage relies heavily on the extracellular matrix (ECM). Many of the biomechanical properties of cartilage are dependent on the ECM charge. Proteoglycans provide elasticity and stiffness on compression (Kuettner and Kimura 1985). The high negative charge density of the proteoglycans exerts a swelling pressure of several atmospheres inside the tissue. When the tissue is compressed, as for example during walking, the charge density increases, therefore increasing the swelling pressure and resisting further compression. When the load is removed, the tissue imbibes water, restoring its original shape. Both direct and indirect evidence suggests that the equilibrium and dynamic compressive moduli decrease with decreasing FCD (Eisenberg and Grodzinksy 1985, Frank 1987). In adult bovine articular cartilage, electrostatic interactions between fixed charge groups provide 50% of the tissue equilibrium compressive stiffness (Eisenberg 1983).
Proteoglycans also affect solute concentrations within the tissue. The ionic composition of the intratissue fluid is determined, in part, by tissue FCD in a manner consistent with Donnan equilibrium (Maroudas 1979). Because of the net negative charge on the matrix,
cations (e.g. Na+, H+, Ca2+) are at higher concentrations within the tissue relative to surrounding solutions (e.g. synovial fluid or blood), while anions (e.g. Cl-, HCO3-) are relatively dilute. The high concentration of proteoglycans may also retard the diffusion of larger molecules (Kuettner and Kimura 1985). Diffusion effects are significant for cartilage since it is relatively avascular and relies on diffusion for nutrition and waste removal. The influence of proteoglycans and thus, tissue FCD on intratissue fluid flow and ion content may have important biochemical and cellular consequences. For instance, hyaluronate binding properties of proteoglycans are dependent on intratissue pH (Sah 1990), and cell synthesis of matrix macromolecules is sensitive to pH (Gray 1988), sodium concentration (Urban and Bayliss 1989), and water content (Schneiderman 1986). Experimental evidence suggests that changes in intratissue fluid ionic composition resulting from compression-induced changes in FCD may provide a mechanism by which cells sense and respond to mechanical load (Gray 1988, Schneiderman 1986, Urban and Bayliss 1989). In addition, when cartilage is compressed, as would occur during walking, the intratissue fluid is expelled from the tissue. The separation of mobile counterions from the fixed matrix charge then results in the establishment of an electric potential referred to as an electrical streaming potential. The streaming potential has also been suggested as a possible mechanism for connective tissue growth and remodeling (Grodzinsky 1983).
Tissue hydration is also affected primarily by proteoglycans via bath (and therefore, intratissue fluid) pH and ionic strength (Grodzinsky 1983). The net charge on the ECM is a function of intratissue pH. Matrix carboxyl and sulfate groups become protonated at low pH, with intrinsic pK values reported to be around 3.5 for carboxyl and 2.0 for sulfate groups. Amino groups are affected at extremely basic pH; their pK is reported to be around 11 (Bowes and Kenten 1948a). Ultimately proteoglycans lose their charge (i.e. become less net negative) as pH decreases and collagen acquires a net positive charge. As the net matrix charge decreases at lower pH, intratissue swelling pressure and tissue hydration decrease. Ionic strength affects the electrostatic repulsion felt by adjacent negative charges. At low ionic strength, this repulsive force is greater since there are few counterions present to shield the charges. The tissue swells slightly, being constrained by the collagen fibrils. Although such extremes in bath pH and ionic strength are not seen
in vivo, they are frequently used in research studies to provide information about matrix
composition and structural interactions. Since it is related to matrix composition, tissue hydration can be considered to be an indicator of tissue health and is often measured in
C. TECHNIQUES FOR MEASURING PROTEOGLYCAN CONTENT
Proteoglycan content is typically measured in the laboratory using biochemical techniques. Cartilage samples are isolated, digested, and then analyzed using an appropriate assay. Indirect assessments of proteoglycan content have also been established using nondestructive techniques which determine fixed charge density, since the matrix charge is determined predominantly by proteoglycans.1. CHEMICAL DETERMINATION
Chemical analysis of solubilized tissue provides a destructive means of quantifying proteoglycan content by estimating the total number of available ionizable groups. For cartilage, the focus has been on determining GAG content through measures of total hexosamine (Antonopoulas 1964), uronic acid (Bitter and Muir 1962), or sulfated GAG (Famdale 1986). FCD is calculated from these measurements using estimates of molecular weight and charge of the measured species and independent measurements of tissue water content (e.g. Maroudas 1970).
2. NONDESTRUCTIVE TECHNIQUES
Several nondestructive techniques have been reported for quantifying proteoglycan content by measuring tissue FCD, including titration, radiotracer, and streaming potential methods. Phillips (Phillips 1984, Frank 1990) estimated the FCD of adult bovine articular cartilage using a titration method wherein thin (200 jim) slices of tissue were bathed in NaCl solutions and allowed to equilibrate after each of several quantitative additions of HC1 or NaOH to the bathing medium. Using measurements of the resulting equilibrium bath pH, the known titration behavior of water, an independent measure of tissue isoelectric point, and Donnan theory, tissue FCD at physiological pH was computed to be in the range of -0.2 to -0.25 M.
Using ion exchange theory, Maroudas (Maroudas 1970, Maroudas 1969) described a means for computing FCD from independent measurements of streaming potential, specific conductivity, and hydraulic permeability. FCDs thus computed for adult articular cartilage specimens were found to agree within 10% to estimates based on chemical measures of hexosamine and hexuronic acid content (Maroudas 1969).
Perhaps the most technically straightforward of the techniques for measuring the FCD of intact tissue is the radiotracer method. Here the tissue is equilibrated in an electrolyte solution (typically NaCl) containing trace quantities of radioactive ion(s) such as 2 2Na or
3 6C1. Intratissue sodium and/or chloride content is determined from 22Na and/or 36C1
measurements. Using Donnan theory and a separate measure of water content, tissue FCD can be calculated (see Theory section). Maroudas and Thomas (1970) found that the FCDs estimated using radiotracer techniques were within 9% of chemical determinations.
While the above techniques have contributed greatly to in vitro studies of the ionic properties of cartilage, none is applicable to the study of intact heterogeneous specimens or
in vivo systems. Nuclear magnetic resonance (NMR) spectroscopy and imaging have the
potential to enable nondestructive determinations of FCD. Several ions, including sodium, lithium, potassium, and chloride, have net magnetic moments and are observable by NMR. Therefore, intratissue ion concentrations can be determined with this technique. Sodium NMR spectroscopy may be used to measure sodium content in isolated cartilage samples. With knowledge of tissue water content (determined from proton NMR spectroscopy or from wet and dry weights), sodium content can be converted to sodium concentration. FCD can then be calculated from these ion concentrations using electroneutrality and ideal Donnan theory.
The basic technique is applicable to heterogeneous samples, living tissue, and in vivo systems. The objective of the studies reported here were to verify the use of sodium NMR for determination of FCD in cartilage and to use this technique to study changes in matrix composition in response to various interventions which mimic physiologic and pathophysiologic states.
THEORY
A. GENERAL NMR THEORY
The following introduction to NMR theory is taken primarily from Carrington and McLachlan (1967), Farrar (1989), and Edelman and Hesselink (1990). For further details, the reader is referred directly to these texts or to more advanced texts such as Slichter (1980).
All nuclei which have either an odd number of protons or an odd number of neutrons (or both) possess the property of spin. Spin angular momentum is represented as a vector with magnitude Ih, where h is Planck's constant divided by 2. I = 0 corresponds to nuclei with even mass numbers (sum of the number of protons and neutrons) and even numbers of protons; nuclei with even mass numbers but odd numbers of protons have I values which are integral multiples of 1. For nuclei with an odd mass number, I takes on values which are odd integral multiples of 1/2 (1/2, 3/2, etc.). Because these nuclei possess both spin and charge, they have a nuclear magnetic moment RN which is proportional to the
magnitude of the spin with the constant of proportionality called the gyromagnetic (or magnetogyric) ratio, y
tN = Yh I (1)
The gyromagnetic ratio is measured in units of radians sec-1gauss-1or MHz tesla-1.
According to the theory of quantum mechanics, the allowable nuclear spin states are quantized such that the nuclear spin vector in any one direction (referred to as the nuclear spin quantum number, m) may have only one of a discrete set of values, namely m = +I, (I-1), ..., -(I-1), -I. Therefore when the nuclear magnetic moment interacts with the an applied magnetic field, the nucleus has (21 + 1) equally spaced energy levels where the spacing between energy levels is given by:
with Bo being the applied magnetic field. For a spin 1/2 nucleus such as proton, m takes on values of +1/2 and -1/2.
The state m = +1/2 corresponds to a situation in which the spins and an applied magnetic field are parallel. The state m = -1/2 represents the situation in which the spins and applied magnetic field are antiparallel. Thus the state m = +1/2 has a lower energy than the state
m = -1/2. For an ensemble of protons interacting with a magnetic field Bo at temperature
T, the distribution of protons between the +1/2 and -1/2 spin states is governed by Boltzmann's law:
N+1/2 _ e- AE/kT (3)
N-l/2
where N represents the number of spins in each state and AE is a function of Bo (see equation 2). At ordinary room temperature and for typical applied fields on the order of 1-10 tesla, there is only a slight excess of protons aligned in the lower energy state (-1:106). Further discussion will deal only with these excess nuclei since we are interested in the net magnetic moment to which the others do not contribute.
In addition to aligning with or against the field, the individual magnetic moments also precess about the applied field with random phase at a frequency proportional to the strength of the magnetic field according to the following equation:
co = y Bo (4)
where O is called the Larmor or resonant frequency. Since the phases of the spins are randomized in the xy plane, the net magnetization from this population of magnetic moments is along the z axis (where z is defined as the direction of the magnetic field).
B. SPECIFIC NMR EXPERIMENTS
1. ONE PULSE
In the presence of a static magnetic field, a net magnetization is developed along the direction of the field, defined here as z. There is no net magnetization in the xy plane due to the random phase of the individual precessing magnetic moments. In the one pulse
NMR experiment, a radiofrequency (rf) magnetic field is applied perpendicular to the static field for a short period of time (an rf "pulse"). This rf pulse is oscillating at the Larmor frequency. At this frequency, stimulated transitions occur (the resonance condition) and some nuclei change their orientation with respect to the applied static field. In addition, the perpendicularly applied rf pulse will induce a phase coherence. In other words, the projections of the individual magnetic moments onto the xy plane will be aligned (but still spinning with angular frequency coo). The net magnetization vector (the sum of the individual magnetic moments) is therefore tipped off the z axis and precesses around the z axis with frequency coo.
The angle by which the net magnetization vector is rotated off the z axis is referred to as the flip angle. The flip angle increases with the strength and duration of the rf pulse. The relationship between the duration of the rf pulse and the angle by which the net magnetization vector is tipped from the z axis is described by:
0 = ol tp = yB1 tp (5)
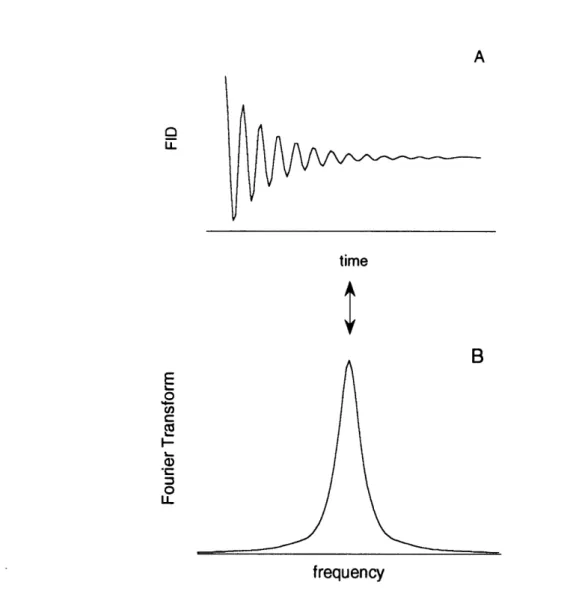
where B1 is the strength of the field of the rf pulse and tp is the pulse duration. If the rf pulse has the appropriate strength and duration to tip the net magnetization vector entirely into the xy plane, it is referred to as a 90 degree pulse. In this case, an equal number of nuclei will be precessing parallel as are precessing antiparallel to the applied static field. The time varying magnetization in the xy plane as the nuclei return to their steady state conditions induces a signal in a pickup coil (Figure 1A). This signal is referred to as a free induction decay (FID). The initial intensity of the FID is proportional to the number of nuclei in the sample. In practice, the number of nuclei is determined by integrating the area
under the curve of the Fourier transform of the FID which is equal to the initial FID intensity (Figure 1B) and calibrating the system to a known standard. The time constant for the return to random phase and consequently for the decay of the xy magnetization (and hence the detected signal) is referred to as T2. The time constant for total recovery of the magnetization vector along the z axis is referred to as T1.
A i. time R E 0 cn C I-0 U-frequency
FIGURE 1 A) Free induction decay (FID) and B) Fourier transform of FID. Area under transform curve (B) is equal to initial intensity of FID.
2. Ti RELAXATION
T1, the spin-lattice relaxation time, describes the recovery of the net magnetization vector along the z axis after being tipped into the xy plane. The inversion recovery sequence is most commonly used to measure T1:
180° -t X- 90' - acquire (6)
The return to equilibrium after the 180 degree pulse is described by the following equation with time constant T1:
I(z) = I(O) ( 1- 2 e -/T) (7)
At equilibrium, the net magnetization vector lies along the +z axis; after a 180 degree rf pulse, it is rotated 180 degrees so that it lies along the -z axis. The z component of the magnetization will gradually return to equilibrium, passing through zero along the way. At time r, a 90 degree pulse is applied which tips whatever z component is present so that it lies in the xy plane. At this point the signal is acquired. This sequence is repeated for various values of t. T1 is determined by fitting the data to equation 7.
3. T2 RELAXATION
T2, the spin-spin relaxation time, describes the loss of magnetization in the xy plane by the return of the individual magnetic moments to random phase. This relaxation process is characterized by the following equation:
I(z) = I(O) e -/T2 (8)
Ideally, T2 relaxation would be reflected in the decay of the FID by its exponential envelope. However, the time constant which describes the actual observed decay of the FID is referred to as T2*. This constant takes into account relaxation which occurs due to magnet inhomogeneities: slight variations in field strength result in the precession of the nuclei at slightly different Larmor frequencies. The individual magnetic moment vectors can be pictured as dephasing in the xy plane with some precessing faster, some slower than others. Thus, the phase coherence established by the rf pulse is lost.
The value of T2 is typically measured using a Hahn spin-echo experiment:
90 - TE12 - 180 - TE/2 - acquire (9)
In this experiment, two pulses are given separated by some time TE/2 where TE stands for echo time. The first 90 degree pulse flips the net magnetization vector into the xy plane. During the ensuing interval of time, TE/2, the spins lose some of their phase coherence due to local field inhomogeneities as described above and some due to inherent T2 relaxation processes. A 180 degree pulse then inverts the spins about the x or y axis so that after another delay of TE/2, an echo is detected as the spins refocus. Any decay in the magnitude of the net magnetization vector at the time of this echo is due to inherent relaxation processes in the system and not to static magnet inhomogeneities. It is assumed that the spatial distribution of inhomogeneities is such that diffusive motion of nuclei is not sufficient to alter the field experienced by an individual nucleus over the time TE. The experiment is repeated for multiple values of TE to determine a value for T2 using equation 8.
4. IMAGING
In NMR imaging experiments, magnetic field gradients are used to encode the signal as a function of spatial position in the sample. Therefore, the local concentration of a given nucleus can be obtained.
C. FCD CALCULATION
For a homogeneous tissue, FCD can be calculated from measurements of intratissue ion concentrations. Whether ion concentrations are measured using NMR, radiotracers (Maroudas and Evans 1972, Maroudas and Thomas 1970), or some other technique, the theory used for calculation of FCD is equivalent. It is reviewed briefly here.
Consider first the simple system of tissue bathed in NaCl. Let the subscript t represent the tissue and the subscript b represent the bath.
Electroneutrality requires that:
[Na+]t - [Cl-]t + FCD = 0
[Na+]b - [Cl-]b = 0
(10)
(11)
In situations where both [Na+]t and [Cl-]t can be determined and bath concentrations are known, FCD can be computed directly from equation 10.
The assumption of electrochemical or Donnan equilibrium across the tissue/bath interface requires that:
(t) 2 [Na+]t [Cl-]t = (b) 2 [Na+]b [Cl-]b (12)
where y is the mean ionic activity coefficient.
In the case of ideal Donnan equilibrium, yt = A such that:
[Na+]t [Cl-]t = [Na+]b [Cl-]b
Equations 10, 11, and 13 can then be solved for FCD:
FCD = [Na+] - [Na ], [Na'], FCD = [Cl-], [Cl (13) (14) (15)
With the assumption that ideal Donnan theory holds, equation 14 or 15 can be used to calculate FCD from a single measurement of tissue sodium or chloride concentration.
The theory can be extended to include multiple ions and multiple compartments. Equations used for the experiments described in this thesis are presented here for completeness.
In cases where bath contains NaCl and LiCl and either [Na+]t or [Li+]t is measured: FCD = [Na ]b[C1-]b [Nat t - [Na ] 1 +[Li'] [Naj], (16) FCD = [Li ]j[Cl], - [Li
],
[Li ],
1
+ [Na [Li],,)], ,In cases where bath contains NaCI at low pH, such that [H+] is significant and [Na+]t is measured: FCD = [Na ][Cl-], - [Na+], [Na', 1+ [H +], [Na+],) (18) (17)
METHODS
A. NMR METHODS
The intensity of the NMR signal or the area under the resonance curve is proportional to the number of nuclei in the sample. With proper system calibration and sample volume determination, the concentration of the nucleus under study can be determined. NMR calibration curves were made from measurements of ionic solutions of known concentration and volume. Resonance areas obtained from ions in tissue were compared to calibration curves to obtain absolute ionic content. After completion of all measurements, the cartilage was lyophilized and weighed. Water content was computed as the difference between wet and dry weights (1 g = 1 mL). The ionic content was then normalized to
tissue water content to yield intratissue ion concentrations:
[ion] ion content determined by NMR(19) =-on] tissue water content
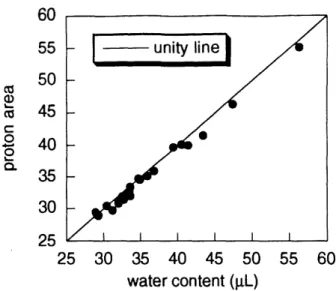
Preliminary experiments (Figure 2) confirm that, under the conditions of these experiments, water content can also be determined nondestructively by measuring the water proton peak in the proton NMR spectrum. Henceforth, the computation of ion concentration from two measurements (equation 19) will be referred to as the NMR measurement of an ion concentration.
NMR spectroscopy experiments were performed on an 8.45 tesla Bruker AM spectrometer (Bruker Instruments, Inc., Billerica, MA). A standard broadbanded probe was used for all experiments, with a radiofrequency coil diameter of 10 mm. Spectra were obtained with a 90° pulse sequence with 5T1 (where T1 is the longitudinal NMR relaxation time) between successive excitations to ensure total equilibration of the nuclei before the next pulse. T1 was measured in one cartilage sample using the standard inversion recovery pulse sequence and agreed with previous results (Foy 1989). The experimental parameters are given in Table 1. All experiments were performed at room temperature.
60 c a) 0 0L_ {:3 55 50 45 40 35 30 25 25 30 35 40 45 50 55 60 water content (L)
FIGURE 2 Cartilage water content determined from area of proton NMR spectra compared to water content determined from measurements of wet and dry weights.
In MR imaging experiments, magnetic field gradients are used to encode the signal as a function of spatial position in the sample to obtain the local concentration of a given nucleus. Imaging experiments were performed on a 4.7 tesla Bruker BIOSPEC, operating at 200.26 MHz for proton and 52.97 MHz for sodium. All images were obtained with the standard microimaging accessory with gradient coils of 5 cm diameter and dual H and Na radiofrequency coils with diameters of 25 and 20 mm, respectively. Specific imaging parameters are described later in Experimental Protocols.
Table 1 Parameters utilized for the NMR experiments. For each nucleus, the NMR resonant frequency is given, along with the measured T1, number of scans for signal
averaging, and the total acquisition time (AQ) for a spectrum. Solution Cartilage
Nucleus Freq T 1 number AQ T 1 number AQ (MHz) (sec) of scans (min) (sec) of scans (min) H-1 360.13 3.38 8 2 1.76 8 1.5
Li-7 139.96 17.0 8 14 7.5 16 12 Na-23 95.26 0.056 2000 10 0.020 4000 7
B. CARTILAGE PREPARATION:
The types of cartilage used in these studies were: adult bovine articular cartilage (adult AC), calf (1-2 week old) articular cartilage (calf AC), and calf epiphyseal cartilage (EC). Intact foreleg (EC) and hindleg (calf AC) knee joints were obtained immediately after slaughter (A. Arena, Hopkinton, MA) or frozen (adult AC; City Packing, Boston, MA). Tissue was harvested from the femoropatellar groove (AC) or distal ulna (EC) according to previously established techniques to yield plane-parallel disks 0.8 to 1.0 mm thick and 6.4 to 9.6 mm in diameter (Eisenberg and Grodzinsky 1985, Gray 1988). In all cases tissue was stored at -20'C until later use.
At least 4 hr before an experiment, disks were thawed and equilibrated at 4°C in the desired bathing solution (>100 mL/disk). Unless otherwise indicated, solutions were pH 8 with 5 mM Tris buffer. After equilibration, each disk was taken out of its bathing solution, blotted dry, weighed and placed in a capped 10 mm NMR tube.
Cartilage samples used for compression studies were typically 5 mm in diameter and 2 mm in thickness. Samples were placed in a specially designed NMR-compatible device which allowed radially unconfined compression between two impermeable platens (Hartman 1991). The degree of compression was established by adjusting the spacing between the platens. Control studies confirmed that insignificant NMR signal was obtained from the compression device. After a new compressive load was applied, the sample holder (constraining the sample) was placed in a stirred bath for at least 90 min. Before NMR measurements were made, the sample holder was removed from the bath and thoroughly blotted dry, including the edges of the sample.
C. FCD CALCULATIONS
For most experiments, FCD was calculated from intratissue ion concentrations as measured by NMR using electroneutrality (equation 10) or from intratissue sodium concentrations using ideal Donnan theory (equation 14). Equations for experiments in which additional ions had to be considered are discussed in the Theory section.
EXPERIMENTAL PROTOCOLS
A. CONTROL STUDIES
1. CALIBRATION
To confirm the linear relationship between NMR signal and ion content, spectra were obtained for small volumes (30 - 100 kL) of 0 to 0.5 M NaCl or LiCl solutions. In order to verify that the NMR measurement of sodium content could be made in the presence of GAGs, 5% (w/w) chondroitin sulfate solutions were prepared with NaCl added to yield increases in [Na+] from 0 to 0.3 M. A 50 gL volume of each solution was placed in a pre-weighed NMR tube, pre-weighed (to confirm volume measurement), and sodium content determined by NMR.
Several studies were conducted in order to determine whether measurements of ion content in tissue were equivalent to measurements of ion content in free solution (i.e. to determine if ions in cartilage are totally "visible" by NMR). Calf AC was equilibrated in 0.15 M or 0.2 M NaCl. Intratissue sodium and chloride content were measured by NMR. 400 -600 jiL of deionized distilled water was added directly to the NMR tube containing the cartilage sample so that the intratissue sodium and chloride would diffuse out of the tissue (ratio of tissue water to added water was approximately 1:10). (Small desorbing volumes were used in order that the total sample volume remain in the sensitive region of the NMR coil.) After 3 hr, sodium and chloride content were measured for the cartilage/water ensemble. Finally, the cartilage was removed from the water, blotted dry, and measured for remaining intratissue sodium and chloride content. Additional calf AC was initially equilibrated in 0.015 to 0.050 M NaCl and then desorbed with 0.15 M KC1. KC1 was used as a desorbant rather than water in order to more effectively desorb the sodium. (For these samples [C1-] was not determined.)
2. ICP ANALYSIS
Because complete desorption of sodium was not possible with the small volumes used in the desorption experiments described above, an independent technique was used to determine whether all the sodium in tissue is observable by NMR. Calf and adult AC
![FIGURE 3 [Na+], FCD, and total charge for each of two samples (A & B), before and after compression by 39% (A) and 25% (B)](https://thumb-eu.123doks.com/thumbv2/123doknet/14425711.514150/43.915.109.689.162.791/figure-na-fcd-total-charge-samples-amp-compression.webp)