HAL Id: hal-00328158
https://hal.archives-ouvertes.fr/hal-00328158
Submitted on 9 Oct 2008HAL is a multi-disciplinary open access archive for the deposit and dissemination of sci-entific research documents, whether they are pub-lished or not. The documents may come from teaching and research institutions in France or abroad, or from public or private research centers.
L’archive ouverte pluridisciplinaire HAL, est destinée au dépôt et à la diffusion de documents scientifiques de niveau recherche, publiés ou non, émanant des établissements d’enseignement et de recherche français ou étrangers, des laboratoires publics ou privés.
Optical techniques for microwave frequency
stabilization : resonant versus delay line approaches and
related modelling problems
Pierre-Henri Merrer, Houda Brahimi, Olivier Llopis
To cite this version:
Pierre-Henri Merrer, Houda Brahimi, Olivier Llopis. Optical techniques for microwave frequency stabilization : resonant versus delay line approaches and related modelling problems. 2008 IEEE Topical Meeting on Microwave Photonics, Oct 2008, Gold Coast, Australia. pp.146-149. �hal-00328158�
Optical techniques for microwave frequency stabilization :
resonant versus delay line approaches and related modelling problems
P.H. Merrer, H. Brahimi, O. Llopis
LAAS-CNRS, Universite de Toulouse, 7 av. du Colonel Roche, 31077 Toulouse, France
Abstract
Optical techniques for microwave oscillators stabilization or microwave sources phase noise measurement are discussed. The advantage in terms of Q factor of optical resonant devices goes with increased difficulties in the system stabilization. System modelling is also complex, because of the interaction of noise sources around three different frequencies : optical, microwave and baseband.
Introduction
Optical devices are today an interesting alternative to microwave techniques for time and frequency metrology or applications, and also for any application where the source spectral purity is mandatory such as Doppler radars or radiometers. As we will see, they also bring high potentialities for millimetre and submillimetre wave applications, such as material spectroscopy.
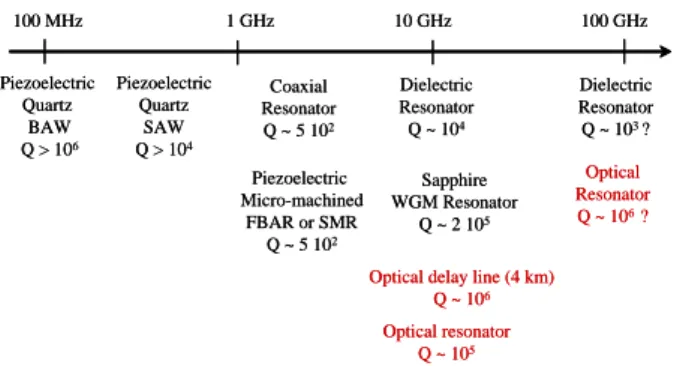
Figure 1 represents the current state of the art of resonators used in microwave high spectral purity sources. As it is shown in this figure, optical techniques can compete efficiently with microwave techniques thanks to their equivalent Q factor, which increases in the high microwave range.
Figure 1 : resonators for oscillators stabilization,
from RF to millimetre wave range
The first (today well known) technique is based on the use of optical long delay lines, in the kilometre range, taking benefit of the low losses of the optical media. This technique is used either to stabilize an oscillator [1] or to realize a frequency reference for a phase noise measurement bench [2]. The equivalent Q factor is in this case very high, and the practical implementation of the system is relatively easy using conventional telecommunications optical devices (laser, modulator and photodiode). In case of oscillators, the
main problem with this technique is in the high number of modes, which may prevent the practical use of the oscillator. The main solutions proposed to this problem involve several delay lines of different length, which is efficient but increases the system complexity and size. System size is indeed another problem of this approach, which prevents its usability in embedded systems.
To solve the problem of size, it has been more recently proposed to replace the delay line by an optical resonator [3]. This however changes completely the approach : the optical resonator works with the laser in a coherent mode, and allows only a discrete set of optical (and microwave) frequencies to be used. These two remarks are of importance : “coherent mode” means that the laser should be of high spectral purity (which was not mandatory in delay line systems) or has to be locked in some way to the resonator ; “discrete set of frequencies” implies that the system frequency is determined by the resonator geometry and other parameters (material, temperature...), and this is valid both for the optical frequency and the microwave beat frequency.
Another problem is in the choice of the resonator. An ultra high Q factor has to be obtained, because the equivalent Q factor at microwave frequencies is divided by the ratio between the optical frequency and the microwave frequency. Thus, optical Q factors higher than 108 are required, and if possible in the range of 109 to 1010. Such Q factors can be obtained with optical whispering gallery modes (WGM) resonators, such as fused silica spheres or polished disks of monocristaline CaF2, quartz or other low loss optical materials [4,5]. They can also be obtained with optical fiber loops (or ring resonators), either passive [6] or active [7]. Both techniques have their advantages and drawbacks. The coupling of a WGM resonator, and its integration to a system, is a difficult problem (which has been discussed elsewhere [5]). This coupling problem is solved in the fiber ring approach, but the size and the thermal regulation of the resonator will be probably more difficult. Moreover, the highest Q factors have been obtained with polished monocristaline materials [4], which are impossible to integrate in a conventional microelectronics approach.
In this paper, we first discuss the theoretical aspects of a stabilization technique based on a resonator instead of a delay line, deriving formulas for the equivalent microwave Q factor and its behaviour with frequency. Then, the problem of the laser locking onto the resonator is discussed and a solution is proposed. Finally, the
Piezoelectric Quartz BAW Q > 106 100 MHz Piezoelectric Quartz SAW Q > 104 1 GHz Piezoelectric Micro-machined FBAR or SMR Q ~ 5 102 Coaxial Resonator Q ~ 5 102 10 GHz Dielectric Resonator Q ~ 104 Sapphire WGM Resonator Q ~ 2 105 100 GHz Dielectric Resonator Q ~ 103 ?
Optical delay line (4 km) Q ~ 106 Optical resonator Q ~ 105 Optical Resonator Q ~ 106 ? Piezoelectric Quartz BAW Q > 106 100 MHz Piezoelectric Quartz SAW Q > 104 1 GHz Piezoelectric Micro-machined FBAR or SMR Q ~ 5 102 Coaxial Resonator Q ~ 5 102 10 GHz Dielectric Resonator Q ~ 104 Sapphire WGM Resonator Q ~ 2 105 100 GHz Dielectric Resonator Q ~ 103 ?
Optical delay line (4 km) Q ~ 106 Optical resonator Q ~ 105 Optical Resonator Q ~ 106 ?
problem of noise in these systems is also discussed, together with some elements for its modelling.
Optical resonator versus delay line
The principle of the microwave-optical delay line is easy to understand : the microwave signal is transferred onto an optical carrier and is delayed in an optical fiber, which can reach a few kilometres without adding to much losses and degrading the signal to noise ratio. The microwave delay is almost exactly the optical signal delay, which can be calculated with the optical index and the fiber length. As an example, a 4 km fiber generates a delay of 18.7 μs, and less than 1 dB losses (which is negligible compared to the conversion losses between the microwave and the optical domain).
The stabilization of an oscillator is related to the phase of the signal in the oscillation loop, and more precisely to the phase versus frequency slope of the loop transfer function. If a high Q device is used in the loop, the phase to frequency slope is imposed by this element. When another element of the loop generates a phase fluctuation 2
t
ϕ
Δ , because the total loop phase must remain constant, this phase fluctuation is compensated by a fluctuation of the oscillator frequency 2
f
Δ [8], and the output frequency noise is inversely proportional to the phase to frequency slope of the loop.
)
1
(
0
2 2 2Δ
=
⎟⎟
⎠
⎞
⎜⎜
⎝
⎛
∂
∂
+
Δ
f
f
tϕ
ϕ
Thus, the loop phase to frequency slope is the stabilization parameter of the oscillator.
If the oscillator is stabilized on a microwave resonator, the resonator transfer function can be described using the following equation :
)
2
(
2
1
)
(
0 0 o o jf
f
-f
Q
j
e
H
f
H
+
=
ϕwith Q being the loaded Q factor of the resonator, and fo the resonant frequency.
From this equation, the phase to frequency slope imposed by the resonator is :
)
3
(
2
0 o f ff
Q
f
d
d
=
−
=ϕ
If the oscillator is stabilized on a delay line, the loop transfer function is :
)
4
(
)
(
2 0 τ π f je
H
f
H
=
−with τ being the delay, and f the microwave frequency.
In this case, the phase to frequency slope can be written as :
)
5
(
2
πτ
ϕ
−
=
f
d
d
Therefore, the stabilizing effect of a delay line can be described using an equivalent Q factor, which is computed from equations (3) and (5) :
) 6 (
τ
π
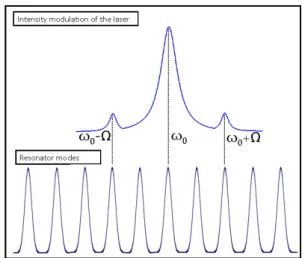
f Q =From this equation, it is possible to compare the performance of a delay line system with the performance of a resonator based system. The only remaining difficulty in case of microwave optical systems, is that the resonator is described by its optical Q factor, and the Q factor involved in equations (2) or (3), is the microwave Q factor. It is thus necessary to compute an equivalent microwave Q factor from the optical Q factor. The process of microwave filtering through an optical resonator is qualitatively described in Figure 2. The optical resonator features a large number of modes, with a mode spacing corresponding to the microwave frequency which has to be stabilized.
Figure 2 : filtering of the laser modulated signal using three
successive modes of the optical resonator
The laser signal goes through one of these modes, and the two lateral sidebands, coming from the microwave modulation of the laser signal, goes through the two lateral modes. If we consider that each of the optical modes can be described using an equation of the same type as equation (2), and if we consider an amplitude modulated signal for the laser :
[
cos(
)
]
cos(
)
(
7
)
)
(
t
A
A
t
t
S
=
+
Δ
Ω
ω
with ω being the optical pulsation and Ω the microwave pulsation.
It is easy to calculate the output signal of the optical resonator at ω, ω−Ω and ω+Ω, and then to compute the microwave signal resulting from the quadratic detection of this output signal. Considering that the three successive modes are exactly identical, the computation of the phase to frequency slope of this signal leads to :
)
8
(
2
0ω
ϕ
Q
d
d
=
−
Ω
Ω=ΩThus, the equivalent microwave Q factor of this system can be computed from equations (3) and (8) :
)
9
(
ω
opto microwaveQ
Q
=
Ω
Equation (9) shows that the equivalent microwave Q factor of the optical resonator is the optical Q factor multiplied by the ratio of the microwave modulation frequency to the optical frequency. As an example, if we consider a 20 GHz application, using a λ = 1.5 μm laser, the frequency ratio is 104, and thus the equivalent microwave Q is reduced by 104 compared to the optical Q factor. This explains why optical Q factors higher than 108 or 109 are mandatory for these applications.
We have studied three different types of optical resonators featuring such high Q factors : polished quartz disk resonator, silica sphere obtained by fusion of a glass rod using a CO2 laser and a fiber ring resonator.
These resonators are depicted in Figure 3. The coupling techniques and the measurement set-up for the test of the mini-disk or the silica sphere resonators have been described elsewhere [5,9]. It uses tapered fiber and a piezoelectric nanometer range control for the coupling of the resonators. All the system is of course on a vibration free support, and protected from the dust.
Figure 3 : quartz resonator (Ø : 7 mm ; 8 GHz mode spacing)
silica sphere (Ø : 3.3 mm ; 20 GHz mode spacing) ; fiber ring resonator (loop length : 1 m ; 205 MHz mode spacing)
Compare to the sphere or disk resonator, the fiber loop feature the advantage of an easy coupling thanks to the mature technology of optical fiber couplers. Of course, these resonators are larger than sphere or disk resonators, but their 2D geometry allows their integration in many systems (on a 10 cm x 10 cm plate). In Figure 4, the resonances of a 1 m fiber loop resonator are shown. This resonator features an optical Q factor close to 108 [6], which is already useful for many applications. The measurement plotted in figure 5 is performed using a high spectral purity fiber laser featuring a linewidth in the range of 1 kHz. This wavelength scan using a high spectral purity laser allows the observation of the resonances, but the direct measurement of the Q factor is more difficult because of the sharpness of these resonances. This is mainly due to the high sensitivity to any change in temperature of these ultra high Q resonators, including the self heating due to the injected optical power. This is clearly visible during the wavelength scan [5] : depending on the material thermal coefficient and on the type of scan which is performed, the observed resonance will be sharp (temperature effect opposed to the scanning direction) or quite large (the temperatures induces a frequency shift
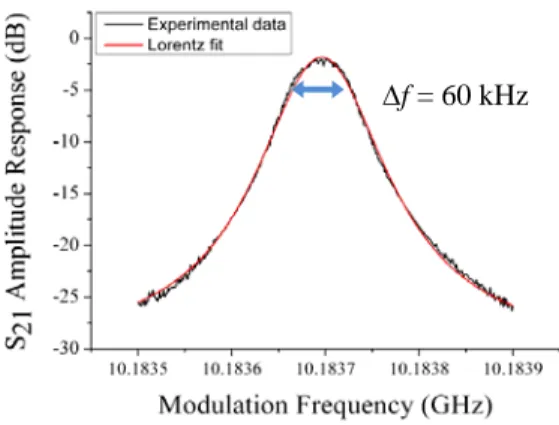
which follows the scan). Thus, the main problem to build a system with this type of resonators is to be able to lock the laser onto the resonator. For the fiber ring resonator, we have proposed a technique [6] based on a Pound-Drever feedback loop. Using this technique, we have been able to get a stable high Q microwave filter featuring a 3 dB bandwidth of 2.4 MHz [6]. More recently, a longer loop of 20 m has been measured with this technique, improving not only the resonator length but also the losses in the loop. An effective filtering bandwidth of 60 kHz, has been measured (Figure 5), which corresponds to an optical Q factor of 3.2 109.
Figure 4 : 1 m length fiber ring resonator resonances
Power vs frequency (in MHz)
Figure 5 : microwave filtering with a fiber loop resonator
using a 20 m fiber loop
In order to compare the performance of these microwave optical resonators to the performance which could be obtained with the delay line approach, it is possible to use formulas (6) and (9).
)
10
(
τ
π
microwave opto opto microwave microwaveQ
f
f
f
Q
=
=
Thus, an optical Q factor of 108 (1 m fiber loop) is equivalent to a delay τ of 160 ns, which would require a 34 m fiber ! This Q value is the lowest value of all the mini-resonators discussed here, and Q values in the range of at least 109 are foreseen for these applications, which would correspond to large delay lines counterparts. These data clearly show the interest of the resonator approach compare to the delay line.
400 600 800 1000 1200 1400 1600 1800 0.00 0.01 0.02 0.03 0.04 0.05 0.06 0.07 0.08 FSR = 205 M H z Δf = 60 kHz Frequency (MHz) Normaliz ed Intens ity Output
As an example, the 20 m length fiber resonator features in the RF or the microwave range a resonance every 10 MHz with a constant bandwidth of 60 kHz. At 20 GHz, this corresponds to an equivalent microwave loaded Q factor of 3 105, which is far beyond the microwave resonators counterparts. However, this resonator still suffers from temperature stability or mode interaction problems, on which we are working.
Modelling of microwave-optical low phase noise systems
Resonator is not the only key of success in this difficult topic. It is necessary to be able to manage the noise in the system, including both microwave and optical parts. To solve this problem, we have chosen an original approach based on a microwave CAD software [10], Agilent ADS. This software allows the computation of the noise conversions between various harmonics signals, including 1/f noise sidebands and noise floors. The approach used is an harmonic balance approach, which is particularly well fitted to the analysis of noise in nonlinear systems featuring very different carrier frequencies. In our case, we are facing with three interacting frequency domains : DC, optical and microwave. Each of these frequency domains are linked through the system nonlinearities (ex : Mach Zehnder modulator nonlineartity), and the noise components are also of importance at all these frequencies. The input noise sources considered are : the laser FM and AM noise, and the photodiode noise (shottky and 1/f noise).
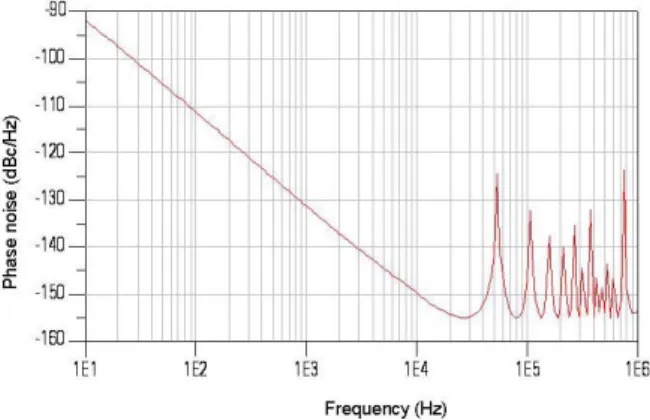
Figure 6 : phase noise floor of a microwave frequency
discriminator realized with a 4 km optical delay line simulated on Agilent ADS
The most complex system we have been able to simulate with this approach is a microwave phase noise measurement bench based on an optical delay line (which has been realized in our laboratory [2]). The simulated phase noise is shown in Figure 6 for this system. These data are somewhat optimistic compare to the experimental bench [2], but the phase noise floor of such a system is very difficult to measure. However, the general behaviour observed on the physical system is well described by the simulation, with the exception of the 1/f phase noise which up to now has not been successfully simulated. The next step will be to use this
approach to simulate the microwave optical oscillators, including the optical resonator and the laser locking system.
Conclusion
The optical resonator technique to stabilize microwave oscillators has been compared to the best known delay line approach. Theoretical calculations show the advantage of the resonator approach in terms of Q factor, which can be compared to the equivalent Q factor of relatively long delay lines. This technique will be particularly efficient in the high microwave range, where it does not have up to now any competitor in the same Q factor range. However, the system design problems, including the noise modelling, will need an ever increased effort, in order to take the whole benefit of these system potentialities.
References
1) X.S. Yao, L. Maleki, D. Eliyahu, “Progress in the optoelectronic oscillator – a ten year anniversary review”, 2004 IEEE Microwave Theory and Tech. Symp. Digest, pp. 287-290.
2) B. Onillon, S. Constant, O. Llopis, “Optical links for ultra-low phase noise microwave oscillators measurement”, IEEE Int. Freq. Control Symposium, Vancouver, août 2005, , pp. 545-550.
3) L. Maleki, X.S. Yao, J. YU, V. Ilchenko, “New schemes for improved opto-electronic oscillator” Int. Topical Meeting on Microwave Photonics, MWP99, p. 177, 17-19 nov 1999.
4) A.A. Savchenkov, V.S. Ilchenko, A.B. Matsko, and L. Maleki,“Kilohertz optical resonances in dielectric crystal cavities,” Phys. Rev. A, vol.70, Issue 5, Nov. 2005.
5) P.H. Merrer, O. Llopis, S. Bonnefont, P. Feron,
G. Cibiel, “Microwave filtering using high Q optical resonators” Proc. of the European Microwave Conf., Amsterdam 2008.
6) P.H. Merrer, O. Llopis, G. Cibiel “Laser stabilization on a fiber ring resonator and application to RF filtering” to be published in IEEE PTL.
7) D. Eliyahu, L. Maleki, “Modulation response (S21) of the coupled opto-electronic oscillator”, Proc. of the IEEE Int. Frequency Control Symp., Vancouver 2005, pp. 850-856.
8) D.B. Leeson, "A simple model of feedback oscillator noise spectrum," Proc. Letters of IEEE, Vol. 54, N° 2, pp. 329-330, 1966.
9) S. B. Constant et al., “A characterization bench to analyse various types of optical WGM resonators for high spectral purity microwave sources applications”, Proceedings of the IEEE Int. Frequency Control Symposium, Miami 2006, pp. 519-527.
10) H. Brahimi, P.H. Merrer, O. Llopis, « CAD of microwave optical systems for time&frequency applications” Proc. of the European Frequency and Time and Forum (EFTF), Toulouse, April 2008.