HAL Id: hal-00296503
https://hal.archives-ouvertes.fr/hal-00296503
Submitted on 25 Mar 2008
HAL is a multi-disciplinary open access
archive for the deposit and dissemination of
sci-entific research documents, whether they are
pub-lished or not. The documents may come from
teaching and research institutions in France or
abroad, or from public or private research centers.
L’archive ouverte pluridisciplinaire HAL, est
destinée au dépôt et à la diffusion de documents
scientifiques de niveau recherche, publiés ou non,
émanant des établissements d’enseignement et de
recherche français ou étrangers, des laboratoires
publics ou privés.
atom chemistry in the Arctic
A. E. Cavender, T. A. Biesenthal, J. W. Bottenheim, P. B. Shepson
To cite this version:
A. E. Cavender, T. A. Biesenthal, J. W. Bottenheim, P. B. Shepson. Volatile organic compound ratios
as probes of halogen atom chemistry in the Arctic. Atmospheric Chemistry and Physics, European
Geosciences Union, 2008, 8 (6), pp.1737-1750. �hal-00296503�
www.atmos-chem-phys.net/8/1737/2008/ © Author(s) 2008. This work is distributed under the Creative Commons Attribution 3.0 License.
Chemistry
and Physics
Volatile organic compound ratios as probes of halogen atom
chemistry in the Arctic
A. E. Cavender1, T. A. Biesenthal2,*, J. W. Bottenheim3, and P. B. Shepson1,2,4,5
1Department of Chemistry, Purdue University, West Lafayette, IN, USA 2Department of Chemistry, York University, Toronto, Ontario, Canada
3Science and Technology Branch, Environment Canada, Toronto, Ontario, Canada
4Department of Earth and Atmospheric Science, Purdue University, West Lafayette, IN, USA 5Purdue Climate Change Research Center, Purdue University, West Lafayette, IN, USA *now at: Sciex, Concord, Ontario, Canada
Received: 3 July 2007 – Published in Atmos. Chem. Phys. Discuss.: 8 August 2007 Revised: 13 February 2008 – Accepted: 29 February 2008 – Published: 25 March 2008
Abstract. Volatile organic compound concentration ratios
can be used as indicators of halogen chemistry that occurs during ozone depletion events in the Arctic during spring. Here we use a combination of modeling and measurements of [acetone]/[propanal] as an indicator of bromine chemistry, and [isobutane]/[n-butane] and [methyl ethyl ketone]/[n-butane] are used to study the extent of chlorine chemistry during four ozone depletion events during the Polar Sunrise Experiment of 1995. Using a 0-D photochemistry model in which the input of halogen atoms is controlled and varied, the approximate ratio of [Br]/[Cl] can be estimated for each ozone depletion event. It is concluded that there must be an additional source of propanal (likely from the snowpack) to correctly simulate the VOC chemistry of the Arctic, and fur-ther evidence that the ratio of Br atoms to Cl atoms can vary greatly during ozone depletion events is presented.
1 Introduction
It is well known that in Arctic regions periods of ozone deple-tion occur during the late winter and spring, corresponding with Polar Sunrise (Bottenheim et al., 1986, 2002; Oltmans and Komhyr, 1986). This sudden and frequent loss of ozone is highly correlated with elevated concentrations of halogen-containing radicals, the source of which appears to be sea salt aerosols from the Arctic Ocean (Barrie et al., 1988; Simpson et al., 2005), and/or the salt-laden snowpack. The
observa-Correspondence to: A. E. Cavender ([email protected])
tions of Bottenheim et al. (2002) and Tackett et al. (2007) im-ply that halogen species are activated largely at the surface. While it is widely accepted that bromine chemistry in the gas and aerosol phase creates a catalytic cycle that destroys ozone (Barrie et al., 1988; Fan and Jacob, 1992; Hausmann and Platt, 1994; Vogt et al., 1996), the role of chlorine atoms in ozone destruction, and as important oxidizers, in the Arctic is not as well understood (Jobson et al., 1994; Yokouchi et al., 1994; Shepson et al., 1996; Impey et al., 1997; Tuckermann et al., 1997; Keil and Shepson, 2006). This is mostly due to the analytical difficulty in directly measuring the highly reactive Cl, which is thought to exist in very small but ki-netically important quantities in the Arctic boundary layer (on the order of 2×10⁴molec/cm3 during ozone depletion events) (Jobson et al., 1994; Ramacher et al., 1999; Boudries and Bottenheim, 2000; Keil and Shepson, 2006). Chlorine atom concentrations can be calculated based on decreases in measured alkanes, and relationships between volatile organic compounds (VOCs) can be utilized to further understand the role of Br and Cl (Jobson et al., 1994; Sander et al., 1997; Boudries et al., 2002; Evans et al., 2003).
By examining the relationships between alkanes and their oxidation products, the extent of reaction with various oxi-dizers in a given parcel of air can be studied. At coastal sites these oxidizers can include OH, Br and Cl radicals (Pszenny et al., 1993; Spicer et al., 1998). An example of this is the oxidation of n-butane to produce a peroxy radical:
CH3CH2CH2CH3+OH · (or Cl·) + O2
This peroxy radical can then go on to react with NO, HO2
or other peroxy radicals to form methyl ethyl ketone (MEK) and other products:
CH3CH2CH(OO·)CH3+NO →CH3CH2CH(O·)CH3+NO2 (R2) CH3CH2CH(OO·)CH3+HO2→ CH3CH2CH(OOH)CH3+O2 (R3) CH3CH2CH(OO·)CH3+RO2· →CH3CH2C(O)CH3+ROH + O2 (R4) CH3CH2CH(OO·)CH3+RO2· →CH3CH2CH(OH)CH3+RC(O)R′+O2 (R5) CH3CH2CH(OO·)CH3+RO2· →CH3CH2CH(O·)CH3+RO · +O2 (R6) CH3CH2CH(O·)CH3+O2 →CH3CH2C(O)CH3+HO2 (R7)
For [Cl]/[OH]>0.01, the rate of butane oxidation in Re-action (R1) will be dominated by Cl atoms. The rate constants at 245 K (typical of Arctic regions dur-ing sprdur-ing) for the reactions of n-butane and MEK with OH radicals are very similar, differing by a factor of 1.4 (kn-butane+OH=1.64×10⁻¹²cm3/molec s (Donahue et al.,
1998), kMEK+OH=1.17×10⁻¹²cm3/molec s (Atkinson et al.,
2001)), while the rate constants for Cl atom reaction with these species at 245 K differ by a factor of 7.8 (kn-butane+Cl=2.15×10⁻¹⁰cm3/molec s (Tyndall et al., 1997),
kMEK+Cl=2.75×10⁻¹¹cm3/molec s (Cuevas et al., 2004)).
Due to this, the ratio [MEK]/[n-butane] can be indicative of oxidation by chlorine atoms in the atmosphere under certain conditions of the [Cl]/[OH] ratio. If oxidation oc-curs solely by OH radicals, [MEK]/[n-butane] is expected to change slowly, as the rates of production and destruc-tion can become comparable relatively quickly. However, if chlorine atoms are responsible for the oxidation process, n-butane oxidation to produce MEK outpaces MEK destruc-tion, leading to enhancement in the [MEK]/[n-butane] ra-tio. Under ozone depletion conditions, when [Cl] can be
>1×10⁴molec/cm3, rapid butane oxidation by Cl atoms can occur. Bromine atoms are not believed to affect the [MEK]/[n-butane] ratio, because they do not react with small ketones, and only react very slowly with alkanes (kn-butane+Br=2.2×10⁻¹⁸cm3/molec s at 298 K (Galiba et al.,
1964)).
The ratio [isobutane]/[n-butane] is unaffected by OH radi-cal chemistry but is affected by Cl atom chemistry, and hence it can also be used as an indicator of chlorine atom chemistry.
The rate constants for OH reaction with isobutane and n-butane at 245 K are essentially identical (they differ by a fac-tor of 1.006), at 1.65×10⁻¹² and 1.64×10⁻¹²cm3/molec s,
respectively (Donahue et al., 1998). However, for Cl reac-tion with isobutane and n-butane the rate constants at 245 K differ by a factor of 1.65, with values of 1.30×10⁻¹⁰ and 2.15×10⁻¹⁰cm3/molec s, respectively (Hooshiyar and Niki, 1995; Tyndall et al., 1997). The ratio [isobutane]/[n-butane] is observed to be approximately 0.5 at the point of emission by fossil fuel use (Penkett et al., 1993; Jobson et al., 1994; Greenberg et al., 1996; Solberg et al., 1996). However, it has been observed that [isobutane]/[n-butane] is enhanced dur-ing ozone depletion events (Jobson et al., 1994; Solberg et al., 1996), which has been ascribed to rapid Cl-atom process-ing of n-butane. By examinprocess-ing both [MEK]/[n-butane] and [isobutane]/[n-butane], the amount of processing that occurs by both Cl and OH radicals can be examined.
A similar analysis can be used to elucidate the extent of bromine atom chemistry, using the ratio of two different products that result from the oxidation of propane. Similar to n-butane, propane is oxidized to produce peroxy radicals: CH3CH2CH3+OH · (or Cl·) + O2
→CH3CH(OO·)CH3+H2O (or HCl) (R8)
CH3CH2CH3+OH · (or Cl·) + O2
→CH3CH2CH2(OO·) + H2O (or HCl) (R9)
Each of these radicals then proceeds to react with NO, HO2
or another peroxy radical, similar to Reactions (R2) through (R7). The 2-propyl peroxy radical from Reaction (R8) eventually forms acetone, while the 1-propyl peroxy radical from R9 eventually forms propanal. Using concentrations of 1×10⁸molec/cm3 for NO, HO2 and RO2, the relatively
clean Arctic air yields of propanal and acetone are 11% and 14%, respectively, when propane is oxidized by Cl, and 6% and 19% when propane is oxidized by OH. It has been shown that bromine atoms react readily with aldehydes via abstraction of the aldehydic H-atom, but not with ketones. The rate constant for reaction of bromine atoms with propanal at 245 K is 9.73×10⁻¹²cm3/molec s (Wallington et al., 1989). Thus when bromine atoms are present the ratio [acetone]/[propanal] will be enhanced due to the preferential removal of propanal. There are some complications in this analysis, in that both acetone and propanal do react with both OH and Cl radicals
(kacetone+OH@245 K=1.30×10⁻¹³cm3/molec s,
kacetone+Cl@298 K=3.50×10⁻¹²cm3/molec s,
kpropanal+OH@245 K=2.61×10⁻¹¹cm3/molec s,
kpropanal+Cl@298 K=1.20×10⁻¹⁰cm3/molec s)
(Wollenhaupt et al., 2000; Atkinson et al., 2001). However, since [Br] is often quite large (>1×10⁷molec/cm3), relative
to [Cl] and [OH] in the Arctic springtime boundary layer, and given the rate constant for bromine atom reaction with propanal, the ratio is substantially impacted by [Br]. The
contribution of each of these species to [acetone]/[propanal] will be evaluated in the discussion section of this paper.
In this work ambient data that were collected between 17 March and 24 April 1995 at Alert, Nunavut (82.5◦N, 62.3◦W) are presented and the ratios of the measured VOCs are analyzed to further understand the impact and variability of the halogen atoms present during ozone depletion events. Additionally, a 0-D model has been constructed to support the analysis of VOC ratios to evaluate the relative importance of Cl, Br and OH radicals.
2 Experimental
2.1 Ambient measurements from Polar Sunrise Experiment (PSE), Alert, 1995
Ambient air was scrubbed of ozone by passing it through a potassium iodide trap, and then VOCs were trapped by pumping it through an adsorbent trap consisting of Tenax TA (35/60 mesh, 160 mg, Supelco, Pennsylvania) followed by Carboxen-569 (110 mg, Supelco, Pennsylvania). Typi-cal sample sizes were 1.3 L. This trap was cooled to 5◦– 10◦C while sampling utilizing cold ambient air, and then des-orbed under helium flow at 250◦C. The sample components were injected into a gas chromatograph (Hewlett Packard 5890) containing a PoraPLOT Q column (10 m×0.32 mm, Varian, California) that was held at 35◦C. Once desorption from the trap was complete the GC oven was heated rapidly to 100◦C, then increased by 5◦C/min to 200◦C, and finally ramped quickly to 240◦C. A quadrupole mass spectrometer
(Hewlett Packard 5972) was used for detection, scanning a mass range of 27–200 a.m.u. at a rate of 24 scans per second. Calibrations were conducted twice per day throughout the study, using a permeation source of acetone. Overall mea-surement uncertainties for acetone, MEK, n-butane, propanal and isobutane were estimated to be ±10%, 15%, 20%, 30% and 35%, respectively.
The nearby Global Atmospheric Watch (GAW) station, operated by Environment Canada, provided all ozone data for this experiment.
2.2 0-D model
A 0-D model was created, incorporating much of the known gas-phase chemistry of VOCs and halogens that occurs in the Arctic atmosphere. The VOC chemistry in the model fo-cused primarily on oxidation chemistry of n-butane, isobu-tane, propane, and their oxidation products. The halogen atom concentrations were varied within the model by cre-ating inputs of Br2, BrCl and Cl2, to specifically examine
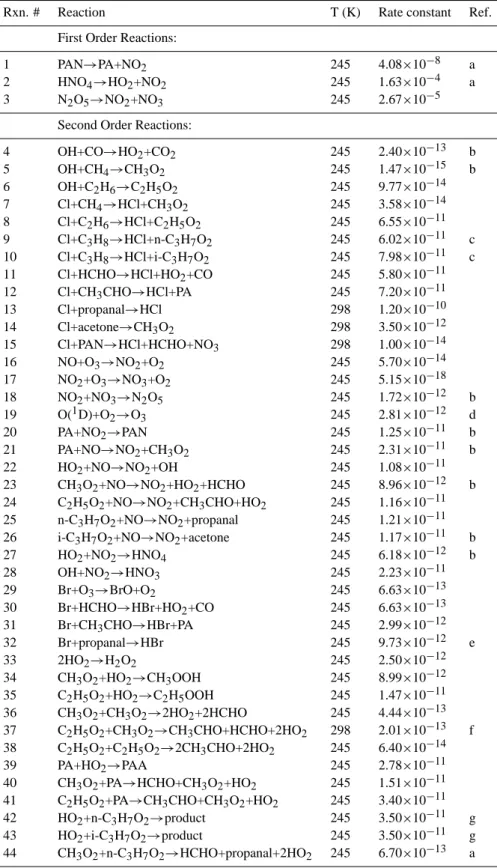
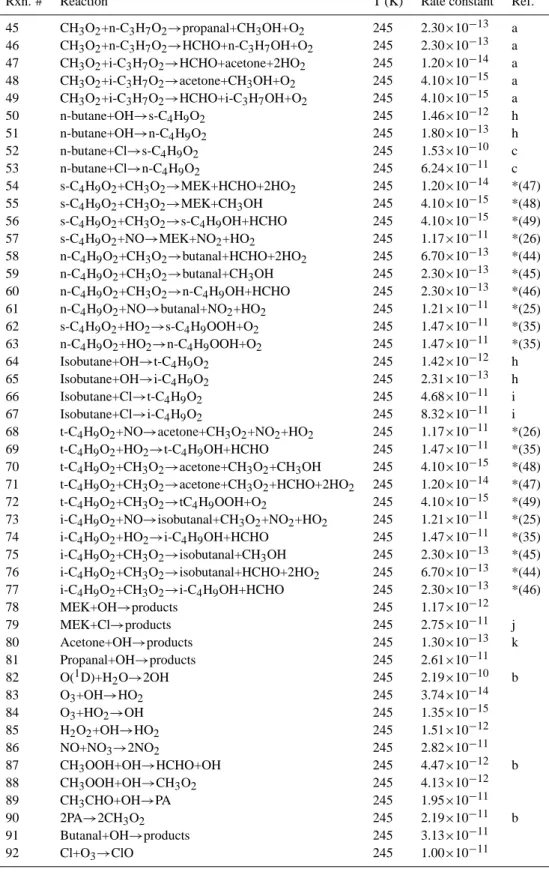
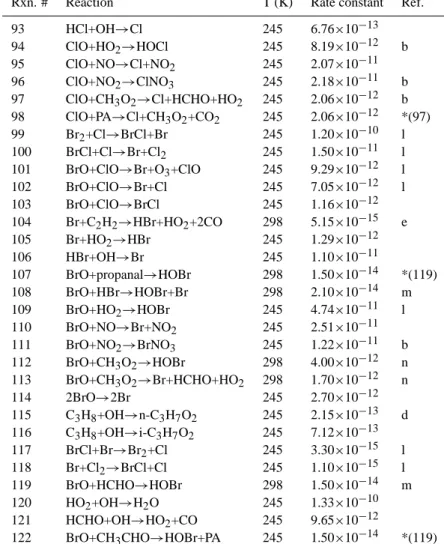
how halogens affect the [MEK]/[n-butane], [isobutane]/[n-butane] and [acetone]/[propanal] ratios, and to use the mea-sured VOC ratios to estimate the relative importance of [Br] and [Cl]. Table 1 shows the 122 gas-phase reactions that were included in the model, as well as their rate constants.
When possible, rate constants were calculated for a ture of 245 K, as this was a representative ambient tempera-ture during the field study.
Table 2 shows the various species that had varying in-put and/or removal fluxes in the model. These fluxes were represented by using a rate constant for a reaction that ei-ther produces the species from a dummy source or removes the species via a first order loss process. Removal rates for species that undergo dry deposition were all set at an equiv-alent first order rate constant of 1.25×10⁻⁵s−1, correspond-ing to a dry deposition velocity, Vd, of 0.5 cm/s and a
bound-ary layer height of 400 m, based on aircraft observations in the Arctic (Leaitch et al., 1994). The effective deposition rate constants (expressed as negative values) are shown in Table 2.
Surface source fluxes of HONO, NOx and acetone have
been measured, and they are believed to be produced pho-tochemically. A zero-order rate constant for each flux was obtained by dividing the measured flux value by the assumed height of the boundary layer (400 m). This rate constant was then scaled by the solar zenith angle calculated within the model. These fluxes were initially entered into the model at the maximum values that have been previously measured for local solar noon (Zhou et al., 2001; Beine et al., 2002; Guimbaud et al., 2002). Some minor adjustment of these val-ues was necessary to obtain concentrations of HONO, NOx
and acetone that corresponded with observations. Although a propanal flux has not been measured in the Arctic to date, this flux was found to be necessary to correctly simulate the observed propanal concentrations, as discussed below. In ad-dition, OH values were scaled by the solar zenith angle so that the daytime average OH concentration for each model day was 5×10⁵molec/cm3.
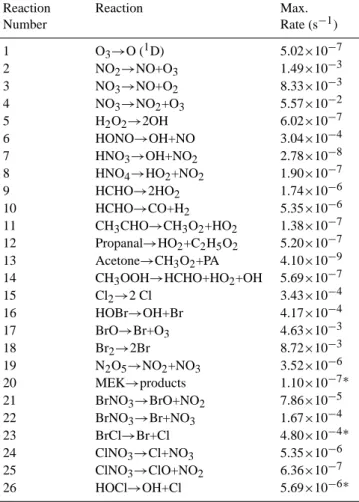
Twenty six photolysis reactions were included in this model, as listed in Table 3. The majority of the photoly-sis rates were determined using the Tropospheric Ultraviolet-Visible Model (TUV) (Madronich and Flocke, 1998) for 29 March 1995 at Alert. This model was not able to calculate photolysis rates for MEK, BrCl and HOCl. The MEK pho-tolysis rate coefficient was calculated as described in Jenkin et al. (1997), and BrCl and HOCl photolysis rate coefficients were calculated using the following equation:
J = Z λ
8(λ)σ (λ)Iλdλ (1)
where 8 is the quantum yield (assumed to be unity), σ is the absorption cross-section (DeMore et al., 1997) and I is the actinic flux (values are from the TUV model). Photolysis rates within the model varied with the solar zenith angle, as calculated for conditions at Alert on 29 March 1995. The noontime minimum solar zenith angle was 79◦.
Table 4 shows the initial concentrations of the species in the model that began with a concentration other than zero. The concentrations of the species in bold were held constant
Table 1. 0-D Model mechanism.
Rxn. # Reaction T (K) Rate constant Ref.
First Order Reactions:
1 PAN→PA+NO2 245 4.08×10⁻⁸ a
2 HNO4→HO2+NO2 245 1.63×10⁻⁴ a
3 N2O5→NO2+NO3 245 2.67×10⁻⁵
Second Order Reactions:
4 OH+CO→HO2+CO2 245 2.40×10⁻¹³ b 5 OH+CH4→CH3O2 245 1.47×10⁻¹⁵ b 6 OH+C2H6→C2H5O2 245 9.77×10⁻¹⁴ 7 Cl+CH4→HCl+CH3O2 245 3.58×10⁻¹⁴ 8 Cl+C2H6→HCl+C2H5O2 245 6.55×10⁻¹¹ 9 Cl+C3H8→HCl+n-C3H7O2 245 6.02×10⁻¹¹ c 10 Cl+C3H8→HCl+i-C3H7O2 245 7.98×10⁻¹¹ c 11 Cl+HCHO→HCl+HO2+CO 245 5.80×10⁻¹¹ 12 Cl+CH3CHO→HCl+PA 245 7.20×10⁻¹¹ 13 Cl+propanal→HCl 298 1.20×10⁻¹⁰ 14 Cl+acetone→CH3O2 298 3.50×10⁻¹² 15 Cl+PAN→HCl+HCHO+NO3 298 1.00×10⁻¹⁴ 16 NO+O3→NO2+O2 245 5.70×10⁻¹⁴ 17 NO2+O3→NO3+O2 245 5.15×10⁻¹⁸ 18 NO2+NO3→N2O5 245 1.72×10⁻¹² b 19 O(1D)+O2→O3 245 2.81×10⁻¹² d 20 PA+NO2→PAN 245 1.25×10⁻¹¹ b 21 PA+NO→NO2+CH3O2 245 2.31×10⁻¹¹ b 22 HO2+NO→NO2+OH 245 1.08×10⁻¹¹
23 CH3O2+NO→NO2+HO2+HCHO 245 8.96×10⁻¹² b
24 C2H5O2+NO→NO2+CH3CHO+HO2 245 1.16×10⁻¹¹
25 n-C3H7O2+NO→NO2+propanal 245 1.21×10⁻¹¹
26 i-C3H7O2+NO→NO2+acetone 245 1.17×10⁻¹¹ b
27 HO2+NO2→HNO4 245 6.18×10⁻¹² b 28 OH+NO2→HNO3 245 2.23×10⁻¹¹ 29 Br+O3→BrO+O2 245 6.63×10⁻¹³ 30 Br+HCHO→HBr+HO2+CO 245 6.63×10⁻¹³ 31 Br+CH3CHO→HBr+PA 245 2.99×10⁻¹² 32 Br+propanal→HBr 245 9.73×10⁻¹² e 33 2HO2→H2O2 245 2.50×10⁻¹² 34 CH3O2+HO2→CH3OOH 245 8.99×10⁻¹² 35 C2H5O2+HO2→C2H5OOH 245 1.47×10⁻¹¹ 36 CH3O2+CH3O2→2HO2+2HCHO 245 4.44×10⁻¹³ 37 C2H5O2+CH3O2→CH3CHO+HCHO+2HO2 298 2.01×10⁻¹³ f 38 C2H5O2+C2H5O2→2CH3CHO+2HO2 245 6.40×10⁻¹⁴ 39 PA+HO2→PAA 245 2.78×10⁻¹¹ 40 CH3O2+PA→HCHO+CH3O2+HO2 245 1.51×10⁻¹¹
41 C2H5O2+PA→CH3CHO+CH3O2+HO2 245 3.40×10⁻¹¹
42 HO2+n-C3H7O2→product 245 3.50×10⁻¹¹ g
43 HO2+i-C3H7O2→product 245 3.50×10⁻¹¹ g
Table 1. Continued.
Rxn. # Reaction T (K) Rate constant Ref.
45 CH3O2+n-C3H7O2→propanal+CH3OH+O2 245 2.30×10⁻¹³ a
46 CH3O2+n-C3H7O2→HCHO+n-C3H7OH+O2 245 2.30×10⁻¹³ a
47 CH3O2+i-C3H7O2→HCHO+acetone+2HO2 245 1.20×10⁻¹⁴ a
48 CH3O2+i-C3H7O2→acetone+CH3OH+O2 245 4.10×10⁻¹⁵ a
49 CH3O2+i-C3H7O2→HCHO+i-C3H7OH+O2 245 4.10×10⁻¹⁵ a
50 n-butane+OH→s-C4H9O2 245 1.46×10⁻¹² h 51 n-butane+OH→n-C4H9O2 245 1.80×10⁻¹³ h 52 n-butane+Cl→s-C4H9O2 245 1.53×10⁻¹⁰ c 53 n-butane+Cl→n-C4H9O2 245 6.24×10⁻¹¹ c 54 s-C4H9O2+CH3O2→MEK+HCHO+2HO2 245 1.20×10−14 *(47) 55 s-C4H9O2+CH3O2→MEK+CH3OH 245 4.10×10−15 *(48) 56 s-C4H9O2+CH3O2→s-C4H9OH+HCHO 245 4.10×10−15 *(49) 57 s-C4H9O2+NO→MEK+NO2+HO2 245 1.17×10−11 *(26) 58 n-C4H9O2+CH3O2→butanal+HCHO+2HO2 245 6.70×10−13 *(44) 59 n-C4H9O2+CH3O2→butanal+CH3OH 245 2.30×10−13 *(45) 60 n-C4H9O2+CH3O2→n-C4H9OH+HCHO 245 2.30×10−13 *(46) 61 n-C4H9O2+NO→butanal+NO2+HO2 245 1.21×10−11 *(25) 62 s-C4H9O2+HO2→s-C4H9OOH+O2 245 1.47×10−11 *(35) 63 n-C4H9O2+HO2→n-C4H9OOH+O2 245 1.47×10−11 *(35) 64 Isobutane+OH→t-C4H9O2 245 1.42×10⁻¹² h 65 Isobutane+OH→i-C4H9O2 245 2.31×10⁻¹³ h 66 Isobutane+Cl→t-C4H9O2 245 4.68×10⁻¹¹ i 67 Isobutane+Cl→i-C4H9O2 245 8.32×10⁻¹¹ i
68 t-C4H9O2+NO→acetone+CH3O2+NO2+HO2 245 1.17×10−11 *(26)
69 t-C4H9O2+HO2→t-C4H9OH+HCHO 245 1.47×10−11 *(35)
70 t-C4H9O2+CH3O2→acetone+CH3O2+CH3OH 245 4.10×10−15 *(48)
71 t-C4H9O2+CH3O2→acetone+CH3O2+HCHO+2HO2 245 1.20×10−14 *(47)
72 t-C4H9O2+CH3O2→tC4H9OOH+O2 245 4.10×10−15 *(49)
73 i-C4H9O2+NO→isobutanal+CH3O2+NO2+HO2 245 1.21×10−11 *(25)
74 i-C4H9O2+HO2→i-C4H9OH+HCHO 245 1.47×10−11 *(35)
75 i-C4H9O2+CH3O2→isobutanal+CH3OH 245 2.30×10−13 *(45)
76 i-C4H9O2+CH3O2→isobutanal+HCHO+2HO2 245 6.70×10−13 *(44)
77 i-C4H9O2+CH3O2→i-C4H9OH+HCHO 245 2.30×10−13 *(46)
78 MEK+OH→products 245 1.17×10⁻¹² 79 MEK+Cl→products 245 2.75×10⁻¹¹ j 80 Acetone+OH→products 245 1.30×10⁻¹³ k 81 Propanal+OH→products 245 2.61×10⁻¹¹ 82 O(1D)+H2O→2OH 245 2.19×10⁻¹⁰ b 83 O3+OH→HO2 245 3.74×10⁻¹⁴ 84 O3+HO2→OH 245 1.35×10⁻¹⁵ 85 H2O2+OH→HO2 245 1.51×10⁻¹² 86 NO+NO3→2NO2 245 2.82×10⁻¹¹ 87 CH3OOH+OH→HCHO+OH 245 4.47×10⁻¹² b 88 CH3OOH+OH→CH3O2 245 4.13×10⁻¹² 89 CH3CHO+OH→PA 245 1.95×10⁻¹¹ 90 2PA→2CH3O2 245 2.19×10⁻¹¹ b 91 Butanal+OH→products 245 3.13×10⁻¹¹ 92 Cl+O3→ClO 245 1.00×10⁻¹¹
Table 1. Continued.
Rxn. # Reaction T (K) Rate constant Ref.
93 HCl+OH→Cl 245 6.76×10⁻¹³ 94 ClO+HO2→HOCl 245 8.19×10⁻¹² b 95 ClO+NO→Cl+NO2 245 2.07×10⁻¹¹ 96 ClO+NO2→ClNO3 245 2.18×10⁻¹¹ b 97 ClO+CH3O2→Cl+HCHO+HO2 245 2.06×10⁻¹² b 98 ClO+PA→Cl+CH3O2+CO2 245 2.06×10−12 *(97) 99 Br2+Cl→BrCl+Br 245 1.20×10⁻¹⁰ l 100 BrCl+Cl→Br+Cl2 245 1.50×10⁻¹¹ l 101 BrO+ClO→Br+O3+ClO 245 9.29×10⁻¹² l 102 BrO+ClO→Br+Cl 245 7.05×10⁻¹² l 103 BrO+ClO→BrCl 245 1.16×10⁻¹² 104 Br+C2H2→HBr+HO2+2CO 298 5.15×10⁻¹⁵ e 105 Br+HO2→HBr 245 1.29×10⁻¹² 106 HBr+OH→Br 245 1.10×10⁻¹¹ 107 BrO+propanal→HOBr 298 1.50×10−14 *(119) 108 BrO+HBr→HOBr+Br 298 2.10×10⁻¹⁴ m 109 BrO+HO2→HOBr 245 4.74×10⁻¹¹ l 110 BrO+NO→Br+NO2 245 2.51×10⁻¹¹ 111 BrO+NO2→BrNO3 245 1.22×10⁻¹¹ b 112 BrO+CH3O2→HOBr 298 4.00×10⁻¹² n 113 BrO+CH3O2→Br+HCHO+HO2 298 1.70×10⁻¹² n 114 2BrO→2Br 245 2.70×10⁻¹² 115 C3H8+OH→n-C3H7O2 245 2.15×10⁻¹³ d 116 C3H8+OH→i-C3H7O2 245 7.12×10⁻¹³ 117 BrCl+Br→Br2+Cl 245 3.30×10⁻¹⁵ l 118 Br+Cl2→BrCl+Cl 245 1.10×10⁻¹⁵ l 119 BrO+HCHO→HOBr 298 1.50×10⁻¹⁴ m 120 HO2+OH→H2O 245 1.33×10⁻¹⁰ 121 HCHO+OH→HO2+CO 245 9.65×10⁻¹² 122 BrO+CH3CHO→HOBr+PA 245 1.50×10−14 *(119)
First- and second-order rate constants are in units of s−1and cm3molec−1s−1, respectively.
All rate constant values from Atkinson et al. (2001) unless otherwise noted: aLightfoot et al., 1992,bDeMore et al., 1997,c Tyndall et
al., 1997,dAtkinson et al., 1989,eWallington et al., 1989,fVillenave and Lesclaux, 1996,gJenkin et al., 1997,hDonahue et al., 1998
(branching ratios from Atkinson (1986)),iHooshiyar and Niki, 1995 (branching ratios from Cadman et al. (1976)),jCuevas et al., 2004,k
Wollenhaupt et al., 2000,lSander and Crutzen, 1996,mHansen et al., 1999,nAranda et al., 1997
* indicates estimated rate constant, with reaction number used for estimate in parenthesis
throughout the simulations. The value for water represents 80% relative humidity at the model temperature, the value for ozone is equal to the average ozone concentration at Alert during ambient sampling, and many of the other values are either based on measurements or other models (Michalowski et al., 2000; Grannas et al., 2002).
3 Results and discussion
3.1 Ambient measurements
Figure 1 shows the measured ambient concentrations of MEK, isobutane, n-butane, propanal, acetone and ozone dur-ing the field campaign. In this paper, we focus on four case study ozone depletion events from PSE95, indicated in the figure with the numbers 1 through 4. These events were cho-sen for further analysis because all of the VOCs of interest were present above their respective detection limits through-out each event. It is clear from this figure that isobutane
Table 2. Fluxes included in 0-D model.
Flux number Species Radiation
de-pendent
Maximum Value Source
1 Br2 No Various *
2 BrCl No Various *
3 Cl2 No Various *
4 HOBr No −1.25×10⁻⁵s−1 Michalowski et al. (2000)
5 HOCl No −1.25×10⁻⁵s−1 Michalowski et al. (2000)
6 HBr No −1.25×10⁻⁵s−1 Michalowski et al. (2000)
7 HCl No −1.25×10⁻⁵s−1 Michalowski et al. (2000)
8 N2O5 No −1.25×10⁻⁵s−1 Michalowski et al. (2000)
9 HONO No −1.25×10⁻⁵s−1 Michalowski et al. (2000)
10 HNO4 No −1.25×10⁻⁵s−1 Michalowski et al. (2000)
11 HONO Yes 2.95×10⁵molec/cm3s Zhou et al. (2001)
12 NOx Yes 1.10×10⁶molec/cm3s Beine et al. (2002)
13 acetone Yes 1.85×10⁴molec/cm3s Guimbaud et al. (2002)
14 propanal Yes 5.89×10⁴molec/cm3s# *
*Source determined empirically from model results
#This flux is not always present, as discussed in the text
Fig. 1. Ambient concentrations of methyl ethyl ketone, isobutane,
n-butane, acetone, propanal and ozone during PSE95. Ozone de-pletion events of interest, as discussed in the text, are labeled with numbers 1 through 4.
and n-butane are typically well correlated, which is consis-tent with their common petroleum fuel source and common radical reaction sinks. Figure 1 also shows a very signifi-cant negative correlation between ozone and the VOC
oxi-Fig. 2. Ambient measurements of [MEK]/[n-butane],
[isobutane]/[n-butane], [acetone]/[propanal] and [ozone]
dur-ing PSE95. Ozone depletion events of interest, as discussed in the text, are labeled with numbers 1 through 4.
dation products acetone and MEK. Figure 2 shows the re-sults of the oxidation chemistry more clearly, in which the ratios [isobutane]/[n-butane], [MEK]/[n-butane] and
[ace-Table 3. Photolysis reactions included in the 0-D model. Reaction Number Reaction Max. Rate (s−1) 1 O3→O (1D) 5.02×10⁻⁷ 2 NO2→NO+O3 1.49×10⁻³ 3 NO3→NO+O2 8.33×10⁻³ 4 NO3→NO2+O3 5.57×10⁻² 5 H2O2→2OH 6.02×10⁻⁷ 6 HONO→OH+NO 3.04×10⁻⁴ 7 HNO3→OH+NO2 2.78×10⁻⁸ 8 HNO4→HO2+NO2 1.90×10⁻⁷ 9 HCHO→2HO2 1.74×10⁻⁶ 10 HCHO→CO+H2 5.35×10⁻⁶ 11 CH3CHO→CH3O2+HO2 1.38×10⁻⁷ 12 Propanal→HO2+C2H5O2 5.20×10⁻⁷ 13 Acetone→CH3O2+PA 4.10×10⁻⁹ 14 CH3OOH→HCHO+HO2+OH 5.69×10⁻⁷ 15 Cl2→2 Cl 3.43×10⁻⁴ 16 HOBr→OH+Br 4.17×10⁻⁴ 17 BrO→Br+O3 4.63×10⁻³ 18 Br2→2Br 8.72×10⁻³ 19 N2O5→NO2+NO3 3.52×10⁻⁶ 20 MEK→products 1.10×10−7∗ 21 BrNO3→BrO+NO2 7.86×10⁻⁵ 22 BrNO3→Br+NO3 1.67×10⁻⁴ 23 BrCl→Br+Cl 4.80×10−4∗ 24 ClNO3→Cl+NO3 5.35×10⁻⁶ 25 ClNO3→ClO+NO2 6.36×10⁻⁷ 26 HOCl→OH+Cl 5.69×10⁻⁶∗
All photolysis calculations are for Alert, Canada on 29 March 1995 Unless otherwise noted, photolysis rate was calculated using the TUV model, Version 4.3
∗Photolysis rate calculated as discussed in the text
tone]/[propanal] are plotted, along with ambient ozone con-centrations. When viewed in this manner it can be seen that all three of the VOC ratios appear to be inversely correlated with ozone. As discussed above, this can only imply halogen chemistry, which not only causes ozone depletion, but also has a dramatic effect on the ratios of various VOCs that are present in the Arctic troposphere, and in ways that depend on the ratio [Br]/[Cl], as will be shown.
In Fig. 3 the VOC ratios [MEK]/[n-butane] and [isobutane]/[n-butane] are plotted against [ace-tone]/[propanal] for the four different ozone depletion events of interest. As discussed in the introduction, the x-axes of this figure are indicative of chlorine atom chemistry, while the y-axis is sensitive to bromine atom chemistry. The fact that Event 4 is enhanced in both [MEK]/[n-butane] and [isobutane]/[n-butane] indicates that there is relatively much more chlorine atom chemistry during that event, while
Table 4. Initial model conditions*.
Species Concentration (molec/cm3) H2O 2.28×10¹⁶ HCHO 6.00×10⁹ CH3CHO 3.00×10⁹ C2H6 4.00×10¹⁰ CH4 5.66×10¹³ O3 6.60×10¹¹ C3H8 1.00×10¹⁰ propanal 7.80×10⁸ PAN 1.20×10¹⁰ n-butane 2.65×10⁹ isobutane 1.30×10⁹ C2H2 2.20×10⁹ HONO 1.50×10⁸ Acetone 1.40×10¹⁰ CO 3.00×10¹² HNO4 1.00×10⁸ NO2 7.50×10⁷ MEK 3.30×10⁸
*Species in bold are held constant in the model
Fig. 3. Ambient [MEK]/[n-butane] (A) and [isobutane]/[n-butane] (B) vs. [acetone]/[propanal] during PSE95 for the four ozone
deple-tion events indicated in Figs. 1 and 2. Solid lines represent simple linear regressions.
Events 1 through 3 all appear to be dominated by bromine chemistry. The data in this figure imply that ozone depletion can occur with highly varying concentrations of Br and Cl atoms.
3.2 Evidence of chlorine atom chemistry
MEK production from n-butane oxidation by OH or Cl and the subsequent removal of MEK by reaction with OH or Cl represents a consecutive reaction scheme. This type of sys-tem can be solved mathematically to calculate the impact
of oxidizer concentration on the enhancement of [MEK]/[n-butane], using the equation below for consecutive reactions (Apel et al., 2002): [MEK] [ n-butane] = α · k1(1 − e(k1−k2)[X]t)) k2−k1 (2) where α is the yield of MEK from n-butane oxidation (α=0.83 when X=OH, and α=0.66 when X=Cl), k1 is the
rate constant for reaction of n-butane with X, k2 is the rate
constant for reaction of MEK with X, and [X] is the average concentration of either OH or Cl over the reaction time, t , in seconds. Using a reaction time of five to ten days (Job-son et al., 1994), [MEK]/[n-butane] can be calculated, and the resulting values range from 0.28 to 0.58 when X is OH ([X]=5×10⁵molec/cm3), and from 1.57 to 6.23 when X is
Cl ([X]=2×10⁴molec/cm3). When both oxidants are present
at the concentrations listed above (i.e. typical concentrations for ozone depletion conditions, Jobson et al., 1994; Boudries and Bottenheim, 2000; Grannas et al., 2002; Ridley et al., 2003), chlorine atoms are responsible for more than 85% of the change in the MEK/n-butane ratio. Thus we believe that most of the alkane processing during ozone depletion events occurs via Cl atom reaction.
3.3 Evidence of bromine atom chemistry
As discussed above, the ratio [acetone]/[propanal] is sensi-tive to [Br]. However, the dependence is complex. Bromine atom reaction with propane is endothermic by ∼46 kJ/mole (Tsang, 1996), so only chlorine and OH radicals can com-plete the first step (Reaction R10) of the consecutive reaction mechanism shown below. Additionally, only chlorine and OH will oxidize acetone in Reaction (R11). However, in Re-action (R12), propanal can be oxidized by OH, Br and Cl.
C3H8+(OH · and/or Cl·) → acetone + propanal (R10)
Acetone + (OH · and/or Cl·) → products (R11) Propanal + (OH · and/orCl · and/or Br·) → products (R12) Consider the case where all three oxidizers are present in the atmosphere. By multiplying the rate constants for each reaction (which can be found in Table 1) by typical con-centrations of the oxidants during halogen atom chemistry events ([OH]=5×10⁵molec/cm3, [Cl]=2×10⁴molec/cm3 and [Br]=1×10⁷molec/cm3 (Jobson et al., 1994)) the con-tribution of each oxidizer to the removal rate of acetone and propanal can be calculated. For this condition, 86% of the propanal is destroyed by bromine, while 12% is destroyed by OH and only 2% by Cl. 52% of the acetone destruc-tion is caused by Cl, and 48% by OH. However, the re-moval of acetone by Cl and OH occurs much more slowly (τacetone∼86 days) than that of propanal (τpropanal∼2.5 h),
and indeed is not important on the timescale of the events
Fig. 4. Model results of [MEK]/[n-butane] (A) and
[isobutane]/[n-butane] (B) vs. [acetone]/
[propanal] for various [Br]/[Cl] when no propanal flux is present are compared to the ambient data shown in Fig. 3. All model results are daytime averages over a time period of ten days, and reported [Br]/[Cl] is the daytime average for model Day 9.
discussed here. Hence the variation in the ratio [ace-tone]/[propanal] is mostly determined by Br under these con-ditions. We note that the model reaction 107 may not oc-cur (Orlando et al., 2000). In any case, model reaction 107 is insignificant relative to model reaction 32 (Br atom re-action with propanal). It is important to note that because there exists a large initial concentration of acetone in the atmosphere before ozone depletion events, acetone produc-tion during ozone depleproduc-tion contributes relatively little to changes in [acetone]/[propanal]. Thus during ozone deple-tion events propanal destrucdeple-tion will be enhanced and [ace-tone]/[propanal] will reflect bromine atom chemistry. 3.4 Model and measurement comparison
Figure 4 shows the results of the model described in Ta-bles 1–4, with no surface flux of propanal present. All concentrations reported from the model represent the aver-age concentration of a given species during the sunlit hours (06:00–20:00 local time). The model was allowed to run for a period of 10 days (Jobson et al., 1994) with various halo-gen atom concentrations, ranging from no halohalo-gens present (all oxidation caused by OH) to a maximum condition of [Br]=4×10⁷ and [Cl]=2×10⁴molec/cm3 ([Br]/[Cl]=2000). In every case except the “OH only” case, the flux of Cl2
and/or BrCl was adjusted to achieve a Day 9 daytime av-erage [Cl] of 2×10⁴molec/cm3, and the Br2flux was varied
in order to achieve the [Br]/[Cl] ratio desired. The range of [Br]/[Cl] examined is representative of the various halogen atom ratio estimates that have been made in the Arctic dur-ing ozone depletion events (Jobson et al., 1994; Ramacher et al., 1999; Keil and Shepson, 2006; Simpson et al., 2007). The solid lines are created from daytime averages of the var-ious species. The individual points on the plot are the same ambient data from PSE95 that are shown in Fig. 3.
Fig. 5. Model results of [MEK]/[n-butane] (A) and
[isobutane]/[n-butane] (B) vs. [acetone]/[propanal] for various [Br]/[Cl] when a radiation-dependent propanal flux is present are compared to the ambient data shown in Fig. 3. All model results are daytime aver-ages over a time period of ten days, and reported [Br]/[Cl] is the daytime average for model Day 9.
While the ambient data and the model results seem to be in the same range when considering [MEK]/[butane] and [isobutane]/[n-butane], e.g. for the case with chlorine atom chemistry only ([Br]/[Cl]=0, [Cl]=2×10⁴molec/cm3), the model overestimates [acetone]/[propanal] by orders of mag-nitude. This is likely due to a missing source of propanal, potentially from the snowpack. Because acetone is so long lived, and the model simulation starts with 600 ppt of ace-tone, the model does not overestimate [acetone], nor is this ratio sensitive to acetone chemistry. Formaldehyde, acetalde-hyde and acetone fluxes have all been measured from the snowpack (Guimbaud et al., 2002; Sumner et al., 2002; Grannas et al., 2004) so it is reasonable to assume that there could be a flux of propanal from the snowpack as well.
Figure 5 shows the results of the model, along with the PSE95 ambient data from Fig. 3, when a radiation-dependent flux of propanal has been added to the model. The magni-tude of this flux was adjusted so that the Day 9 average value of [acetone]/[propanal] for the case where [Br]/[Cl]=500 was approximately 80. This flux was then included in the model for all of the other cases shown in the figure, set proportional to calculated radiation. Including this flux greatly increases the agreement between the model and the ambient data, as shown in comparing Figs. 4 and 5. If the height of the Arctic boundary layer is assumed to be 400 m, as discussed earlier, the daytime maximum flux of propanal that is necessary to correctly simulate the VOC ratios measured is calculated to be 2.4×10⁹molec/cm2s. The magnitude of this flux is on the high end compared to the magnitude of measured fluxes for the other oxygenated VOC fluxes that have been measured in the Arctic, namely formaldehyde (4.90×10⁹molec/cm2s) (Sumner and Shep-son, 1999), acetaldehyde (4.20×10⁸molec/cm2s) and ace-tone (6.20×10⁸molec/cm2s) (Guimbaud et al., 2002). This
likely results from the fact that a volumetric flux correspond-ing to a 400 m deep boundary layer is becorrespond-ing used in this calculation. Given the reactivity of propanal, it likely has a very steep vertical concentration gradient. From the work of Guimbaud et al. (2002), we can calculate the effective mix-ing height for propanal, given its lifetime. For [Br]/[Cl]=500, i.e. [Cl]=2×10⁴, [Br]=1×10⁷and [OH]=5×10⁵molec/cm3, the propanal lifetime τ is 2.5 h. The effective mixing height,
Z (using Kz(eddy diffusivity) = 95 cm2/s (Guimbaud et al.,
2002)) is then
Zpropanal=
p
KZτ = 9.2 m (3) Thus, at solar noon, the appropriate maximum propanal flux (using this value as the effective mixing height), for the pur-pose of comparing to previously measured carbonyl com-pound fluxes, is on the order of 5.4×10⁷molec/cm2s. This value is more reasonable, given the relative observed concen-trations of acetaldehyde and propanal at Alert. It is clear that improving our knowledge of this flux will require ambient flux and vertical profile measurements for propanal.
It can be seen from Fig. 5 that [Br]/[Cl] can vary greatly during ozone depletion events, from ∼100 to ∼2000. This range of [Br]/[Cl] is consistent with the previous work of Jobson et al. (1994), Impey et al. (1997), Ramacher et al. (1999) and Keil and Shepson (2006). While Events 1– 3 appear to be relatively dominated by bromine chemistry, Event 4 is clearly quite different, exhibiting much more chlo-rine atom chemistry. Comparing the slopes of the model out-put with the data at low VOC ratios, the ambient [Br]/[Cl] ratios seem to be on the order of 500–800, 800–2000, 800– 2000, and 100–200 for Events 1–4, respectively. Evans et al. (2003) discuss that in their model chlorine becomes less active as an oxidant as ozone becomes more depleted, and that chlorine chemistry becomes totally inactive when ozone drops below 10 ppb. This occurs because as the “bromine explosion” chemistry proceeds, aerosol and snowpack salt crystal surfaces become enriched in Br−, effectively slow-ing the relative rate of oxidation of Cl− by HOBr. This is consistent with the measurements of Simpson et al. (2005), who find the snowpack to be relatively enriched in Br− as one moves inland away from the sea salt aerosol source, due to the longer lifetime of the fine aerosol Br− (and bromine-containing gases such as HBr and HOBr). In other words, deposition of the products of halogen-chemistry processed air tends to enrich the surface in Br−. The work of
Toom-Sauntry and Barrie (2002) shows clearly that as the spring season progresses, the snowfall at Alert becomes progres-sively more enriched in Br− relative to Cl−. Indeed, by May, bromide enrichment factors (relative to fresh sea salt) were as high as ∼70. It was also postulated that this results in part from uptake of gas phase bromine species, such as HBr and HOBr . In addition, the reaction of the excess Br− with any BrCl that is produced yields Br2Cl−, which can
03/25 03/24 03/23 04/13 04/12 04/11 03/29 03/28 03/27 M e ter s AG L M e ter s AG L Sou rc e Sou rc e at 8 2 .50 N 6 2 .30 W at 8 2 .50 N 6 2 .30 W 500 250 500250 500 250 500 500250 1000 1500 500 1000 1500 500 1000 1500 500 1000 1500
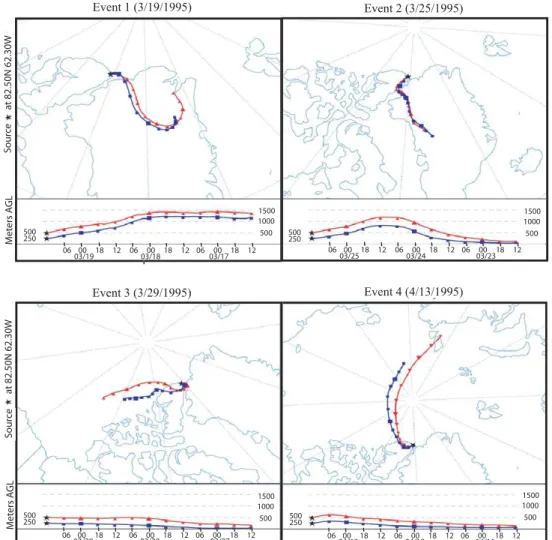
Fig. 6. 72 h HYSPLIT back trajectories are presented for each of the four ozone depletion events of interest during PSE95.
BrCl into the atmosphere (this assumes that BrCl photoly-sis is the primary source of Cl atoms). Impey et al. (1997, 1999) observed that photolyzable chlorine became relatively unimportant later in the spring, and under conditions when ozone is completely depleted. This is consistent with the snowfall and snowpack surfaces becoming enriched in Br− as spring progresses. While it might be supposed that BrO (and thus HOBr) is required for BrCl production, for Event 4 ozone decreases to ∼3 ppb, comparable to that for Event 2, for which we estimate a [Br]/[Cl] ratio that is ∼10–20 times larger. There are likely several explanations for this variabil-ity of [Br]/[Cl]. However, the relative importance of chlorine and bromine chemistry is most likely a function of the rel-ative concentrations of the two halide ions on the reactive surfaces.
Since Event 4 is different from the other events exam-ined here, it is important to understand what conditions may have led to the exhibited chemistry in that case. It is clear that a potential source of [Br]/[Cl] variability is the air mass origin during the event. In Fig. 6, 72-h back trajectories
are shown for the four ozone depletion events. These tra-jectories were produced using the HYSPLIT model (http: //www.arl.noaa.gov/ready). The air masses that contributed to Events 1 and 2 both arrived having spent most of the pre-vious 72 h over Greenland, while Event 3 began over the ice and then passed over Ellesmere Island before reaching the sampling site. The back trajectory for Event 4, however, is different from the others in that the air mass spent most of the time over the ice pack in the Arctic Ocean, with a rela-tively longer trajectory. Assuming that the halogens are ac-tivated by reaction of HOBr with Br− and Cl−, the relative
concentrations of Br2and BrCl (and thus [Br] and [Cl]) will
depend on the relative concentrations of Br−and Cl−in the snowpack, along with other factors such as the relative ice solubilities of the two molecular halogens. As discussed by Simpson et al. (2005), there is substantial variation of snow-pack [Br−]/[Cl−], and this tends to increase with distance from the coast. This reflects the idea that with Arctic Ocean trajectories, fresh sea salt aerosol deposits relatively quickly leading to low ratios of [Br−]/[Cl−] near the coast. It is thus
plausible that the conditions leading to Event 4 led to fresh inputs (from air passing over first year sea ice, or polynyas), and an increased probability of activation of Cl−. In contrast,
air masses that came to the sampling site over areas that are predominantly land (Events 1–3) show evidence of enhanced [Br]/[Cl], due to activation within Br−enriched snowpacks. Thus, it would seem that the relative activation rates of chlo-rine and bromine reflect the chemical “age” of the snowpack, and the extent to which there have been fresh inputs of un-processed sea salt.
4 Conclusions
From the ambient data presented here, and from the model results that are discussed, there are a few conclusions that can be drawn. First, there is reason to believe that there may be a source of propanal that has not yet been measured in the Arctic. This additional source is necessary to correctly simu-late the VOC chemistry that occurs during Polar Spring, and it is reasonable to postulate that the missing propanal source is oxidation of organic matter in the snowpack (Grannas et al., 2004), given measurements of snowpack photochemi-cal sources of other oxygenated VOCs. It is unlikely that it is an unknown atmospheric source, as this would proba-bly require decomposition of a large alkoxy radical to pro-duce the propyl radical, but such a precursor would be short lived, making substantial concentrations unlikely. Ambient measurements of this propanal flux are needed to verify this conclusion. Second, the ratio of bromine to chlorine atoms appears to be highly variable during ozone depletion events, as seen from the variability in ratios of the alkanes and their oxidation products that are affected by these halogens. Much of this variability for coastal sites may derive from the air mass origin, and the extent of halide processing in the as-sociated snowpacks along the air mass trajectories. Further understanding of the behavior of halogen atoms in the Arc-tic is very important, as they are thought to be responsible for the springtime ozone and mercury depletion events that have been observed (Schroeder et al., 1998), but the acti-vation mechanisms are not fully understood. For example, Knipping and Dabdub (2002) discuss that Cl−may be acti-vated by OH radicals in sea salt particles. It is well known that H2O2is an important photolytic precursor for condensed
phase OH radicals (Anastasio and Jordan, 2004). Cl2 can
then be produced from the following reactions:
OH + Cl−→ClOH− (R13)
2ClOH−→Cl2+2OH− (R14)
Thus, the high apparent [Cl] during Event 4 could be related to poorly understood snowpack photochemical activation of Cl−. It is clear that further laboratory studies should be con-ducted to examine the extent to which halogen activation can occur via OH radical chemistry in the condensed phase. This
may help explain the existence of low [Br]/[Cl] ratios when ozone is low.
Acknowledgements. The authors would like to acknowledge the Jonathan Amy Facility for Chemical Instrumentation at Purdue University for instrumentation support and K. Anlauf for the use of AES/GAW ozone data for PSE95. This work was funded by the National Science Foundation, grant No. OPP-0325361. This is publication No. 0621 of the Purdue Climate Change Research Center.
Edited by: M. van Roozendael
References
Anastasio, C. and Jordan, A. L.: Photoformation of hydroxyl radical and hydrogen peroxide in aerosol particles from Alert, Nunavut: implications for aerosol and snowpack chemistry in the Arctic, Atmos. Environ., 38, 1153–1166, 2004.
Apel, E. C., Riemer, D. D., Hills, A., Baugh, W., Orlando, J., Faloona, I., Tan, D., Brune, W., Lamb, B., Westberg, H., Carroll, M. A., Thornberry, T., and Geron, C. D.: Mea-surement and interpretation of isoprene fluxes and isoprene, methacrolein, and methyl vinyl ketone mixing ratios at the PROPHET site during the 1998 Intensive, J. Geophys. Res., 107, 4034, doi:10.1029/2000JD000225, 2002.
Aranda, A., LeBras, G., LaVerdet, G., and Poulet, G.: The
BrO+CH3O2 reaction: Kinetics and role in the atmospheric ozone budget, Geophys. Res. Lett., 24, 2745–2748, 1997. Atkinson, R.: Kinetics and mechanisms of the gas phase reactions
of the hydroxyl radical with organic compounds under atmo-spheric conditions, Chem. Rev., 86, 69–201, 1986.
Atkinson, R., Baulch, D. L., Cox, R. A., Hampson, R. F., Kerr, J. A., and Troe, J.: Evaluated kinetic and photochemical data for atmospheric chemistry .3. IUPAC subcommittee on gas kinetic data evaluation for atmospheric chemistry, J. Phys. Chem. Ref. Data, 18, 881–1097, 1989.
Atkinson, R., Baulch, D. L., Cox, R. A., Hampson, R. F. J., Kerr, J. A., Rossi, M. J., and Troe, J.: Summary of evaluated kinetic and photochemical data for atmospheric chemistry, Web version prepared by Carver, G. D. and Cox, R. A., 2001.
Barrie, L. A., Bottenheim, J. W., Schnell, R. C., Crutzen, P. J., and Rasmussen, R. A.: Ozone destruction and photochemical reac-tions at polar sunrise in the lower Arctic atmosphere, Nature, 334, 138–141, 1988.
Beine, H. J., Honrath, R. E., Domine, F., Simpson, W. R., and Fuentes, J. D.: NOx during background and ozone depletion pe-riods at Alert: Fluxes above the snow surface, J. Geophys. Res., 107, 4584, doi:10.1029/2002JD002082, 2002.
Bottenheim, J. W., Gallant, A. G., and Brice, K. A.: Measurements
of NOy species and O3 at 82◦N latitude, Geophys. Res. Lett.,
13, 113–116, 1986.
Bottenheim, J. W., Fuentes, J. D., Tarasick, D. W., and Anlauf, K. G.: Ozone in the Arctic lower troposphere during winter and spring 2000 (ALERT2000), Atmos. Environ., 36, 2535–2544, 2002.
Boudries, H. and Bottenheim, J. W.: Cl and Br atom concentrations during a surface boundary layer ozone depletion event in the Canadian high Arctic, Geophys. Res. Lett., 27, 517–520, 2000.
Boudries, H., Bottenheim, J. W., Guimbaud, C., Grannas, A. M., Shepson, P. B., Houdier, S., Perrier, S., and Domine, F.: Distri-bution and trends of oxygenated hydrocarbons in the high Arctic derived from measurements in the atmospheric boundary layer and interstitial snow air during the ALERT2000 field campaign, Atmos. Environ., 36, 2573–2583, 2002.
Cadman, P., Kirk, A. W., and Trotmandickenson, A. F.: Reac-tions of chlorine atoms with ethane, propane, isobutane, flu-oroethane, 1,1-difluflu-oroethane, 1,1,1-trifluoroethane and cyclo-proane, J. Chem. Soc.-Faraday Trans. I, 72, 1027–1032, 1976. Cuevas, C. A., Notario, A., Martinez, E., and Albaladejo, J.: A
kinetic study of the reaction of Cl with a series of linear and ram-ified ketones as a function of temperature, Phys. Chem. Chem. Phys., 6, 2230–2236, 2004.
DeMore, W. B., Sander, S. P., Golden, D. M., Hampson, R. F., Kurylo, M. J., Howard, C. J., Ravishankara, A. R., Kolb, C. E., and Molina, M. J.: Chemical kinetics and photochemical data for use in stratospheric modeling, Evaluation number 12, JPL Publi-cation 97-4, 1997.
Donahue, N. M., Anderson, J. G., and Demerjian, K. L.: New rate constants for ten OH alkane reactions from 300 to 400 K: An as-sessment of accuracy, J. Phys. Chem. A, 102, 3121–3126, 1998. Evans, M. J., Jacob, D. J., Atlas, E., Cantrell, C. A., Eisele, F., Flocke, F., Fried, A., Mauldin, R. L., Ridley, B. A., Wert, B., Talbot, R., Blake, D., Heikes, B., Snow, J., Walega, J., Wein-heimer, A. J., and Dibb, J.: Coupled evolution of BrOx-ClOx-HOx-NOx chemistry during bromine-catalyzed ozone depletion events in the Arctic boundary layer, J. Geophys. Res., 108, 8368, doi:10.1029/2002JD002732, 2003.
Fan, S. M. and Jacob, D. J.: Surface ozone depletion in Arctic spring sustained by bromine reactions on aerosols, Nature, 359, 522– 524, 1992.
Galiba, I., Watson, R. A., and Tedder, J. M.: Free radical sub-stitution in aliphatic compounds. Part 5. Halogenation of 1,1,1-trifluoropentane, J. Chem. Soc., 1321–1323, 1964.
Grannas, A. M., Shepson, P. B., Guimbaud, C., Sumner, A. L., Al-bert, M., Simpson, W., Domine, F., Boudries, H., Bottenheim, J., Beine, H. J., Honrath, R., and Zhou, X. L.: A study of photo-chemical and physical processes affecting carbonyl compounds in the Arctic atmospheric boundary layer, Atmos. Environ., 36, 2733–2742, 2002.
Grannas, A. M., Shepson, P. B., and Filley, T. R.: Photochemistry and nature of organic matter in Arctic and Antarctic snow, Global Biogeochem. Cy., 18, GB1006, doi:10.1029/2003GB002133, 2004.
Greenberg, J. P., Helmig, D., and Zimmerman, P. R.: Seasonal mea-surements of nonmethane hydrocarbons and carbon monoxide at the Mauna Loa Observatory during the Mauna Loa Observatory Photochemistry Experiment 2, J. Geophys. Res., 101, 14 581– 14 598, 1996.
Guimbaud, C., Grannas, A. M., Shepson, P. B., Fuentes, J. D., Boudries, H., Bottenheim, J. W., Domine, F., Houdier, S., Perrier, S., Biesenthal, T. B., and Splawn, B. G.: Snowpack processing of acetaldehyde and acetone in the Arctic atmospheric boundary layer, Atmos. Environ., 36, 2743–2752, 2002.
Hansen, J. C., Li, Y. M., Li, Z. J., and Francisco, J. S.: On the mechanism of the BrO plus HBr reaction, Chem. Phys. Lett., 314, 341–346, 1999.
Hausmann, M. and Platt, U.: Spectroscopic Measurement of
Bromine Oxide and Ozone in the High Arctic during Polar Sun-rise Experiment 1992, J. Geophys. Res., 99, 25 399–25 413, 1994.
Hooshiyar, P. A. and Niki, H.: Rate constants for the gas phase reactions of Cl atoms with C2-C8 alkanes at T=296+/−2 K, Int. J. Chem. Kinet., 27, 1197–1206, 1995.
Impey, G. A., Shepson, P. B., Hastie, D. R., Barrie, L. A., and An-lauf, K. G.: Measurements of photolyzable chlorine and bromine during the Polar Sunrise Experiment 1995, J. Geophys. Res., 102, 16 005–16 010, 1997.
Impey, G. A., Mihele, C. M., Anlauf, K. G., Barrie, L. A., Hastie, D. R., and Shepson, P. B.: Measurements of photolyzable halo-gen compounds and bromine radicals during the Polar Sunrise Experiment 1997, J. Atmos. Chem., 34, 21–37, 1999.
Jenkin, M. E., Saunders, S. M., and Pilling, M. J.: The tropospheric degradation of volatile organic compounds: A protocol for mech-anism development, Atmos. Environ., 31, 81–104, 1997. Jobson, B. T., Niki, H., Yokouchi, Y., Bottenheim, J., Hopper, F.,
and Leaitch, R.: Measurements of C2-C6 hydrocarbons during the Polar Sunrise 1992 Experiment – Evidence for Cl atom and Br atom chemistry, J. Geophys. Res., 99, 25 355–25 368, 1994. Keil, A. and Shepson, P.: Chlorine and bromine atom ratios in the
springtime Arctic troposphere as determined from measurements of halogenated volatile organic compounds, J. Geophys. Res., 111, D17303, doi:10.1029/2006JD007119, 2006.
Knipping, E. M. and Dabdub, D.: Modeling surface-mediated renoxification of the atmosphere via reaction of gaseous nitric oxide with deposited nitric acid, Atmos. Environ., 36, 5741– 5748, 2002.
Leaitch, W. R., Barrie, L. A., Bottenheim, J. W., Li, S. M., Shepson, P. B., Muthuramu, K., and Yokouchi, Y.: Airborne observations related to ozone depletion at Polar sunrise, J. Geophys. Res., 99, 25 499–25 517, 1994.
Lightfoot, P. D., Cox, R. A., Crowley, J. N., Destriau, M., Hayman, G. D., Jenkin, M. E., Moortgat, G. K., and Zabel, F.: Organic per-oxy radicals – kinetics, spectroscopy and tropospheric chemistry, Atmos. Environ., 26, 1805–1961, 1992.
Madronich, S. and Flocke, S.: The role of solar radiation in at-mospheric chemistry, Handbook of Environmental Chemistry, edited by: Boule, P., Springer-Verlag, Heidelberg, 1–26, 1998. Michalowski, B. A., Francisco, J. S., Li, S. M., Barrie, L. A.,
Bot-tenheim, J. W., and Shepson, P. B.: A computer model study of multiphase chemistry in the Arctic boundary layer during polar sunrise, J. Geophys. Res., 105, 15 131–15 145, 2000.
Oltmans, S. J. and Komhyr, W. D.: Surface ozone distributions and variations from 1973–1984 measurements at the NOAA Geo-physical Monitoring for Climatic Change Baseline Observato-ries, J. Geophys. Res., 91, 5229–5236, 1986.
Orlando, J. J., Ramacher, B., and Tyndall, G. S.: Upper limits for the rate coefficients for reactions of BrO with formaldehyde and HBr, Geophys. Res. Lett., 27, 2633–2636, 2000.
Penkett, S. A., Blake, N. J., Lightman, P., Marsh, A. R. W., Anwyl, P., and Butcher, G.: The seasonal variation of nonmethane hy-drocarbons in the free troposphere over the North Atlantic Ocean – Possible evidence for extensive reaction of hydrocarbons with the nitrate radical, J. Geophys. Res., 98, 2865–2885, 1993. Pszenny, A. A. P., Keene, W. C., Jacob, D. J., Fan, S., Maben, J.
R., Zetwo, M. P., Springeryoung, M., and Galloway, J. N.: Ev-idence of inorganic chlorine gases other than hydrogen chloride
in marine surface air, Geophys. Res. Lett., 20, 699–702, 1993. Ramacher, B., Rudolph, J., and Koppmann, R.: Hydrocarbon
mea-surements during tropospheric ozone depletion events: Evidence for halogen atom chemistry, J. Geophys. Res., 104, 3633–3653, 1999.
Ridley, B. A., Atlas, E. L., Montzka, D. D., Browell, E. V., Cantrell, C. A., Blake, D. R., Blake, N. J., Cinquini, L., Coffey, M. T., Em-mons, L. K., Cohen, R. C., DeYoung, R. J., Dibb, J. E., Eisele, F. L., Flocke, F. M., Fried, A., Grahek, F. E., Grant, W. B., Hair, J. W., Hannigan, J. W., Heikes, B. J., Lefer, B. L., Mauldin, R. L., Moody, J. L., Shetter, R. E., Snow, J. A., Talbot, R. W., Thornton, J. A., Walega, J. G., Weinheimer, A. J., Wert, B. P., and Wim-mers, A. J.: Ozone depletion events observed in the high latitude surface layer during the TOPSE aircraft program, J. Geophys. Res., 108, 8356, doi:10.1029/2002JD002227, 2003.
Sander, R. and Crutzen, P. J.: Model study indicating halogen ac-tivation and ozone destruction in polluted air masses transported to the sea, J. Geophys. Res., 101, 9121–9138, 1996.
Sander, R., Vogt, R., Harris, G. W., and Crutzen, P. J.: Modeling the chemistry ozone, halogen compounds, and hydrocarbons in the Arctic troposphere during spring, Tellus B, 49, 522–532, 1997. Schroeder, W. H., Anlauf, K. G., Barrie, L. A., Lu, J. Y., Steffen, A.,
Schneeberger, D. R., and Berg, T.: Arctic springtime depletion of mercury, Nature, 394, 331–332, 1998.
Shepson, P. B., Sirju, A. P., Hopper, J. F., Barrie, L. A., Young, V., Niki, H., and Dryfhout, H.: Sources and sinks of carbonyl compounds in the Arctic Ocean boundary layer: Polar Ice Floe Experiment, J. Geophys. Res., 101, 21 081–21 089, 1996. Simpson, W. R., Alvarez-Aviles, L., Douglas, T. A., Sturm, M.,
and Domine, F.: Halogens in the coastal snow pack near
Barrow, Alaska: Evidence for active bromine air-snow chem-istry during springtime, Geophys. Res. Lett., 32, LB04811, doi:10.1029/2004GL021748, 2005.
Simpson, W. R., von Glasow, R., Riedel, K., Anderson, P., Ariya, P., Bottenheim, J., Burrows, J., Carpenter, L. J., Friess, U., Good-site, M. E., Heard, D., Hutterli, M., Jacobi, H. W., Kaleschke, L., Neff, B., Plane, J., Platt, U., Richter, A., Roscoe, H., Sander, R., Shepson, P., Sodeau, J., Steffen, A., Wagner, T., and Wolff, E.: Halogens and their role in polar boundary layer ozone depletion, Atmos. Chem. Phys., 7, 4375–4418, 2007,
http://www.atmos-chem-phys.net/7/4375/2007/.
Solberg, S., Schmidbauer, N., Semb, A., Stordal, F., and Hov, O.: Boundary-layer ozone depletion as seen in the Norwegian Arctic in Spring, J. Atmos. Chem., 23, 301–332, 1996.
Spicer, C. W., Chapman, E. G., Finlayson-Pitts, B. J., Plastridge, R. A., Hubbe, J. M., Fast, J. D., and Berkowitz, C. M.: Unex-pectedly high concentrations of molecular chlorine in coastal air, Nature, 394, 353–356, 1998.
Sumner, A. L. and Shepson, P. B.: Snowpack production of
formaldehyde and its effect on the Arctic troposphere, Nature, 398, 230–233, 1999.
Sumner, A. L., Shepson, P. B., Grannas, A. M., Bottenheim, J. W., Anlauf, K. G., Worthy, D., Schroeder, W. H., Steffen, A., Domine, F., Perrier, S., and Houdier, S.: Atmospheric chemistry of formaldehyde in the Arctic troposphere at Polar Sunrise, and the influence of the snowpack, Atmos. Environ., 36, 2553–2562, 2002.
Tackett, P. J., Cavender, A. E., Keil, A. D., Shepson, P. B., Botten-heim, J. W., Morin, S., Deary, J., Steffen, A., and Doerge, C.: A study of the vertical scale of halogen chemistry in the Arctic troposphere during Polar Sunrise at Barrow, Alaska, J. Geophys. Res., 112, D07306, doi:10.1029/2006JD007785, 2007.
Toom-Sauntry, D. and Barrie, L. A.: Chemical composition of snowfall in the high Arctic: 1990–1994, Atmos. Environ., 36, 2683–2693, 2002.
Tsang, W.: Energetics of organic free radicals, Heats of formation of organic free radicals by kinetic methods, Blackie Academic and Professional, London, 22–58, 1996.
Tuckermann, M., Ackermann, R., Golz, C., LorenzenSchmidt, H., Senne, T., Stutz, J., Trost, B., Unold, W., and Platt, U.: DOAS-observation of halogen radical catalysed Arctic boundary layer ozone destruction during the ARCTOC campaigns 1995 and 1996 in Ny-Alesund, Spitsbergen, Tellus B, 49, 533–555, 1997. Tyndall, G. S., Orlando, J. J., Wallington, T. J., Dill, M., and Kaiser,
E. W.: Kinetics and mechanisms of the reactions of chlorine atoms with ethane, propane, and n-butane, Int. J. Chem. Kinet., 29, 43–55, 1997.
Villenave, E. and Lesclaux, R.: Kinetics of the cross reactions of CH3O2 and C2H5O2 radicals with selected peroxy radicals, J. Phys. Chem., 100, 14 372–14 382, 1996.
Vogt, R., Crutzen, P. J., and Sander, R.: A mechanism for halo-gen release from sea-salt aerosol in the remote marine boundary layer, Nature, 383, 327–330, 1996.
Wallington, T. J., Skewes, L. M., Siegl, W. O., and Japar, S. M.: A relative rate study of thereaction of bromine atoms with a variety of organic compounds at 295 K, Int. J. Chem. Kinet., 21, 1069– 1076, 1989.
Wollenhaupt, M., Carl, S. A., Horowitz, A., and Crowley, J. N.: Rate coefficients for reaction of OH with acetone between 202 and 395 K, J. Phys. Chem. A, 104, 2695–2705, 2000.
Yokouchi, Y., Akimoto, H., Barrie, L. A., Bottenheim, J. W., Anlauf, K., and Jobson, B. T.: Serial gas-chromatographic mass-spectrometric measurements of some volatile organic com-pounds in the Arctic atmosphere during the 1992 Polar Sunrise Experiment, J. Geophys. Res., 99, 25 379–25 389, 1994. Zhou, X. L., Beine, H. J., Honrath, R. E., Fuentes, J. D.,
Simp-son, W., ShepSimp-son, P. B., and Bottenheim, J. W.: Snowpack pho-tochemical production of HONO: a major source of OH in the Arctic boundary layer in springtime, Geophys. Res. Lett., 28, 4087–4090, 2001.
![Fig. 2. Ambient measurements of [MEK]/[n-butane], [isobutane]/[n-butane], [acetone]/[propanal] and [ozone] dur-ing PSE95](https://thumb-eu.123doks.com/thumbv2/123doknet/14657604.553211/8.892.77.424.504.882/ambient-measurements-butane-isobutane-butane-acetone-propanal-ozone.webp)
![Fig. 4. Model results of [MEK]/[n-butane] (A) and [isobutane]/[n- [isobutane]/[n-butane] (B) vs](https://thumb-eu.123doks.com/thumbv2/123doknet/14657604.553211/10.892.466.818.94.302/fig-model-results-mek-butane-isobutane-isobutane-butane.webp)
![Fig. 5. Model results of [MEK]/[n-butane] (A) and [isobutane]/[n- [isobutane]/[n-butane] (B) vs](https://thumb-eu.123doks.com/thumbv2/123doknet/14657604.553211/11.892.75.426.95.310/fig-model-results-mek-butane-isobutane-isobutane-butane.webp)