HAL Id: hal-02063638
https://hal.archives-ouvertes.fr/hal-02063638
Submitted on 13 Nov 2020
HAL is a multi-disciplinary open access
archive for the deposit and dissemination of
sci-entific research documents, whether they are
pub-lished or not. The documents may come from
teaching and research institutions in France or
abroad, or from public or private research centers.
L’archive ouverte pluridisciplinaire HAL, est
destinée au dépôt et à la diffusion de documents
scientifiques de niveau recherche, publiés ou non,
émanant des établissements d’enseignement et de
recherche français ou étrangers, des laboratoires
publics ou privés.
Bundle-specific tractography with incorporated
anatomical and orientational priors
Francois Rheault, Etienne St-Onge, Jasmeen Sidhu, Klaus Maier-Hein,
Nathalie Tzourio-Mazoyer, Laurent Petit, Maxime Descoteaux
To cite this version:
Francois Rheault, Etienne St-Onge, Jasmeen Sidhu, Klaus Maier-Hein, Nathalie Tzourio-Mazoyer, et
al.. Bundle-specific tractography with incorporated anatomical and orientational priors. NeuroImage,
Elsevier, 2019, 186, pp.382-398. �10.1016/j.neuroimage.2018.11.018�. �hal-02063638�
Bundle-Specific Tractography with incorporated anatomical
and orientational priors
Francois Rheaulta,∗, Etienne St-Ongea, Jasmeen Sidhua, Klaus Maier-Heinc, Nathalie Tzourio-Mazoyerb, Laurent Petitb, Maxime Descoteauxa
aSherbrooke Connectivity Imaging Laboratory (SCIL), Universit´e de Sherbrooke, Canada bGroupe d’Imagerie Neurofonctionnelle, IMN, UMR5293, CNRS, CEA, Universit´e de Bordeaux,
France
cDivision of Medical Image Computing, German Cancer Research Center (DKFZ), Heidelberg,
Germany
Abstract
Anatomical white matter bundles vary in shape, size, length, and complexity, making diffusion MRI tractography reconstruction of some bundles more difficult than others. As a result, bundles reconstruction often suffers from a poor spatial extent recovery. To fill-up the white matter volume as much and as best as possible, millions of streamlines can be generated and filtering techniques applied to address this issue. However, well-known problems and biases are introduced such as the creation of a large number of false positives and over-representation of easy-to-track parts of bundles and under-representation of hard-to-track.
To address these challenges, we developed a Bundle-Specific Tractography (BST) algorithm. It incorporates anatomical and orientational prior knowledge during the pro-cess of streamline tracing to increase reproducibility, sensitivity, specificity and efficiency when reconstructing certain bundles of interest. BST outperforms classical deterministic, probabilistic, and global tractography methods. The increase in anatomically plausible streamlines, with larger spatial coverage, helps to accurately represent the full shape of bundles, which could greatly enhance and robustify tract-based and connectivity-based neuroimaging studies.
Keywords: Diffusion MRI, White Matter, Tractography, Tractometry, Connectivity
1. Introduction
1
Tractography algorithms are currently challenged by several important open issues
2
and biases that need to be addressed to improve brain connectivity mapping [Jones,
3
2010; Jbabdi and Johansen-Berg, 2011; Maier-Hein et al., 2017]. In Maier-Hein et al.
4
[2017], it was recently shown that whole-brain tractography can recover most existing
5
true positive bundles but that these are poorly recovered in terms of spatial extent. In the
6
∗2500, boul. de l’Universit´e, Sherbrooke (Qu´ebec) Canada, J1K 2R1
Email address: [email protected] (Francois Rheault)
simulations of 25 human-like synthetic white matter (WM) bundles, an average spatial
7
extent recovery of only 30% is reported [Maier-Hein et al., 2017, Fig. 3]. We propose
8
to term this tractography issue as the “poor-spatial-extent” challenge. Techniques that
9
have better spatial extent recovery always generate more invalid streamlines, and thus
10
fall into the usual sensitivity-specificity curse. In the current context, the notion of
11
invalid streamlines refers to anatomically improbable streamlines, meaning their path
12
is not reflective of known WM pathways. The quality of WM bundle reconstruction
13
using tractography is influenced by many variables: i) global geometry of the bundle like
14
curvature, thickness, length, ii) local crossing regions it traverses, position of the bundle
15
with respect to other bundles, and iii) extent and shape of cortical endpoints. As a result,
16
some WM bundles are harder-to-track than others, which leads to the poor-spatial-extent
17
challenge.
18
Why are some bundles more difficult to reconstruct than others? Complex local fiber
19
regions, even if well recovered locally in terms of fiber orientation distributions, can lead
20
to invalid tractography streamlines that respect the underlying local diffusion signal but
21
make clear invalid pathways at the global brain level [Maier-Hein et al., 2017]. Despite
22
the fact that almost all WM regions contain crossing fiber populations [Jeurissen et al.,
23
2013], some are well-know pitfalls for tractography methods and could be tackled with
24
better prior information. As an illustration, the centrum semiovale, as seen in Figure1
25
and Figure2, was and still is a major difficulty for tractography algorithms. Three major
26
WM pathways: i) the pyramidal tract, ii) the mid-body of the corpus callosum (anterior
27
and posterior), and iii) the arching streamlines connecting the frontal to the temporal
28
lobes, are crossing almost orthogonally in the most ventral part. At such an intersection,
29
even with multiple fiber techniques, tractography algorithms most often follow the easiest
30
path available. Bundles can seem to cover a large spatial extent and have an appropriate
31
amount of fanning when millions of streamlines are used. However, the density is far from
32
uniform within a bundle, even if it cannot be perceived visually, as seen in Figure2. The
33
amount of crossing regions, overall length and curvature of the bundle will influence the
34
probability of a streamlines to reach its expected destination. Moreover, it is common
35
to observe streamlines abruptly changing direction to either switch to a different bundle
36
or follow an erroneous path, but end up in the right location. Crossing can become even
37
harder to distinguish as the main direction of the fiber populations kiss or come into a
38
bottleneck [Maier-Hein et al.,2017, Fig.7].
39
A partially reconstructed WM bundle could lead to erroneous interpretations and
40
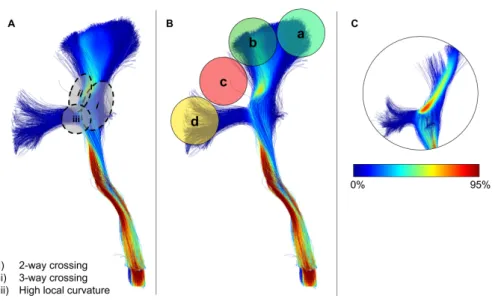
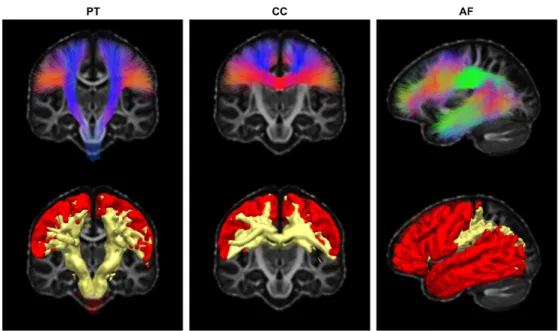
Figure 1: Crossing region of the Corpus Callosum (red), the Arcuate Fasciculus (green) and the Pyrami-dal Tract (blue) in the centrum semiovale. A) Coronal cross-section, B) coronal 3D view and C) sagittal 3D view.
Figure 2: Reconstruction of pyramidal tract (PT) streamlines illustrating some of the challenges of tractography, seen on panel A, i) 2-way crossing ii) 3-way crossing, and iii) high curvature.In panel B, regions a and b encounter less difficulties in reconstruction due to only being subject to a 2-way crossing limitation, as illustrated in Panel A (i), leading to a higher proportion of streamlines reaching the cortex in these general regions. Conversely, region c in Panel B encounters 2 and 3 way crossings (Panel A (i) and (ii)), whereas, region d in Panel B encounters 2-way crossing and high-curvature limitations (Panel A (i) and (iii)), leading to a lower proportion of streamlines successfully reaching the cortex. Streamline coloring represents the local streamlines density (at the voxel-level), segments in red shows regions where a large proportion of streamlines pass through a bottleneck as opposed to segments in blue. Panel C illustrates that the majority of streamlines traverse through the core of the PT.
conclusions. At the tract-based analysis level [Dayan et al.,2016;Cousineau et al.,2017;
41
Yeatman et al., 2012, 2018], the spatial extent of bundles (in cm3) is a measurement
42
often used to investigate morphological group differences, such as atrophy or asymmetry
43
[Catani et al.,2007;Song et al.,2014;Chenot et al.,2018]. At the connectome-level, the
44
number of streamlines in WM bundles connecting all possible pairs of cortical regions
45
is usually used [Sotiropoulos and Zalesky,2017]. However, because of a combination of
46
local and global differences in brain geometry and WM configurations, certain subjects
47
may have easier-to-track bundles than other subjects, which results in WM bundles
48
that fill-up in spatial extent before others and thus have artificially larger number of
49
streamlines. Two strategies exist to attempt overcoming these issues: 1) a whole brain
50
tractography with millions of streamlines followed by manual, clustering or advanced
51
filtering techniques, 2) a tailored ROI-based tractography.
52
Whole-brain tractography followed by filtering, clustering or manual dissection. In the
53
first strategy, millions of streamlines are typically reconstructed using a whole-brain
de-54
terministic, probabilistic, or global fiber tracking algorithms to fill-up the whole WM
55
volume and be able to capture a large spatial extent of all bundles [Wassermann et al.,
56
2016; Jeurissen et al., 2017; Moyer et al., 2018; Calamante et al., 2015; Smith et al.,
57
2015b]. With more streamlines, a larger extent of bundles is reconstructed (higher
sensi-58
tivity) but also more false positive bundles created (lower specificity) [Cˆot´e et al.,2013;
59
Maier-Hein et al.,2017], thus leading to the sensitivity-specificity curse mentioned before.
60
Generation of millions streamlines is often considered a brute force approach with a heavy
61
computational burden. All iterations leading to false positive are considered wasted.
Re-62
ducing such iterations increases the computational efficiency of a method, meaning that
63
less effort is required while maintaining an acceptable sensitivity-specificity ratio.
64
Moreover, when millions of streamlines are desired in a whole brain tractogram,
mil-65
lions of seeds and hundreds of millions of 3D points are generated, which can be an
66
important computational and memory limitation [Rheault et al.,2017]. In the case of a
67
specific tract-based application, where only a single to a few WM bundles are desired,
68
this whole brain strategy can be sub-optimal both in terms of bundle reconstruction
69
quality and computational efforts. Increasing the number of streamlines to 10M or 100M
70
would fill-up more of this hard-to-track fanning space, but would potentially never reach
71
full extent coverage. Generating more streamlines will artificially increase the density of
72
the central, easy-to-track part of the bundle and generate a large number of false positive
73
streamlines. Advanced filtering techniques such as SIFT, LIFE, COMMIT [Smith et al.,
74
2015a;Pestilli et al.,2014;Daducci et al.,2015] are able to filter some false positives and
75
reduce the density bias by making sure streamlines explain the desired diffusion signal,
76
but at the cost of removing some hard-to-track valid streamlines as well [Maier-Hein
77
et al.,2017].
78
ROI-based tractography. In the second strategy, a ROI-based tractography strategy uses
79
different masks, filtering ROI pass-ways and varying tractography parameters (step size,
80
curvature, anisotropy thresholds) [Chamberland et al.,2014,2017] to enhance the quality
81
of results based on neuroanatomical prior knowledge. A ROI-based seeding strategy is an
82
efficient way to quickly target a bundle of interest by removing unnecessary computations
83
needed in whole brain tractography. Such strategy has already been used in multiple
84
research projects to avoid generating unwanted streamlines [Basser et al., 2000;Catani
85
et al.,2002;Mori and van Zijl,2002;Behrens et al.,2007;Ghaziri et al.,2015;Renauld
86
et al., 2016; Rozanski et al., 2017; Chamberland et al., 2017], mainly using manual
87
delineations, or ROIs obtained from a segmentation tool such as FreeSurfer [Desikan
88
et al.,2006], or the JHU template [Mori et al.,2005].
89
Here, ROI-based tractography can be more efficient but not necessarily lead to better
90
spatial extent recovery. The poor-spatial-extent problem is temporarily “hidden” because
91
one can now afford to launch millions of seeds just to reconstruct a single bundle.
How-92
ever, the same issues illustrated in Figure2remain, i.e. hard-to-track fanning regions are
93
hard to reach and easy-to-track regions are amplified. Also, because of the ROI-based
94
filtering process, all the false positive streamlines generated are thrown out and excluded
95
from the result, but, computational efforts are still deployed to track them. Hence,
over-96
all, a ROI-based approach still suffers from poor efficiency, incomplete spatial-coverage
97
and a similar underlying trade-off between sensitivity and specificity.
98
To address these issues, tractography needs the injection of more information and
99
priors into the streamline tracing process itself. InMaier-Hein et al.[2017], it was clearly
100
shown that following local orientations alone cannot resolve all the potential ambiguity
101
and biases of fiber tracking. Bottlenecks are not tractable using directional information
102
alone.
103
Several approaches have been proposed to inject more prior knowledge. An automated
104
method called TRACULA [Yendiki et al., 2011] was proposed to include anatomical
105
priors from anatomical labeling. Pathway labels are used to initialize and constrain
106
the probabilistic tractography algorithm. However, this approach uses a conservative
107
reconstruction model (FACT, [Mori et al., 1999]) and strict anatomical definitions as
108
training sets, which limits the spatial extent of bundles. Further, probability maps are
109
computed instead of streamlines potentially limiting tract-based analyses. More recently,
110
Wasserthal et al. [2018a] proposed a method to directly segment the volume occupied
111
by bundle of interests. However this method does not rely on tractography and does
112
not produce streamlines. Features of the raw diffusion signal are learned and regions
113
of interests segmented where the characteristics of the signal match with bundles of
114
interests.
115
On the other hand, global tractography algorithms [Kreher et al.,2008;Mangin et al.,
116
2013; Christiaens et al., 2015; Neher et al., 2012] can sometimes overcome difficult
lo-117
cal crossing regions, but resulting tractograms do not always represent the expected
118
anatomical complexity of fasciculi. Global tracking algorithms are promising but are
119
known to have their share of open challenges such as heavy computational needs, the
120
generation of a large number of broken streamlines, and difficulty to impose anatomical
121
priors [Maier-Hein et al., 2017; Jeurissen et al.,2017].
122
Other approaches exist to overcome fiber crossing difficulties. Chamberland et al.
123
[2017] proposed a magnetic tracking (MAGNET) tool to manually influence directions
124
in strategic regions, improving the reconstruction of the optic radiations bundle.
MAG-125
NET essentially pulls tractography towards the occipital lobe with an orientation prior,
126
allowing fiber tracking to perform a “U-turn”-like reconstruction needed to fully
recon-127
struct Meyer’s loop. Moreover, Dhollander et al. [2014] also suggested a method to
128
sharpen orientations based on streamline distributions, called Track-Orientation
Distri-129
butions (TOD). TOD can help enhance tractography to cover longer distances along
130
WM structures and address some of the biases of fiber tracking. However, since
stream-131
lines density is not uniform across a tractogram and does not represent the underlying
132
anatomy, using such a method iteratively across WM will increase the density bias in
133
easy-to-track regions. More recently, Wasserthal et al. [2018b] proposed an approach
134
using bundle-specific orientation maps learned from multiple datasets to select a single
135
fiber orientation distribution (FOD) peak in each voxel, thus improving reconstruction of
136
bundles by simplifying regions with complex WM configuration. To the best of our
knowl-137
edge, these techniques are the only existing methods trying to inject orientational prior
138
knowledge into the tractography process. Other approaches have proposed to include
139
an orientation-based regularization term in the local reconstruction of fiber orientations,
140
but to our knowledge, not in the tractography procedure itself [Reisert and Kiselev,2011;
141
Portegies et al., 2015].
142
Tractography is therefore currently blind to the anatomy and does not have access
143
to the anatomical knowledge accumulated over the past several hundred years by the
144
neuroanatomy community. This neuroanatomical information, when available, could
145
enhance tractography. For instance, priors could capture the “where” and “how” of
146
bundles. That is where should the origin and target region of bundles be, and how
dif-147
ficult crossing, fanning, bending regions should be traversed. Our novel Bundle-Specific
148
Tractography (BST) algorithm is designed to directly incorporate these anatomical and
149
orientational priors in the tractography process itself. The main contribution is a novel
150
methodology enhancing local fiber orientation distribution based on WM bundle priors
151
coming from templates of streamlines. BST is fully automatic and yields better spatial
152
coverage, increases quality in the fanning extents and produces more plausible shape
153
reconstructions of bundles in the centrum semiovale.
154
2. Methods
155
2.1. Bundle-Specific Tractography
156
Our novel bundle-specific tractography (BST) approach is composed of three steps.
157
For each bundle of interest to be reconstructed, one needs to:
158
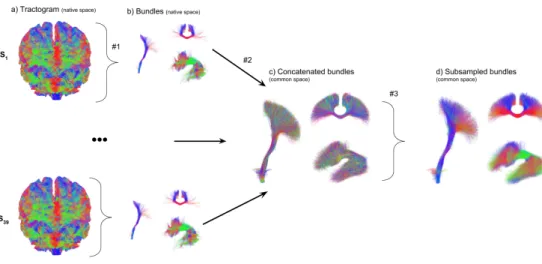
1. Build a template of streamlines that represents the shape and position of each
159
bundle, covering as much geometric variability as possible (see first row of Figure3
160
and Figure4).
161
2. Build the anatomical priors by incorporating dilated versions of endpoints and
162
spatial coverage maps defined from the template of streamlines in 1) (see second
163
row of Figure3).
164
3. Build the orientation priors by generating a field of enhanced fiber orientation
165
distrubtions (E-FOD) from the track-orientation distribution of the template of
166
streamlines in 1) (see Figure4).
167
Our BST approach can be applied to any bundle of interest with the previous 3 steps.
168
We now detail each of these steps before describing the datasets and how it was applied
169
to bundles intersecting in the centrum semiovale seen in Figure1.
170
Figure 3: The first row shows streamlines from the template on top of the FA template. In the second row, tracking masks (yellow) and seeding endpoints masks (red), automatically extracted from the template of streamlines of the first row.
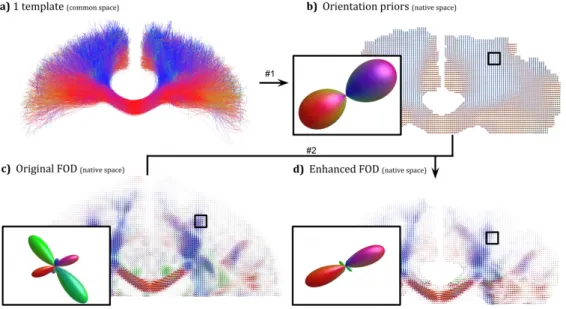
Figure 4: a) Template in a standard space, b) orientation priors in native space, c) initial FOD from CSD, d) pre-computed enhanced FOD.
Building the templates of streamlines
171
This initial step is crucial since the template of streamlines affects all additional
172
orientational and anatomical priors used by the BST algorithm. It involves four technical
173
steps (see FigureB.9):
174
(i) Run a whole-brain or ROI-based tractography technique on the selected subjects.
175
(ii) Segment the bundles of interest.
176
(iii) Merge all streamlines of each bundle and each subject in a common space.
177
(iv) Adjust the density bias of streamlines distribution.
178
i) Initial tractography. Our approach works in combination with any existing whole-brain
179
streamline-based or iterative tractography algorithm [Jeurissen et al., 2017]. BST will
180
enhance the initial tractography algorithm and retain the properties of the chosen initial
181
algorithm. Global tracking and graph-based/geodesic techniques could also be casted in
182
a BST setting but this is outside the scope of the current paper and will be discussed
183
later.
184
ii) Segmentation of bundles. Bundles of interest needed for a particular study are usually
185
well-defined in terms of anatomical regions they traverse or connect to [Catani et al.,
186
2002; Catani and De Schotten, 2008]. Moreover, the shape of the bundle is generally
187
agreed upon by various experts [Catani and De Schotten,2008;Hau et al.,2016] or have
188
often been established from ex vivo Klingler blunt dissections [Fern´andez-Miranda et al.,
189
2015;Benedictis et al.,2016;Hau et al.,2017]. Hence, this segmentation step of bundles
190
is either done manually or with a semi-automatic filtering or clustering approach. Of
191
course, if the number of subjects is large, a manual approach can be tedious and prone
192
to human error. Using ROIs defined by in WM and GM atlases to specify a sequence of
193
rules describing a pathway can be a good alternative [Wassermann et al.,2016]. Another
194
segmentation method is to select or discard streamlines based on shape of cluster using
195
models or anatomical a priori [Voineskos et al., 2009; Guevara et al., 2011; O’donnell
196
et al.,2013;Chekir et al.,2014;Garyfallidis et al.,2017;Zhang et al.,2018].
197
iii) Bring streamlines to a common space. A common space needs to be chosen. The
198
usual MNI space is a possibility or a tailored template space defined for a specific group of
199
subjects. Each subject is nonlinearly warped to that common space and the deformation
200
field used to move each bundle of interest from each subject into the common space. The
201
deformation involves transforming each point (vertex) of each streamline, using
tract-202
math [Wassermann et al., 2016] or a in-house tool. Once aligned to a common space,
203
bundles of interest are concatenated together into single track file, as seen in Figure3.
204
The intention of these templates is to represent the general shape and position of bundles.
205
iv) Correct for the density bias. An individual subject tractogram generally has low
206
density in crossing regions, while extremely dense in regions of one fiber population
207
(easy-to-track parts). The overall shape of a bundle influences this density, i.e. straight
208
bundles will be denser than curved bundles. Since the concept of tract density
(stream-209
lines count) in tractography can be a major pitfall that does not accurately represent the
210
underlying WM structure [Jones,2010;Jbabdi and Johansen-Berg,2011;Daducci et al.,
211
2016], this non-uniform density bias needs to be removed from the template of
stream-212
lines as only the orientation is of interest for our priors. A smart streamline subsampling
213
method based on hierarchical clustering algorithm and minimal direct flip (MDF)
dis-214
tance [Garyfallidis et al.,2012,2016] is used to overcome this issue. A streamline within
215
2mm of its neighboring streamlines do not carry new information and is removed, without
216
altering the general shape of the template.
217
As mentioned before, the template of streamlines essentially captures the a priori
218
knowledge of “where” and “how”, i.e. where is the bundle originating from, where is
219
going to, and how is it supposed to traverse complex crossing/kissing/branching/fanning
220
regions.
221
Anatomical priors: Tractography map creation
222
The streamlines in the template can now be displaced using the same point-wise
223
method from the template creation (using the inverse deformation field). Once the
224
template of streamlines is in the subject space, a new tracking mask is automatically
225
generated from the voxels intersected by the template streamlines. The streamlines
end-226
points can also be used to generate a ROI seeding mask. To reduce gyral bias effects
227
and to cover the potential variability across subjects, the seeding and tracking regions
228
are all dilated by 5mm, as seen in Figure 3. These masks are used to generate
prob-229
abilistic exclusion and inclusion maps as well as an interface GM-WM map needed for
230
anatomically-constrained tractography [Smith et al., 2012;Girard et al., 2014]. To
pre-231
vent streamlines from being generated outside of the white matter, all tracking masks
232
were constrained by the subject’s white matter mask. This ensures that our method does
233
not enforce its priors over a subject tissue segmentation, and only the general position
234
within the white matter.
235
Orientational priors: Enhancing fiber orientations
236
During tractography, streamlines are generated by taking steps using the fiber
orien-237
tation distribution (FOD) to choose the next direction [Jeurissen et al.,2017]. The value
238
of the FOD is used to weigh the probability of picking a direction. The proposed BST
239
approach uses orientation priors estimated from the template of streamlines to modify
240
the weighting according to the general, or more global, a priori bundle direction. If a
241
streamline is following a specific fiber population, the most well-aligned FOD lobe needs
242
to be prioritized.
243
To achieve this “prioritization” of FOD lobes, the local orientation histogram from
244
nearby segments of streamlines is computed at every voxel. This method is based on a
245
TOD map estimated from the template of streamlines, as originally introduced [
Dhol-246
lander et al., 2014]. Improvements related to the FOD field aiming to constraint
trac-247
tography spatially were proposed in the past [Portegies et al.,2015;Reisert and Kiselev,
248
2011].
249
Then, at each voxel, a point-wise multiplication of the FOD and TOD orientation
250
priors is performed, followed by a normalization. As a result, when a lobe is
well-251
aligned with the directions of the priors, the values stay the same. This is observed
252
in Figure 5, where the top row shows TOD maps associated to the pyramidal tracts,
253
the corpus callosum and the arching streamlines respectively. The bottom row shows the
254
corresponding enhanced FOD (E-FOD) associated with each bundle intersecting through
255
the centrum semiovale. Therefore, when a streamline reaches this crossing region, the
256
probability of choosing an appropriate direction is increased. The orientational prior will
257
amplify the desired direction present in the TOD map, and thus improve the directionality
258
of streamlines at the crossing. This concept of using a priori information as well as the
259
observed signal to increase anatomical validity of the decision is borrowed from Bayesian
260
statistics, which is common in neuroimaging [Woolrich et al., 2009; Friston et al., 2002b,a].
261
If the template of streamlines have crossing or complex fanning, the TOD map will
262
correctly capture this and an appropriate weighting will be achieved. This can be seen in
263
the zoomed picture of Figure4. On the contrary, lobes that are perpendicular decrease in
264
value as seen in Figure6, It is important to note that other lobes are not removed, they
265
are simply decreased in amplitude as this information was still present in the diffusion
266
data. As the aim is not to enforced our orientation priors, but simply re-weighting the
267
FOD amplitude, these two scenarios show the impacts in a extreme case and a typical
268
situation.
269
To ensure that non-existent or erroneous information is not created, a minimal
lobe-270
value threshold is set on the sphere for the orientational priors. This is to ensure that if
271
there is no well-aligned lobe with an amplitude high enough compared to the others, the
272
operation will not increase the values in that direction. A similar threshold was used in
273
Raffelt et al.[2017] to exclude orientations that do not likely represent a fiber population,
274
and used to perform peak extraction on FOD, also to exclude unlikely fiber populations
275
[Tournier et al.,2012; Chamberland et al., 2014; Dell’Acqua et al., 2013]. In our case,
276
we set a relative amplitude threshold to 0.2 (or 20%).
277
2.2. DWI Datasets
278
For this work the templates and experiments were performed with the BIL&GIN
279
database [Mazoyer et al.,2016]. The datasets are composed of T1-weighted and
diffusion-280
weighted images from 39 healthy subjects. The dMRI acquisition consists of 21 gradient
281
Figure 5: Orientation distribution of the crossing section presented in Figure1. The first row illustrates the track orientation distribution (TOD) maps generated from the different template (Pyramidal tract, corpus callosum, Arcuate Fasciculus). In the second row, the first FOD vignette presents the original fiber orientation distribution (FOD) in the crossing region followed by enhanced FOD (E-FOD), a combination of the associated template TOD (from the first row) and the original FOD.
Figure 6: The first row represents a voxel where the FOD (a) does not have any lobe aligned with the orientation prior (b), which results in an enhanced-FOD (c) almost identical to the original. The second row represents a voxel where a FOD (d) with a lobe of sufficient size (above the minimum relative amplitude threshold) globally aligned with the orientation prior (e), which results in an enhanced-FOD (f) with a increase amplitude for that lobe.
directions on half a sphere, the same direction were acquired on the other half of the
282
sphere for averaging, on a single shell (b = 1000 s/mm2) with a 2 mm isotropic resolution.
283
This scheme was acquired twice for averaging to increase SNR. At each voxel, the FOD
284
was computed using constrained spherical deconvolution (CSD) with spherical harmonics
285
of order 6Tournier et al.[2008]; Descoteaux et al.[2009].
286
2.3. Template creation
287
For each subject, a whole brain tractogram was reconstructed using the
anatomically-288
constrained probabilistic particle filtering tractography (PFT), with recommended
de-289
fault parameters [Girard et al., 2014]. Each tractogram was then segmented using an
290
automatic ROI-based method to extract five bundles of interest, these five bundles will
291
simply be referred to as the left/right pyramidal tract (PT), the corpus callosum (CC)
292
and the left/right arcuate fasciculus (AF). The complete anatomical definitions used
293
by the neuroanatomy expert can be found in the Anatomical Definition Section. We
294
built our own tailored anatomical template using the fractional anisotropy (FA) maps
295
of the 39 subjects with ANTS Multivariate Template Construction script [Avants et al.,
296
2008]. This group average template was used as a common space for the template of
297
streamlines. Subsequently, the 5 bundles of interest, from each subject, were moved into
298
that common space using the nonlinear deformation field from ANTS. Once BOI are
299
concatenated across subject, any redundant streamlines, up to a 2mm MDF distance
300
threshold, are discarded. Moreover, in this work, a leave-one-out approach was used to
301
ensure that the template streamlines generalize to independent datasets. Any
experi-302
ment using a template performed on a particular subject did not use the subject itself
303
in that template.
304
2.4. Experiments, Evaluation, and Statistical analysis
305
Probabilistic (Prob) and deterministic (Det), with or without PFT [Girard et al.,
306
2014] were compared, as well as global tractography from MITK Diffusion [Neher et al.,
307
2012]. GM-WM interface seeding was performed, with 5 seeds per voxel, adapted to each
308
bundle of interest (BOI) seeding region (BOI map). Three main sets of parameters were
309
used to compare between classical tracking algorithm and the proposed BST method. To
310
distinguish the impact of improvements from bundle-specific tracking anatomical prior
311
masks and orientational prior enhanced-FOD, three tractography reconstructions were
312
performed:
313
1. Original FOD with the original exclude/include maps
314
2. Original FOD with bundle-specific exclude/include maps
315
3. Enhanced FOD with bundle-specific exclude/include maps
316
Item 1 corresponds to classical HARDI tracking [Tournier et al., 2012; Jeurissen et al.,
317
2017]. The last item is the full BST method, while item 2 is a point of comparison to
318
help separate the contributions of the anatomical and orientation priors. Finally, we
319
also run global tractography [Kreher et al., 2008;Neher et al., 2012] to test against the
320
proposed BST methods. Detailed descriptions of the experiments are available in the
321
AnnexesSection. These lead to five bundles, two tracking evolution approaches (Prob
322
and Det), two algorithm (PFT/no-PFT), and the three compared method (classical, BOI
323
map and BOI & E-FOD), for a total of 60 tractography files plus one global tractography
324
result per subject. With these 2379 tractograms (61 tractograms times 39 subjects), the
325
automatic bundle segmentation method mentioned earlier (Anatomical Definition) was
326
applied to obtain each bundle.
327
Evaluation and statistical analysis were performed using the following measures:
bun-328
dle volume, weighted-Dice coefficient, average streamlines length, percentage of valid
329
streamlines and computational performance. The volume was obtained by computing a
330
binary mask of every voxel intersected by streamlines, in a 1mm isotropic grid [Rheault
331
et al., 2017]. The weighted-Dice was introduced by Cousineau et al. [2017] to obtain
332
a value representing spatial agreement that takes account streamlines density. Using
333
the Dice coefficient as a spatial agreement metric will be severely penalized for spurious
334
streamlines. The overall shape of bundles of interests were expected to be similar across
335
subjects. The strict anatomical definitions lead to comparable bundles across subjects
336
once registered in a common space, especially for major WM pathways. In addition, an
337
intra-subject approach would not have provided direct information regarding the quality
338
of a bundle reconstruction. Lack of fanning reaching the cortex could be reproducible
339
and the spatial agreement high without showing improvement compared to the expected
340
shape. Since the bundles of interests in this project (AF, CC, PT) are major WM
341
pathways, they are generally anatomically comparable across subjects, i.e. the spatial
342
agreement is expected to be high, without necessarily reaching a perfect score.
343
The percentage of valid streamlines is the proportion of generated streamlines
re-344
specting the anatomical definition of a bundle from the expert (seeAnatomical
Defini-345
tionSection) and a length threshold compared to the total amount of streamlines that
346
were originally generated. All outputs from tractography have to respect the algorithm
347
constraints (tracking mask, angular threshold, spherical function threshold), however the
348
length threshold was applied only for bundles. segmentation. In the context of our
ex-349
periments, the notion of valid and invalid streamlines vary with the bundle of interest
350
investigated. A valid streamline for a particular BOI will be considered invalid for all
351
other BOI.For example, a BOI interface of 100 voxels with 5 seeds per voxel would launch
352
500 streamlines, if 25 streamlines are segmented (considered valid), this would amount
353
to 5% of valid streamlines. Computational performance (efficiency), represents the total
354
number of tractography iterations, i.e. tracking steps, leading to valid streamline points.
355
This is slightly different than the previous percentage of valid streamlines measure,
es-356
pecially with the BOI tracking mask, because most invalid streamlines end up having
357
less than 50 steps while valid streamlines end up with more 500 steps. This metric is
358
better than streamlines count to represent the improvement in terms of computational
359
performance.
360
For statistical analysis, all subjects and bundles were analyzed separately. Then, to
361
highlight general trends, results were averaged. The analysis was performed with all
362
streamlines registered in the FA template space. This alignment, allowed to compute
363
overlaps between subjects and to normalize the values obtained for the volume and
364
average length. This procedure ensures that variations in volume or length does not
365
come from disparities in brain size of the subject but rather from the tracking itself.
366
3. Results
367
To simplify reading of tables, graphs and figures, the focus will be on probabilistic
368
tracking with particle filter tractography (PFT), but all evaluation data, graphs and
369
figures are available in theAnnexes Section. Observations and trends are similar and
370
as expected. Moreover, MITK Global tractography was also benchmarked on the same
371
measures to ensure an adequate comparison to state-of-the-art tractography algorithms.
372
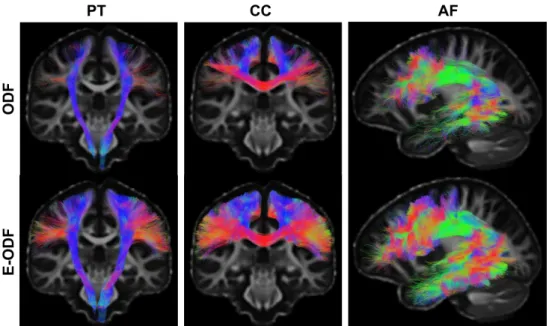
Figure 7 shows segmentations of PT, CC, and AF bundles of interest with a
prob-373
abilistic PFT algorithm, comparing the use of original FOD and PFT maps to the
pro-374
posed BST approach using the enhanced FOD with the modified PFT maps. The
re-375
constructed bundles of interest from the classical tracking show some degree of fanning,
376
but the number of streamlines generated was not sufficient to fully recover the spatial
377
extent of bundles. All bundles reconstructed using the masking priors and the enhanced
378
FOD show an increase in both bundle coverage and quality of the fanning. For the PT,
379
the lateral portions of the pre- and post-central gyri are better covered while they are
380
almost non-existent with standard PFT. Similarly, the CC has the fanning fully covering
381
the pre-central and post-central gyri. As for the AF, the spatial extent in the frontal
382
and temporal lobes is increased, but streamlines are also reaching more laterally into the
383
gyri. The quantitative impact of the improved fanning directly impacted the volumes of
384
the reconstructed bundles, as seen in the first column of Table1.
385
Figure 8 shows the trends for each measures of the analysis, where each graph
386
represents the changes of all bundles across the three sets of tractography parameters.
387
The impacts are not the same for each bundle, as the shape, size and the underlying
388
anatomy are inherently different. Error bars in the histograms represent the average
389
values and their standard deviation across 39 subjects. As the histograms can be hard
390
to compare, values are also shown in Table1.
391
In Figure 8 a), an increase in volume for all bundles is measured when the priors
392
Figure 7: Examples of resulting PFT and BST algorithms for a single subject. The first row shows results from standard tracking of the PT, CC and AF, while the second row shows results from the proposed bundle-specific tracking. Of note, at no point tracking is allowed outside of the initial white matter tracking mask. It involves that no streamline travel in gray matter or CSF and the impression of going over the sulci which can be observed in the second row is due to coronal view lacking perspective.
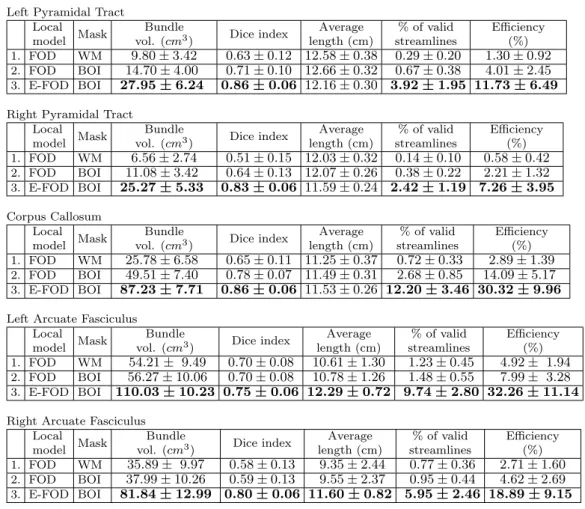
Left Pyramidal Tract Local
model Mask
Bundle
vol. (cm3) Dice index
Average length (cm) % of valid streamlines Efficiency (%) 1. FOD WM 9.80 ± 3.42 0.63 ± 0.12 12.58 ± 0.38 0.29 ± 0.20 1.30 ± 0.92 2. FOD BOI 14.70 ± 4.00 0.71 ± 0.10 12.66 ± 0.32 0.67 ± 0.38 4.01 ± 2.45 3. E-FOD BOI 27.95 ± 6.24 0.86 ± 0.06 12.16 ± 0.30 3.92 ± 1.95 11.73 ± 6.49
Right Pyramidal Tract Local
model Mask
Bundle
vol. (cm3) Dice index
Average length (cm) % of valid streamlines Efficiency (%) 1. FOD WM 6.56 ± 2.74 0.51 ± 0.15 12.03 ± 0.32 0.14 ± 0.10 0.58 ± 0.42 2. FOD BOI 11.08 ± 3.42 0.64 ± 0.13 12.07 ± 0.26 0.38 ± 0.22 2.21 ± 1.32 3. E-FOD BOI 25.27 ± 5.33 0.83 ± 0.06 11.59 ± 0.24 2.42 ± 1.19 7.26 ± 3.95 Corpus Callosum Local model Mask Bundle
vol. (cm3) Dice index
Average length (cm) % of valid streamlines Efficiency (%) 1. FOD WM 25.78 ± 6.58 0.65 ± 0.11 11.25 ± 0.37 0.72 ± 0.33 2.89 ± 1.39 2. FOD BOI 49.51 ± 7.40 0.78 ± 0.07 11.49 ± 0.31 2.68 ± 0.85 14.09 ± 5.17 3. E-FOD BOI 87.23 ± 7.71 0.86 ± 0.06 11.53 ± 0.26 12.20 ± 3.46 30.32 ± 9.96
Left Arcuate Fasciculus Local
model Mask
Bundle
vol. (cm3) Dice index
Average length (cm) % of valid streamlines Efficiency (%) 1. FOD WM 54.21 ± 9.49 0.70 ± 0.08 10.61 ± 1.30 1.23 ± 0.45 4.92 ± 1.94 2. FOD BOI 56.27 ± 10.06 0.70 ± 0.08 10.78 ± 1.26 1.48 ± 0.55 7.99 ± 3.28 3. E-FOD BOI 110.03 ± 10.23 0.75 ± 0.06 12.29 ± 0.72 9.74 ± 2.80 32.26 ± 11.14
Right Arcuate Fasciculus Local
model Mask
Bundle
vol. (cm3) Dice index
Average length (cm) % of valid streamlines Efficiency (%) 1. FOD WM 35.89 ± 9.97 0.58 ± 0.13 9.35 ± 2.44 0.77 ± 0.36 2.71 ± 1.60 2. FOD BOI 37.99 ± 10.26 0.59 ± 0.13 9.55 ± 2.37 0.95 ± 0.44 4.62 ± 2.69 3. E-FOD BOI 81.84 ± 12.99 0.80 ± 0.06 11.60 ± 0.82 5.95 ± 2.46 18.89 ± 9.15
Table 1: Quantitative results are shown separately for each bundle of interest from three experiments, measures of the 39 validation subjects were averaged together. Values for average and standard deviation are formatted to simplify interpretation. All measures, except average length, are improved by our approach when compared to classical tractography (approach 1 and 2), the difference is statistically significant (p < 0.01). Average length remains stable across method, however it was significantly higher for both arcuate fasciculus.
are used. The AF are the only bundles with no significant increase between the tracking
393
using no a priori masking and the tracking using only the a priori masking, however the
394
volume significantly increases when enhanced FOD are used. The standard deviation,
395
for methods 2 and 3, in proportion to the average, is decreasing. The volume of the
396
reconstructed PT using method 3 is approximately 400% of the volume obtained from
397
classical tracking, 300% for the CC and 200% for the AF.
398
The reproducibility across datasets was measured by the Weighted-Dice coefficient.
399
Tractography without priors poorly performed with values between 0.5 (PT right) and
400
0.7 (AF left). In Figure8b), an increase in overlap for all BOI is observed when E-FOD
401
are used, with Weigthed-Dice values all more or less 0.8. Similarly to the volume, the
402
AF are the only bundles with no significant increase between methods 1 and 2, while
403
the overlap significantly increases when enhanced FOD are used. For methods 2 and
404
3, the standard deviation of the Weighted-Dice coefficient is decreasing as the average
405
coefficient is increasing. For all bundles, except the left AF, the Weigthed-Dice increases
406
by 20% when method 3 is used instead of the classical tracking.
407
The average length and standard deviation was computed to evaluate the shape
408
Figure 8: Quantitative measures for each BOI across the 3 tracking algorithms. Results from global tractography is added to provide more context, but comparaison is partly “unfair” as many variables cannot be controlled in the same way. The Results are shown for probabilistic tracking with PFT. Graphs for deterministic and probabilistic versions of the algorithms with and without PFT are also available in theAnnexesSection
. 15
coherence of each bundle. Globally, the average length of most BOI remained similar for
409
each method, as seen in Figure8 c). However, for the AF, going from methods 2 to 3,
410
the average length increased and the standard deviation decreased. This can be observed
411
more easily in Table1. As mentioned earlier (Figure7), this is due to streamlines reaching
412
further inside the lateral gyri.
413
Finally Figure 8 d) and e) and the last two columns in Table 1 show measures of
414
efficiency. The use of adapted tracking masks (method 2) is not remarkably
influenc-415
ing the percentage of valid streamlines. However, integrating enhanced FOD (method 3)
416
significantly increases efficiency. A tractogram with one million streamlines, each
stream-417
line with more or less one hundred points, would need one hundred million iterations.
418
However, not all streamlines have the same number of points depending on their length.
419
When adapted tracking masks (method 2) are used, most invalid streamlines are quickly
420
stopped and thus a large number of iterations avoided. Also, it is important to note that
421
the percentage of valid streamlines and efficiency are improved but that they are still
422
under 15% and 40% respectively, which leaves plenty of room for further improvements.
423
Similar trends can be observed in theAnnexesSection for probabilistic tractography
424
(without particle filtering). Bundle-specific tractography also improves reconstruction
425
when using deterministic algorithms, the difference between classical deterministic and
426
deterministic bundle-specific tractography was statistically significant (p < 0.01). This
427
shows that most algorithms using FOD as an input need orientational priors to better
428
reconstruct bundle of interest.
429
Results from MITK global tractography [Neher et al.,2012] were overall superior to
430
all classic tractography algorithms used for the experiments, as seen in Annexes
Fig-431
ures B.10,B.11,B.12,B.13. However, bundle-specific probabilistic tractography always
432
generate bundles with higher volume and higher reproducibility across subjects compared
433
to global tractography. The orientational prior used with probabilistic tractography (with
434
or without PFT) achieve better results while decreasing computational needs.
435
4. Discussion
436
Our bundle-specific tractography algorithm is designed to address the
poor-spatial-437
extent challenge and the sensitivity-specificity trade-off of tractography. Contributions
438
are: i) novel bundle-specific anatomical and orientational priors directly incorporated
439
in the tractography process to boost streamline tracking in hard-to-track regions, ii)
440
results that show increased reproducibility, sensitivity, and specificity of PT, CC, AF
441
bundle reconstructions in the complex centrum semiovale region, and iii) a new BST
442
algorithm with increased efficiency and reduced overall computation time. The main
443
methodological innovation is the novel local fiber orientation distribution enhancement
444
methodology based on white matter bundle priors. These additions were shown to yield
445
better spatial coverage of the pyramidal tract, corpus callosum, and arcuate fasciculus,
446
increasing the quality of the extent of fanning reaching the cortex, helping to accurately
447
represent the shape of each fascicle. Increase in volume is not a direct measure of the
448
quality of a bundle reconstruction. The use of a strict anatomical definition based on the
449
literature is fundamental to correctly address this concern. The definition was designed
450
to reduce as much as possible the number of false positives, meaning that significant
451
increase in volume cannot be accounted by an increase in outliers, spurious streamlines
452
or contributions from other bundles. As mentioned earlier, tracking is never allowed
453
outside of the initial white matter tracking mask. Hence, increase in volume cannot
454
come from “new voxels” added by our algorithm. The increase in volume was observed
455
in regions that initially lack fanning reaching the cortex, which is a common difficulty
456
for classical tractography [Girard et al., 2014; St-Onge et al., 2017]. It is important to
457
note that the FOD enhancement affects the mathematical properties of the FOD. The
458
E-FOD should not be used to compute FOD metrics such as the AFD [Raffelt et al.,
459
2017] or even NuFO [Tournier et al.,2008] since lobes amplitude changed and no longer
460
agree with the DWI signal.
461
Template creation needed for Bundle-Specific Tractography
462
The creation of an appropriate template of streamlines is crucial for the proposed
463
method, as mentioned in the Methods Section. The input bundle of interest of the
464
template needs to be strictly segmented and cleaned of spurious streamlines, while still
465
representing all the potential anatomical variability across subjects. We acknowledge
466
that anatomical definition of WM bundles can vary among experts and that there
ex-467
ist several open controversies in the WM neuroanatomy literature [Forkel et al., 2014;
468
Meola et al., 2015; Hau et al., 2017]. However, having a consensus on the definition of
469
the bundle is not necessary to showcase the potential of our Bundle-Specific
Tractogra-470
phy. Neuroanatomists can debate and converge on the precise definitions of anatomical
471
bundles, which can then be adjusted into our BST method.
472
Moreover, the nonlinear deformation of the template to the subject’s native space is
473
done under the assumption that ANTS performs an adequate registration in-between FA
474
maps. In the case of a different study, with pathology or large brain alterations, such as a
475
tumor, cyst, severe atrophy, or missing brain regions, the quality of the alignment would
476
need to be guaranteed manually. Using a tailored template based on a specific cohort
477
enables our proposed BST method to be fully automatic without relying on manually
478
placed ROIs to enforce certain directions and ending regions.Pathological brains already
479
raise numerous challenges for tissue segmentation, registration, classical tractography
480
and analysis, which all require case-by-case decisions and tuning. For example, WM
481
lesions for Alzheimer’s disease, multiple sclerosis, traumatic brain injuries do not have
482
the same underlying causes and tractography could sometimes be allowed to go through
483
them or not. When all conditions are met and potential pitfalls related to the pathology
484
are accounted for, BST can yield interesting results and can have positive impacts for
485
challenging datasets, as illustrated on the fornix reconstruction in an aging study [Rheault
486
et al., 2018].
487
As atlases of streamlines become more widely available, such as the one of Yeh and
488
Tseng [2011]; Wasserthal et al. [2018a], different research groups will be able to use these
489
without having to build their own. As an attempt to facilitate its use and guarantee
490
the quality of the anatomical priors for well-known pathways, a WM atlas dedicated to
491
the BST has been designed. This is a step in the right direction to include anatomical
492
priors to improve tractography and address some of the challenges raised in Maier-Hein
493
et al. [2017]. To facilitate future investigations and help other researchers to use our
494
method, a Nextflow pipeline [Di Tommaso et al., 2017] has been developed. By providing
495
configuration files, a lightweight WM atlases of bundles and a singularity environment
496
[Kurtzer et al., 2017], this pipeline will simplify the usage of our method. Also, researchers
497
with specific needs can easily customize the pipeline and the configuration file and obtain
498
exactly what they need.
499
Bundle volume and spatial coverage
500
The priors on the regions of interests and local orientations noticeably improve the
501
virtual dissection results by increasing the total volume and the fanning extent. FOD
502
enhancement helps to overcome tracking difficulties in the crossing regions, allowing more
503
streamlines to respect the anatomical definition of the bundle of interest (seeAnatomical
504
DefinitionSection). Difficulties encountered in the crossing region would have required a
505
higher number of seeds per voxel to obtain an appropriate reconstruction for the classical
506
method, however this approach does not ensure to fully capture the spatial extent. When
507
FODs are enhanced to support the main directionality of a bundle of interest, crossing
508
regions become less disorienting during the tractography, thus increasing the number of
509
streamlines to be considered during segmentation. All this while being more efficient, in
510
term of valid streamlines after segmentation.
511
As the fanning component of the bundles represent the majority of their volume,
512
improved fanning has a quantitative impact on the volume. For example, the fanning
513
of the PT and CC occurs in the 3-way crossing region (Figure1), traditionally resulting
514
in a small preponderance of streamlines reaching lateral portions of the primary motor
515
and somatosensory cortex. The priors largely impact the volume of the bundles (first
516
column of Table 1). The use of a priori seeding tracking masks increases volume as
517
particle filtering tractography enforces streamline termination in GM regions. The usage
518
of enhanced FOD increases the volume even more by reducing the potential confusion in
519
crossings, as picking a bad direction at each step quickly accumulates in terms of error.
520
Reproducibility
521
Bundles of interest considered in this project are known to have anatomical variability
522
at the micro-scale, but at the macro-scale (on the whole bundle level) the AF, CC
523
and PT are expected to cover the same regions (once in a common space) after the
524
segmentation described in theAnatomical DefinitionSection. We acknowledge that an
525
identical coverage is not expected, meaning the weighted-dice should not be expected to
526
be 1.0. However, poor spatial agreement (inter-subject) with the classical tractography
527
method mainly comes from poor fanning, a typical solution to this problem is to seed
528
more until the expected shape is obtained and fanning is adequate. The low
weighted-529
dice value seen from classical method is influenced by the high variability of the fanning
530
(CC, PT) or from the early-stop of streamlines in the frontal and temporal lobe (AF).
531
The goal was not to obtain a value of 1.0. The goal was to reduce the variability in
532
these regions as they were caused by tractography limitations and not explained by the
533
underlying anatomy. Intra-subject reproducibility could have hidden this pitfall as a
534
lack of fanning could be reproducible (intra-subject) and would not have reflected if the
535
expected anatomical shape was achieved.
536
Computational Performance
537
Immediately stopping any streamline getting out of the bundle of interest region using
538
a priori imposed dilated masks directly reduces the number of tractography iterations
539
and saves computation time without altering the resulting dissection. Such stopping
540
criteria also decreases the rate of false positives, as streamlines must follow a reasonable
541
path to be considered valid. The efficiency of BST is also increased since streamlines
542
follow the main direction of the BOI instead of leaving prematurely the tracking mask
543
without reaching ROI endpoints. By following the appropriate direction in the crossing,
544
the streamlines have more chance to respect all the bundle definitions, resulting in a
545
higher amount of valid streamlines.
546
Performance is not just about number of streamlines. The increase in performance
547
combined with the increase in volume and overlap between subjects (Table1) shows that
548
using the proposed method helps to reach stable results more rapidly, while improving
549
the quality of the bundle of interest.
550
Future Work
551
Since the output of the proposed method is in the form of FOD in a widespread format
552
(spherical harmonics) and binary masks, any algorithm that accepts such input could be
553
easily adapted. Other forms of tracking (Dipy [Garyfallidis et al., 2014], FSL [Behrens
554
et al.,2007], MRtrix [Tournier et al.,2012], Real-time tractography [Chamberland et al.,
555
2014], even Global tractography [Kreher et al., 2008; Christiaens et al., 2015; Reisert
556
et al., 2011]) could be tried. Algorithms designed to add more a priori could also be
557
tried alongside enhanced-FOD such as surface-enhanced tractography [St-Onge et al.,
558
2017] and microstructure-informed tractography (AxTract) [Girard et al.,2015]).
559
5. Conclusion
560
We developed a new bundle-specific tracking (BST) algorithm incorporating novel
561
anatomical orientational priors directly into the streamline tracing process to address
562
the poor-spatial-extent challenge and sensitivity-specificity trade-off of WM bundle
re-563
construction using tractography. This fully automatic method exploits information
ex-564
tracted from a template of streamlines of bundles of interest to enhance the local modeling
565
in the desired direction using the a priori fiber orientation distribution. It was shown
566
that the proposed approach improves the spatial coverage and increases the quality of the
567
fanning in crossing regions, while reducing computational need. Since a stable volume
568
and sufficient anatomically valid streamlines are reconstructed faster than with
classi-569
cal techniques, this method helps the exploration of structural connectivity with more
570
confidence and less biases in white matter bundles metrics. This could have a
posi-571
tive impact on the neurosciences community using dMRI tractography tract-based and
572
connectivity-based analyses.
573
Acknowledgements
574
Thank you to Philippe Poulin and Jasmeen Sidhu for their insights which helped shape
575
this paper. A special thank you to the funding sources for this work, the FRQNT and
576
CREATE-MIA programs. Thank you to the Neuroinformatics Chair of the Sherbrooke
577
University which helped push forward neurosciences research.
578
References
579
Avants, B.B., Epstein, C.L., Grossman, M., Gee, J.C., 2008. Symmetric diffeomorphic image registration
580
with cross-correlation: evaluating automated labeling of elderly and neurodegenerative brain. Medical
581
image analysis 12, 26–41.
582
Basser, P.J., Pajevic, S., Pierpaoli, C., Duda, J., Aldroubi, A., 2000. In vivo fiber tractography using
583
dt-mri data. Magnetic resonance in medicine 44, 625–632.
584
Behrens, T.E., Berg, H.J., Jbabdi, S., Rushworth, M.F., Woolrich, M.W., 2007. Probabilistic diffusion
585
tractography with multiple fibre orientations: What can we gain? Neuroimage 34, 144–155.
586
Benedictis, A., Petit, L., Descoteaux, M., Marras, C.E., Barbareschi, M., Corsini, F., Dallabona, M.,
587
Chioffi, F., Sarubbo, S., 2016. New insights in the homotopic and heterotopic connectivity of the
588
frontal portion of the human corpus callosum revealed by microdissection and diffusion tractography.
589
Human brain mapping 37, 4718–4735.
590
Calamante, F., Smith, R.E., Tournier, J.D., Raffelt, D., Connelly, A., 2015. Quantification of voxel-wise
591
total fibre density: investigating the problems associated with track-count mapping. Neuroimage 117,
592
284–293.
593
Catani, M., Allin, M.P., Husain, M., Pugliese, L., Mesulam, M.M., Murray, R.M., Jones, D.K., 2007.
594
Symmetries in human brain language pathways correlate with verbal recall. Proceedings of the
Na-595
tional Academy of Sciences 104, 17163–17168.
596
Catani, M., De Schotten, M.T., 2008. A diffusion tensor imaging tractography atlas for virtual in vivo
597
dissections. cortex 44, 1105–1132.
598
Catani, M., Howard, R.J., Pajevic, S., Jones, D.K., 2002. Virtual in vivo interactive dissection of white
599
matter fasciculi in the human brain. Neuroimage 17, 77–94.
600
Chamberland, M., Scherrer, B., Prabhu, S.P., Madsen, J., Fortin, D., Whittingstall, K., Descoteaux,
601
M., Warfield, S.K., 2017. Active delineation of meyer’s loop using oriented priors through magnetic
602
tractography (magnet). Human brain mapping 38, 509–527.
603
Chamberland, M., Whittingstall, K., Fortin, D., Mathieu, D., Descoteaux, M., 2014. Real-time
multi-604
peak tractography for instantaneous connectivity display. Frontiers in neuroinformatics 8, 59.
605
Chekir, A., Descoteaux, M., Garyfallidis, E., Cˆot´e, M.A., Boumghar, F.O., 2014. A hybrid approach
606
for optimal automatic segmentation of white matter tracts in hardi, in: Biomedical Engineering and
607
Sciences (IECBES), 2014 IEEE Conference on, IEEE. pp. 177–180.
608
Chenot, Q., Tzourio-Mazoyer, N., Rheault, F., Descoteaux, M., Crivello, F., Zago, L., Mellet, E., Jobard,
609
G., Joliot, M., Mazoyer, B., et al., 2018. A probabilistic atlas of the human pyramidal tract in 410
610
healthy participants. bioRxiv , 251108.
611
Christiaens, D., Reisert, M., Dhollander, T., Sunaert, S., Suetens, P., Maes, F., 2015. Global
tractog-612
raphy of multi-shell diffusion-weighted imaging data using a multi-tissue model. Neuroimage 123,
613
89–101.
614
Cˆot´e, M.A., Girard, G., Bor´e, A., Garyfallidis, E., Houde, J.C., Descoteaux, M., 2013. Tractometer:
615
towards validation of tractography pipelines. Medical image analysis 17, 844–857.
616
Cousineau, M., Jodoin, P.M., Garyfallidis, E., Cˆot´e, M.A., Morency, F.C., Rozanski, V., GrandMaison,
617
M., Bedell, B.J., Descoteaux, M., 2017. A test-retest study on parkinson’s ppmi dataset yields
618
statistically significant white matter fascicles. NeuroImage: Clinical 16, 222–233.
619
Daducci, A., Dal Pal´u, A., Descoteaux, M., Thiran, J.P., 2016. Microstructure informed tractography:
620
pitfalls and open challenges. Frontiers in neuroscience 10, 247.
621
Daducci, A., Dal Pal`u, A., Lemkaddem, A., Thiran, J.P., 2015. Commit: convex optimization modeling
622
for microstructure informed tractography. IEEE transactions on medical imaging 34, 246–257.
623
Dayan, M., Monohan, E., Pandya, S., Kuceyeski, A., Nguyen, T.D., Raj, A., Gauthier, S.A., 2016.
624
Profilometry: a new statistical framework for the characterization of white matter pathways, with
625
application to multiple sclerosis. Human brain mapping 37, 989–1004.
626
Dell’Acqua, F., Simmons, A., Williams, S.C., Catani, M., 2013. Can spherical deconvolution provide
627
more information than fiber orientations? hindrance modulated orientational anisotropy, a true-tract
628
specific index to characterize white matter diffusion. Human brain mapping 34, 2464–2483.
629
Descoteaux, M., Deriche, R., Knosche, T.R., Anwander, A., 2009. Deterministic and probabilistic
630
tractography based on complex fibre orientation distributions. IEEE transactions on medical imaging
631
28, 269–286.
632
Desikan, R.S., S´egonne, F., Fischl, B., Quinn, B.T., Dickerson, B.C., Blacker, D., Buckner, R.L., Dale,
633
A.M., Maguire, R.P., Hyman, B.T., et al., 2006. An automated labeling system for subdividing the
634
human cerebral cortex on mri scans into gyral based regions of interest. Neuroimage 31, 968–980.
635
Dhollander, T., Emsell, L., Van Hecke, W., Maes, F., Sunaert, S., Suetens, P., 2014. Track orientation
636
density imaging (todi) and track orientation distribution (tod) based tractography. NeuroImage 94,
637
312–336.
638
Di Tommaso, P., Chatzou, M., Floden, E.W., Barja, P.P., Palumbo, E., Notredame, C., 2017. Nextflow
639
enables reproducible computational workflows. Nature biotechnology 35, 316–319.
640
Fern´andez-Miranda, J.C., Wang, Y., Pathak, S., Stefaneau, L., Verstynen, T., Yeh, F.C., 2015.
Asym-641