HAL Id: hal-01062215
https://hal.archives-ouvertes.fr/hal-01062215
Submitted on 6 Apr 2015
HAL is a multi-disciplinary open access
archive for the deposit and dissemination of
sci-entific research documents, whether they are
pub-lished or not. The documents may come from
teaching and research institutions in France or
abroad, or from public or private research centers.
L’archive ouverte pluridisciplinaire HAL, est
destinée au dépôt et à la diffusion de documents
scientifiques de niveau recherche, publiés ou non,
émanant des établissements d’enseignement et de
recherche français ou étrangers, des laboratoires
publics ou privés.
Microphysical Simulations of Mesospheric CO2 Ice
Clouds and Comparison to Observations
Constantino Listowski, Anni Määttänen, Franck Montmessin, A. Spiga,
Franck Lefèvre
To cite this version:
Constantino Listowski, Anni Määttänen, Franck Montmessin, A. Spiga, Franck Lefèvre. Microphysical
Simulations of Mesospheric CO2 Ice Clouds and Comparison to Observations. Fifth International
Workshop on the Mars Atmosphere : Modeling and Observations, Jan 2014, Oxford, United Kingdom.
pp.3105. �hal-01062215�
Microphysical simulations of mesospheric CO
2ice clouds and comparison to
observations
C. Listowski, LATMOS, UVSQ, ([email protected]), A. Määttänen, LATMOS, UVSQ,
CNRS , F. Montmessin, LATMOS, UVSQ, CNRS, A. Spiga, LMD, UPMC, F. Lefèvre, LATMOS, UPMC
Introduction:
Since the first unambiguous spectral detection of a CO2 ice cloud [15], how the main atmospheric
component of the martian atmosphere (∼95%) con-denses to form CO2 ice clouds in the mesosphere has
not been fully addressed theoretically. Mesospheric daytime clouds (reff~1 µm, τ~0.1) [15,16,22] and nighttime clouds (reff~0.1 µm, τ~0.01) [14] remain to be explained by modeling. [4] has been the only attempt to simulate daytime mesospheric clouds with a Martian GCM. Crystal sizes close although bigger than observed values for daytime clouds were ob-tained, but spatial and temporal coverage were not in agreement with observations [8].
A recent modeling study shows that thermal tides are a prerequisite for CO2 clouds formation and that
minimum temperatures predicted in the mesosphere by the LMD-GCM [6,8] are correlated with the ob-servations of mesospheric clouds [9]. However smaller scale processes are needed to attain CO2
su-persaturation in the mesosphere [9]. Furthermore, modeling has shown that locations where gravity waves are theoretically able to propagate up to the mesosphere are correlated with locations where CO2
ice clouds have been observed [18]. We thus simu-late for the first time wave-induced mesospheric CO2
ice clouds with a 1D-model, using temperature pro-files accounting for large-scale (thermal tides) and meso-scale (gravity waves) perturbations. Doing so, we follow for the first time a scenario already sug-gested by [3]: ”As a result CO2 ice clouds should form within the temperature minima of tidal and gravity waves in the Mars mesosphere, and be fairly common phenomena at low-to-mid latitudes during day and night times.”
We will present results obtained with the 1D-simulations of mesospheric CO2 ice clouds within
cold pockets created by gravity waves, and compare them to observations. Simple dust scenarios are pre-scribed to account for condensation nuclei, necessary to explain measured opacities.
Model and Method:
Mircophysical processes. A 1D microphysical
model previously used to simulate water ice clouds on Mars [12] was adapted to the mixture 95% CO2/
5% N2, following previous modeling studies of CO2
polar ice clouds [4,23]. The model goes up to 120 km altitude and the radius grid extends from 1 nm to
100 µm. We use heterogeneous nucleation, as it is the most likely process to trigger crystal growth in the martian mesosphere [15]. Vertical transport is implemented according to [19]. Sedimentation is corrected to account for vertical mixing param-eterized by a diffusion coefficient kd. Growth rate of
crystals is derived using the model of [11] adapted to the condensation of a near-pure vapor in a rarefied atmosphere, within highly supersaturated atmos-pheric layers (S>>1) [e.g. 7].
Trace-gas approximation. Pressure levels of the model are fixed. They remain fixed during cloud simulation despite CO2 condensation. If ma is the
mass of an atmospheric layer dma/ma≤1% as long as
dqice≤3.10-4, where dqice is the variation of the mass
mixing ratio of ice. We show that despite this limita-tion, mesospheric clouds in agreement with observa-tions can be simulated.
Temperature profiles. We use temperature
pro-files from meso-scale modeling obtained as ex-plained in [12]. Large-scale temperature profiles from the LMD-GCM [6] extending to the exosphere [8] are used to constrain the meso-scale domain where gravity waves are simulated. Discrepancies of large-scale temperature profiles between LMD-GCM outputs and measurements have been observed [7]. Thus it is necessary to shift the modeled temperature profile by a constant value to investigate a broad range of plausible mesospheric supersaturations. The gravity wave amplitude remains unchanged by this shift. Various supersaturated layers (cold pockets) are simulated, allowing for CO2 condensation at high
mesospheric altitudes (here, ≥70 km).
Dust profile. Equilibrium dust profiles are a result of sedimentation and vertical mixing processes. We use profiles which bracket average dust conditions as given by the Mars Climate Database [12], and are typical of epochs of CO2 cloud formation.
Figure 1 Vertical profile of mass mixing ratio of dust
from our model (black) compared to average dust content during CO2 cloud formation epochs (red) from [12], and compared to dust storm conditions (green) from [12].
Results:
Crystal Sizes. Typical size of 1 µm for daytime
clouds are obtained with a gravity wave causing a maximum S around 60 between 70 and 80 km alti-tude (Fig. 2). Typical sizes of 100 nm are simulated for nighttime clouds at around 90 km with a gravity wave causing S of a few hundreds (Fig. 3). Both cases are also in agreement with measurements of saturation ratios at the respective altitudes.
More generally, we show that the altitude of crystal formation is mainly responsible for their difference in sizes between daytime and nighttime clouds due to distinct condensation efficiencies at different at-mospheric pressures. The supersaturation amplitude has a secondary influence on the crystal size com-pared to the altitude of cloud formation.
Opacities.
Opacities are far below observed values, by several orders of magnitude, suggesting a lack of condensa-tion nuclei (CN). Dust profiles closer to dust content typical of dust storms and/or meteoritic supply can help to achieve the larger opacities observed (Fig. 4 and 5). Meteoritic input is prescribed in agreement with published estimations for Mars [5,17] and CN sizes are ≤10 nm as expected from terrestrial me-teoroid ablation simulations [2,10]
Discussion :
Supply of CN. Dust storm alone cannot explain the formation of optically thick CO2 ice clouds along
the whole period of observation (Ls=0°-140°), due to short residence time of particles. Thus, an exogenic supply of condensation nuclei seems necessary to account for the observation of thick clouds until Ls=140°. Meteoritic particles are a good candidate for condensation nuclei. Indeed, ablation of meteor-oids in the atmosphere, responsible for the formation of nanometric particles, theoretically occurs in the altitude range [1] where CO2 clouds form. In
addi-tion to that, electron layers of meteoritic origin have been observed in the altitude range 70–100 km [18] confirming the ablation altitude range.
Clouds and waves. The cloud evaporates fast after the cold pocket has vanished. This suggests a close link between the gravity wave passage and meso-spheric cloud formation. The cloud lifetime is related to the cold pocket lifetime and it seems unlikely to observe a cloud in a sub-saturated area. However the four cases of nighttime CO2 mesospheric clouds re-Figure 2 Effective radius of crystals (colorscale) versus
elapsed time, in a daytime cloud formed in a cold pocket (shaded area). Y-axis is pressure (left) and opacity at 1 µm.
Figure 3 Effective radius of crystals (colorscale) versus
elapsed time, in a nighttime cloud formed in a cold pocket (shaded area). Y-axis is pressure (left) and null opacity at 200 nm.
Figure 4 Effective radius of crystals (colorscale) versus
elapsed time, in a daytime cloud formed in a cold pocket (shaded area) with meteoritic flux of 10 nm particles. Y-axis is pressure (left) and opacity at 1 µm (right).
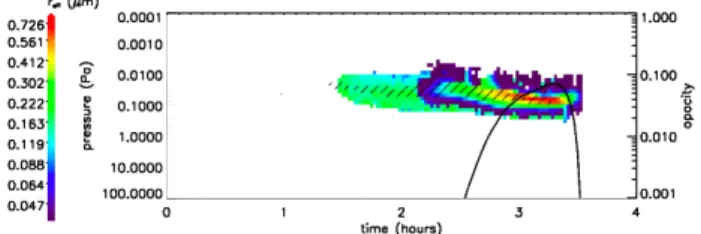
Figure 5 Effective radius of crystals (colorscale) versus
elapsed time, in a nighttime cloud formed in a cold pocket (shaded area) with meteoritic flux of 10 nm particles. Y-axis is pressure (left) and opacity at 200 nm (right).
ported by [14] show mostly clouds detected below the concomitant supersaturated layer. [14] explained this shift by the sedimentation of the cloud out of the cold pocket responsible of its formation, while [22] suggested a different composition for these clouds (H2O). We rather explain this shift by the behavior
of the cold pocket actually responsible of the cloud formation, which would have vanished, leaving the cloud in a sub-saturated air (Fig. 6). The clouds need to have been observed very soon after the cold pocket had vanished since the lifetime is of the order of ten minutes.
Conclusion :
We present the first time ever simulations of meso-spheric clouds within cold pockets created by gravity waves. We are able to reproduce the observed effec-tive sizes of CO2 cloud crystals at the corresponding
altitudes, but not the opacities, provided that we re-main with average dust conditions. An additional supply of nuclei is needed to explain the measured opacities. A likely candidate would be the meteoric particles coming from meteoroid ablation in the mesosphere. Gravity waves causing saturation ratios in accordance with observations allow simulating clouds in agreement with day and night observations. Finally, the temporal/spatial behavior of the cold pocket determines the temporal/spatial behavior of the cloud.
References :
[1] Adolfson et al., 1996
[2] Bardeen et al., JGR-A,113,17202, 2008 [3] Clancy and Sandor, GRL,25(4), 489–492,1998 [4] Colaprete, et al. PSS, 56, 150C,2008
[5] Flynn an McKay, JGR,95, 14497–14509, 1990 [6] Forget et a., JGR,104,E10, 1999
[7] Forget et al., JGRE, 114,E01004,2009
[8] Gonzalez-Galindo et al, JGR, 114, E04001, 2009 [9] Gonzalez-Galindo et al, 216, 10–22, 2011
[10] Hunten et al., J. Atmos. Sci. 37, 1342., 1980 [11] Listowski et al., JGR Planets, 118, 2013 [12] Millour et al.in: EPSC Congress, p. 302, 2012 [13] Montmessin et al., JGR, 107, 2002
[14] Montmessin et al., Icarus, 183, 2006 [15] Montmessin et al., JGR, 112, E11S90, 2007 [16] Määttänen et al., Icarus, 209,452–469, 2010 [17] Nesvorny et al., ApJ, 713,816–836, 2010 [18] Patzöld et al., Science 310, 837–839, 2005 [19] Spiga, and Forget, JGR., 114, E02009, 2009 [20] Spiga et al., GRL, 39, L02201, 2012
[21] Toon et al., JGR, 1994, 11359—11380, 1989 [22] Vincendon et al., JGR,116, 2011
[23] Wood, 1999, PhD, UCLA, 1999
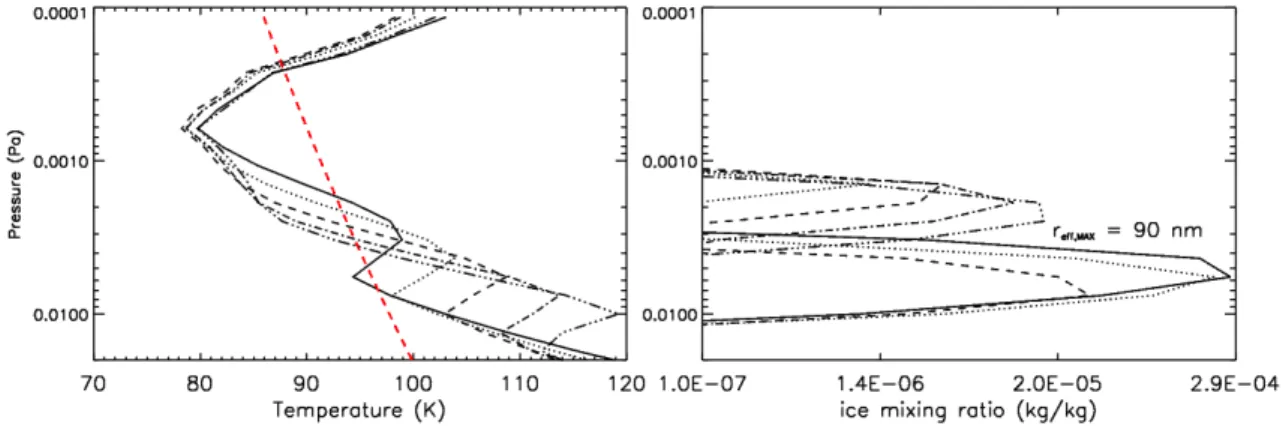
Figure 6 Selection of vertical profiles (plotted every 300 s.) of temperature (left) and ice mixing ratio (right) of the cloud
presented in Figure 5. The dashed line on the left plot represents the CO2 condensation temperature. A shift between the main cold pocket and the main cloud is observed.
![Figure 1 Vertical profile of mass mixing ratio of dust from our model (black) compared to average dust content during CO2 cloud formation epochs (red) from [12], and compared to dust storm conditions (green) from [12]](https://thumb-eu.123doks.com/thumbv2/123doknet/12897886.371149/2.892.513.757.903.1136/figure-vertical-profile-compared-average-formation-compared-conditions.webp)
![[PDF] Exercices structure de donnees et algorithmique avec correction detaille - Cours lgorithme](data:image/gif;base64,R0lGODlhAQABAIAAAP///wAAACH5BAEAAAAALAAAAAABAAEAAAICRAEAOw==)