HAL Id: hal-01524137
https://hal.archives-ouvertes.fr/hal-01524137
Submitted on 17 May 2017HAL is a multi-disciplinary open access archive for the deposit and dissemination of sci-entific research documents, whether they are pub-lished or not. The documents may come from teaching and research institutions in France or abroad, or from public or private research centers.
L’archive ouverte pluridisciplinaire HAL, est destinée au dépôt et à la diffusion de documents scientifiques de niveau recherche, publiés ou non, émanant des établissements d’enseignement et de recherche français ou étrangers, des laboratoires publics ou privés.
Effective temperature of ions in traveling wave ion
mobility spectrometry
Denis Morsa, Valerie Gabelica, Edwin de Pauw
To cite this version:
Denis Morsa, Valerie Gabelica, Edwin de Pauw. Effective temperature of ions in traveling wave ion mobility spectrometry. Analytical Chemistry, American Chemical Society, 2011, 83 (14), pp.5775-5782. �10.1021/ac201509p�. �hal-01524137�
This document is the unedited Author’s version of a Submitted Work that was subsequently accepted for publication in Analytical
Chemistry, 14(83), p. 5775-5782, copyright © American Chemical Society after peer review. To access the final edited and
published work see http://dx.doi.org/10.1021/ac201509p
Effective temperature of ions in traveling wave ion
mobility spectrometry
Denis Morsa, Valérie Gabelica*, Edwin De Pauw
Physical Chemistry and Mass Spectrometry Laboratory, Department of Chemistry, University of Liège, Institut de Chimie Bat. B6c, B-4000 Liège, Belgium.
AUTHOR EMAIL ADDRESS: v.gabelica@ulg.ac.be
RECEIVED DATE
ABSTRACT. Traveling wave ion mobility spectrometers (TW IMS) operate at significantly higher fields than drift tube ion mobility spectrometers. Here we measured the fragmentation of the fragile p-methoxybenzylpyridinium ion inside the TW ion mobility cell of the first-generation SYNAPT HDMS spectrometer. The ion’s vibrational internal energy was quantified by a vibrational effective temperature Teff,vib, which is the mean temperature of the ions inside the cell that would result in the same
fragmentation yield as observed experimentally. Significant fragmentation of the probe ion inside the TW IMS cell was detected, indicating that field heating of the ions takes place in TW IMS. For typical small molecule IMS conditions, Teff,vib = 555 ± 2 K. The variations of the effective temperature were
studied as a function of the IMS parameters, and we found that Teff,vib decreases when the wave height
decreases, when the pressure increases, or when the wave speed increases. The energy transfer efficiency of argon is higher than for He, N2 or CO2. Teff,vib being directly related to the ion speed inside
INTRODUCTION
Ion mobility spectrometry (IMS) allows the separation of ions based on their three-dimensional structure. Whether used as a standalone separation method,1-3 or hyphenated to mass spectrometry, IMS
has found numerous applications encompassing separation and structural studies of small molecules, polymers, proteins and nucleic acids, synthetic supramolecular assemblies and biologically relevant complexes.4-7
Ion mobility separation is based on ion transport properties in gases, under the influence of an electric field.8;9 Different types of mobility cells exist, differing by the magnitudes of the electric field E and of
the gas number density N. Drift tube (DT) IMS cells operate at constant field, and at low E/N ratios. The ions move in the field direction at a drift velocity v that depends on their mobility K as stated by Equation (1).
∙ (1)
where K0 is the ion reduced mobility defined at standard temperature (T0 = 273.16 K) and pressure (p0
= 760 Torr). At low E/N conditions, the ion drift motion does not significantly disturb its thermal motion, and K0 can be expressed quantitatively by the Mason-Schamp equation (Eq. 2),
/
(2)
Where q is the ion charge, µ is the reduced mass , where M is the mass of the gas and m is the mass of the ion), k is the Boltzmann constant, T is the gas temperature, and is the collision cross section.
Commercial IMS-MS instruments are currently based on other IMS methods involving higher fields, namely field-assisted waveform IMS (FAIMS),10 or traveling wave IMS (TW IMS).11;12 The use of
higher E/N ratios raises fundamental questions regarding the ion transport regime. Indeed, when this ratio increases, the ion drift velocity v becomes significantly higher than the ion’s thermal velocity, and thus has to be accounted for in the ion transport equations.8 Assuming elastic collisions between the ion
and the gas, the Mason-Schamp equation can still be used provided that the gas temperature Tgas is
replaced by an effective temperature Teff (Eq. 3) that accounts for the field contribution:
² (3)
The possibility that Teff might be significantly higher than Tgas when E/N increases has important
implications. First, the knowledge of its value is crucial for a rigorous interpretation of mobility measurements in terms of ion shapes via the collision cross sections. Intriguingly, recent reports show that TW IMS calibration of against td is not as universal as initially postulated.13-15 Bush et al.15 have
shown that calibrating with denatured proteins leads to significant errors in the determination of collision cross sections of native proteins. Other recent reports show that the accuracy of the collision cross section calibration depends on wave height,16 and even more on the wave velocity.16;17 These
findings could reflect that ion transport in TW IMS is not exactly the same as in DT IMS, and that high field effects on the ion transport might be involved.
The second implication is that translational energy can be converted into rotational and vibrational internal energy18 via inelastic collisions.19 This point has already been raised for TW IMS by
Shvartsburg and Smith,20 and is also crucial for relating ion mobility data to the ion’s shape.21
Vibrational excitation can indeed cause modifications of ion geometries (and therefore of ) because different conformational states of the molecule can become populated. At extreme cases, vibrational excitation could even lead to fragmentation of the ion inside the IMS cell, like in collision-induced dissociation (CID). Therefore, in order to devise guidelines for properly using TW IMS to infer structural information, it is crucial to assess whether field heating causes significant increases of the ion’s internal energies. Here we used the well-established survival yield method22-25 to determine the
vibrational effective temperature of a small benzylpyridinium ion inside a commercial TW IMS instrument.
METHODS
Chemicals. The methoxybenzylpyridinium salt was synthesized by condensation of the
p-methoxybenzyl chloride with pyridine. The recrystallized salt was solubilized with acetonitrile/water (50/50) and injected at 10-6 mol/L.
Instrument. All measurements were performed on a first-generation Synapt HDMS spectrometer
(Waters, Manchester, U.K.) with samples introduced by electrospray. Pressure in the IMS was measured using both a pirani gauge and a gas-independent capacitance gauge (Oerlikon Leybold Vaccum, CERAVAC CTR 90) linked to a vacuum controller (Vacom, MVC-3 UHV Multichannel Vacuum Controller). These were connected to the same inlet. All pressures reported in this work are those measured with the capacitance gauge. Instrument default set up and a table listing the corresponding pressure values between Pirani and capacitance gauge are provided in Supporting Information S1 and S2, respectively.
Calculation of the ion vibrational effective temperature. We studied the fragmentation reaction of
p-methoxybenzylpyridinium ions (m/z = 200) which leads to the formation of p-methoxybenzyl cations (m/z = 121) and neutral pyridine. All arrival time distributions were analyzed with Peakfit, Systat Software (v. 4.11) and peaks were fitted using an exponentially modified Gaussian (EMG). Peak areas related to the precursor ions Aprecursor and to the fragment ions Afragment were quantified and used to
calculate fragmentation yields (FY) and survival yields (SY) as given by Equation 4.
1 (4)
Teff,vib is defined as the mean temperature of the ions that would result in the same survival yield as
experimentally observed. Because numerous collisions with the gas are at the basis of IMS, we can safely assume that the ions inside the TW IMS undergo sufficiently frequent low energy collisions so
that the ion population can be characterized by a Boltzmann distribution at a temperature Teff,vib all along
the cell. For each measurement, the temperatures were calculated from the survival yields according to a method previously described in the literature22-25 and detailed in Supporting Information S3-S5. All
arrival time distributions were recorded at least three times for each set of experimental conditions, and processed independently for extracting FY, SY, and the drift time td. All Teff,vib data presented here report
the mean values and standard deviations of at least three independent measurements and data treatments.
Estimation of the average ion speed inside the TW IMS. As will be discussed further below, both
Teff (Eq. 4) and Teff,vib are related to the ion speed v. In TW IMS, the ion speed is different from the
experimentally accessible apparent drift velocity , which is equal to the tube length (L = 185 mm) divided by the corrected drift time see Supporting Information S4). The mathematical description of traveling wave ion guides given by Shvartsburg and Smith20 allows to relate the average ion speed v to
the apparent drift velocity and the wave speed s. For the Synapt HDMS, v was estimated by using Equation 5 (see derivation in Supporting Information S6).
² ∙
RESULTS AND DISCUSSION
Fragmentation before, after, and inside the TW IMS
Product ion spectra of the para-methoxybenzylpyridinium ion (M+, m/z = 200) recorded in the ion
mobility mode revealed significant fragmentation into para-methoxybenzyl (F+, m/z = 121), even when
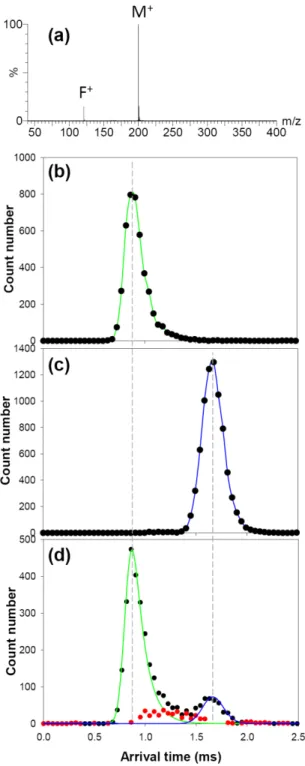
recorded at the lowest possible trap and transfer collision energies. A typical product ion spectrum is shown in Figure 1(a). The fragments F+ detected are due to M+ fragmentation after the quadrupole and
before the TOF pusher. This can be in the trap T-wave, in front of the IMS cell, inside the IMS cell, and/or in the transfer T-wave. As the goal is to characterize ion heating inside the TW IMS cell, we will use the arrival time distribution of the fragments to extract the contribution due to fragments formed inside the TW IMS.
The arrival time of an ion is equal to the time elapsed between its entrance in the TW IMS cell and the moment it reaches the TOF pusher. The ATD of fragments formed in the source and selected in the quadrupole is shown in Figure 1(b). This ATD is therefore representative of fragments formed before the TW IMS. Figure 1(c) shows the ATD of precursor ions selected in the quadrupole and detected as precursors. The two ATDs of Figures 1(b) and 1(c) give the key to interpret the ATD of the fragments formed after selection of the precursor M+ in the quadrupole. Fragments formed before the TW IMS
have the same ATD as selected fragments in Figure 1(b), whereas fragments formed after the TW IMS have the same ATD as selected precursors in Figure 1(c) because they travelled inside the TW IMS as precursor ions.
A typical experimental ATD of fragments formed from the precursors selected in the quadrupole, i.e. the ATD reconstructed for the m/z = 121, is shown in Figure 1(d). This ATD shows three contributions. The one at earliest arrival times (in green) corresponds to fragments formed before the TW IMS, for example in the trap region. The one at latest arrival times (in blue) corresponds to fragments formed
after the TW IMS, for example in the transfer region. The third contribution (in red) is constituted by fragments arriving at intermediate times. It corresponds to fragments that spent part of their time in the TW IMS as precursor ions and part of their time as fragment ions, and therefore it corresponds to fragments formed inside the TW IMS.
In order to determine the fragmentation yields in the different regions of the mass spectrometer, the ion counts from the different contributions were integrated. The area of the precursor ion (AM) was
integrated from the total ATD at m/z = 200. To separate the different contributions in each fragment ion ATD, the curves corresponding to fragments formed purely before IMS and to those formed purely after IMS were fitted to extract the peak shapes of these contributions. Then, the experimental ATD of the fragment formed from the selected precursor ion (Figure 1(d)) was fitted with two peaks having the shapes determined from Figures 1(b) and 1(c). Only the peak height was allowed to vary. These fitted peaks were integrated to give A(F,before) and A(F,after), the peak areas corresponding to the fragment formed
before and after the TW IMS cell, respectively. Finally, these two fitted peaks were subtracted from the experimental data to obtain the ion counts corresponding to fragments formed inside the TW IMS (red contribution in Figure 1(d)). Integrating this contribution gave A(F,inside).
Based on these areas, the fragmentation yields (FY) of the parent ion before, inside, and after the IMS were calculated using adequate expressions of Equation 4 (see detailed equations in Supporting Information S7). To prove that the peak assignment and the data treatment are fundamentally correct, we determined the three fragmentation yields as a function of the trap collision energy, which should only affect FYbefore, and as a function of the transfer collision energy, which should only affect FYafter.
The results in Figures 2(a) and 2(b) show that only the expected fragmentation yields are affected, thereby validating our approach.
Figure 1. Mass spectra and arrival time distributions (ATDs) recorded on the Synapt HDMS with the
following settings: bias = 13V, CE1/CE2 = 2V, wave height = 13V, wave speed = 600 m/s, N2 pressure
= 0.516 mbar. (a) Product ion spectrum of the para-methoxybenzylpyridinium ion M+ (m/z = 200). The
para-methoxybenzyl fragment ion F+ (m/z = 121) is detected. (b) ATD of F+ when selecting m/z = 121
in the quadrupole. (c) ATD of M+ when selecting m/z = 200 in the quadrupole. (d) ATD of F+ (m/z =
121) when selecting the precursor ion at m/z = 200 in the quadrupole. The contribution shown in green is similar to the ATD of F+ in (b), the one shown in blue is similar to the ATD of M+ in (c). The remaining
Figure 2. Effect of strategic potential differences on the fragmentation occurring before, inside and after
the mobility cell. (a) Influence of the trap collision energy (bias = 13V, Transfer CE = 2V, wave height = 13V, wave speed = 600 m/s, N2 pressure = 0.516 mbar. (b) Influence of the transfer collision energy
In a similar experiment, we tested the effect of the bias voltage, which is the acceleration voltage between the last lens before the IMS and the IMS itself, to determine whether increasing the bias was causing fragmentation before and/or inside the IMS. The results in Figure 2(c) reveal that the bias voltage has a dramatic influence on the fragmentation contribution before the IMS. The role of the bias voltage is to accelerate the ions from the lower pressure region of the trap to the higher pressure region of the IMS. It is already known that the bias must be kept low to reduce ion fragmentation, but this is detrimental to the ion transmission. Typical bias voltages recommended for intact protein analysis are 20-60 V.13 With our fragile probe ion, fragmentation is detected already at a bias voltage as low as 10
V.
Moreover, Figure 2(c) shows that fragmentation occurs mostly before the IMS. This observation is consistent with activation taking place in front of the IMS cell and imparted by collisions with the gas leaking out from the front and end apertures of the mobility cell. At bias voltages between 10 V and 19 V, although the fragmentation before the IMS is abundant, the fragmentation inside the IMS remains low. This suggests that precursor ions are significantly heated just before the IMS cell, and then cooled down once entering the IMS cell. All subsequent measurements aimed at investigating the effect of the TW IMS cell parameters on the effective vibrational temperature of the ions were carried out at a bias voltage of 10 V in order to minimize the contribution to fragmentation due to the bias acceleration.
On the interpretation of Teff,vib
As a starting point, we determined the ion temperature using a set of IMS parameters typically recommended by the manufacturer (wave height = 9 V, wave speed = 600 m/s, IMS gas: N2 pirani
reading = 0.55 mbar, i.e. p = 0.516 mbar as measured with the capacitance gauge). Other acceleration voltages were kept low (Bias = 10 V, trap collision energy = 2 V and transfer collision energy = 2 V). These values were selected to ensure the best compromise between transmission and separation of analyzed species. For these conditions, we found Teff,vib = 555 ± 2 K. If we assume a bath gas temperature
Tgas = 300 K, this corresponds to a field contribution to ion heating Tfield = 255 ± 2 K, which indicates a
significant field heating of ions.
The effective vibrational temperature should be proportional to the relative kinetic energy of collision between the ion and the gas Ekin,rel, which is the maximum amount of kinetic energy that can be
transformed into ion internal energy per collision.19 E
kin,rel is given by Equation 6, where v is the ion
velocity in the laboratory frame of reference, and µ is the reduced mass.
Teff,vib Ekin,rel = ½ µ v² (6)
In the traveling wave ion guide, the ions alternatively move forward and backwards depending on whether they are on the front side or on the rear side of a wave, respectively. The average Teff,vib therefore
depends on the ions’ average speed v (the speed is the absolute value of the velocity), independently of whether the ions move forward or backwards, because the relevant parameter is their relative collision energy compared to the gas, which is considered as static on average. The value of Teff,vib is thus an
Influence of the wave height and pressure on the ion temperature
In steady state conditions the ion velocity v depends on E/N (Equation 1). Experimental variables affecting the E/N ratio will therefore be discussed jointly. The gas number density N is directly proportional to the gas pressure p, while the average electric field intensity E is directly proportional to the wave height. The influence of the gas pressure on the ion effective temperature at constant wave height is illustrated in Figure 3(a). All the other instrumental parameters remaining unchanged, the ion temperature decreases from 706 K to 555 K when the pressure increases from 0.275 mbar to 0.516 mbar. The influence of the wave height on the ion effective temperature, at three different pressures, is illustrated on Figure 3(b). Teff,vib increases when the wave height increases. The offset between the curves
is due to the pressure effect.
As explained in Eq. (6), Teff,vib should be proportional to the ion speed squared v², which should be
proportional to E²/N² (Eq. 1). To test this hypothesis, we estimated v² as described in Equation (5) and Supporting Information S6. The plot of Teff,vib as a function of v² is shown on Figure 3(c). The
experimental points reported on Figure 3(b) are now more closely bunched together, although a slight offset persists, which can be due to the approximations behind the estimation of v from the drift times.
Overall, changing either the wave height or the gas pressure has a similar effect on the ion effective temperature. The analyst willing to obtain the lowest effective temperature should therefore tune either the wave height or pressure so as to diminish the ion velocity v. At constant wave speed s, this means tuning to lower the apparent drift velocity , and therefore to increase the apparent drift time td
Figure 3: Influence of pressure, wave height and ion drift speed on Teff,vib . Conditions were set as
follows: bias = 10V, trap/transfer CE = 2V, wave speed = 600 m/s, gas = N2. (a) Evolution of Teff,vib as
Influence of the wave speed on the ion temperature
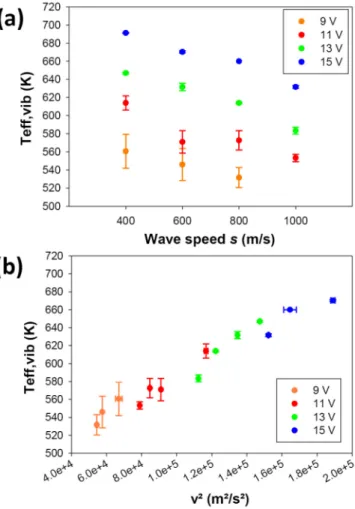
To investigate the influence of the wave speed s on Teff,vib, the pressure was kept constant and the
effect of the wave speed was studied at different wave heights. The results on Figure 4(a) show that
Teff,vib decreases when s increases. This means that the average ion speed v decreases when s increases.
When v is estimated from and s using Equation (5), v indeed decreases when s increases. Figure 4(b) shows the correlation between Teff,vib and v². Even if the alignment of the data points is not perfect
given the experimental error, this figure confirms that v estimated using Eq. (5) is on first approximation a good predictor of the ion effective temperature. Supporting Information S9 shows additional data as a function of the wave height, with wave speeds ranging from 400 to 1500 m/s.
Figure 4: (a) Influence of wave speed s on Teff,vib. Conditions were set as follows: bias = 10 V,
trap/transfer CE = 2V, N2 pressure = 0.516 mbar. Four series of wave height were studied: 9 V, 11 V,
13 V and 15 V. Wave speed was varied between 400 m/s and 1000 m/s. (b) Correlation between the ion apparent speed squared v² and Teff,vib.
The fact that the ion speed v changes with the wave speed s reveals an interesting aspect of the ion movement in TW IMS. In effect, the wave speed s affects neither the electric field E nor the gas number density N, so it should not affect the E/N ratio. If the ions could reach the steady state drift velocity v = KE at every time point in the TW IMS, v should actually be independent of s. The fact that v decreases when s increases therefore indicates that the ions do not always have time to reach their steady state drift velocity KE. In other words, the ions cannot instantaneously accommodate for the changes of electric field intensity and/or direction. Therefore, in TW IMS, instead of Equation (1) one should take into account that:
(7)
Higher wave speeds induce a larger inequality, because the ions have less time to keep up with the field changes. This is important for the understanding of the ion movement in TW IMS, but also for extracting ion mobilities K from the apparent drift velocities . The equations expressing the as a function of KE for TW IMS20 currently assume that v is equal to KE at all times. Our results suggest
Influence of the gas (He, N2, Ar, CO2) on ion heating
Nitrogen is the most often used gas in TW IMS, because it allows good transmission and separation of most analytes. Helium is however typically used in drift tube IMS for structural analysis by comparison between experimental and theoretical collision cross sections. Finally, argon and carbon dioxide can be used to enhance separation of some analytes.26-29 We investigated the effect of the nature
of the gas on the ion field heating in TW IMS.
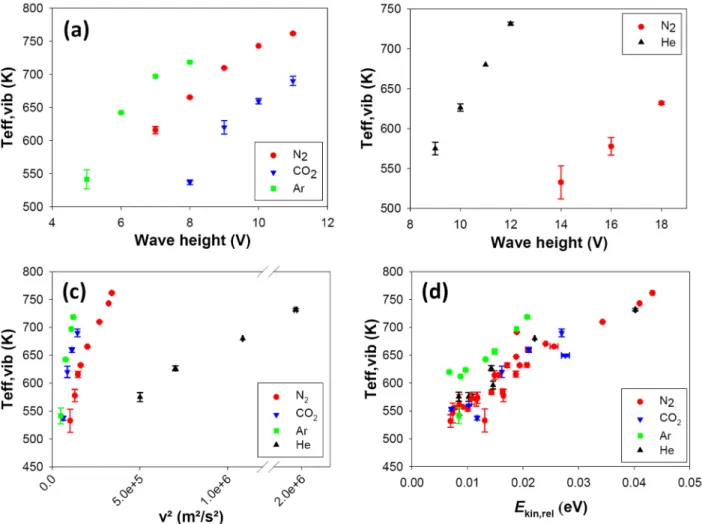
Figure 5(a-b) shows the evolution of Teff,vib as a function of the wave height. Not all four gases could
be compared at the same pressure and the same wave speed. In conditions adequate for N2, Ar and CO2
(s = 600 m/s, p = 0.275 mbar, Figure 5(a)), the very high mobility of ions in helium induces a coalescence of the ATD peaks that makes the contribution inside the IMS impossible to quantify. Helium was therefore compared to nitrogen at p = 0.516 mbar and s = 1500 m/s in Figure 5(b). Note also that the bias had to be increased to 24 V in He, compared to 10 V in the other gases. We checked that this did not influence FYinside.
We can see from these figures that, all IMS instrumental parameters (wave height, wave velocity and pressure) being equal, ion heating ranks as follows: He > Ar > N2 > CO2. It seems counterintuitive that
helium induces more heating than heavier gases, but the nature of the gas greatly affects the ion mobility K0, both because via the reduced mass µ and the collision cross section (see Equation 2). When the
ion temperatures are compared at a given ion speed squared v² (Figure 5c), the ranking becomes Ar > CO2 > N2 > He.
As explained above, the ion internal temperature is expected to depend on the relative kinetic energy
Ekin,rel, which is the maximum kinetic energy transferrable into internal energy. From the estimated ion
speed v and the reduced mass of the system, the relative kinetic energy per collision can be estimated using Equation (6). The correlation between Teff,vib and Ekin,rel is shown in Figure 5(d). This figure gathers
all the datapoints collected throughout this study, because we have shown before that the calculation of v using Equation (5) provides a good estimate that correlates well with Teff,vib for a given gas. This graph
shows that the effect of the reduced mass on Ekin,rel suffices to explain the ranking between CO2, N2 and
He. In contrast, the argon data deviate significantly from those obtained in the three other gases. Collisions with argon at a given Ekin,rel convert kinetic energy into internal energy more efficiently.
Several reasons can explain differences of energy transfer efficiency between gases. Monoatomic gases are more efficient for ion heating than polyatomic gases because the latter can take away part of the total energy as vibrational and rotational energy.30 This explains that CO
2 is causing less ion heating
than argon even though it is slightly heavier. Argon is also causing more ion heating than helium, although both are monoatomic gases. This could be due to the higher polarizability of argon, which would either favor the formation of a sticky complex in which the total energy can be redistributed,19
and/or induce some argon acceleration towards the ion just before the collision.31 Note also that a higher
actual Ekin,rel than predicted from v is expected, because the relevant kinetic energy for energy transfer
it is the kinetic energy just before the collision and not the average kinetic energy. The magnitude of that deviation can also depend on the target gas. Overall, given the experimental errors of our study, only argon showed a significantly enhanced ion heating compared to helium, nitrogen and CO2. Xenon
Figure 5: Influence of the nature of the gas on ion vibrational effective temperature Teff,vib. (a)
Comparison between nitrogen (N2), carbon dioxide (CO2) and argon (Ar) as a function of wave height.
Gas pressure = 0.275 mbar, wave speed = 600 m/s, bias = 10 V. (b) Comparison between helium (He) and nitrogen (N2) as a function of wave height. Gas pressure = 0.516 mbar, wave speed = 1500 m/s,
bias = 24 V (He) – 10 V (N2 (c) Correlation between the drift velocity squared v² and Teff,vib for N2, CO2,
CONCLUSIONS
Our results demonstrate a significant field heating of the p-methoxybenzylpyrdinium ion (m = 200 Da, z = 1) inside the TW IMS. We obtained vibrational effective temperatures Teff,vib ranging between
500 K and 800 K. The temperature can be decreased by lowering the wave height, increasing the gas pressure, or increasing the wave velocity. However, to obtain reasonable ion mobility separation in this mass range on a first-generation Synapt HDMS mass spectrometer, the effective temperature cannot be decreased below 500 K. Preliminary results on a second-generation Synapt G2 HDMS mass spectrometer, operated at higher pressure and wave height than the Synapt G1 HDMS, show effective temperatures ranging between 600K and 700K (manuscript in preparation), suggesting that this is a general feature of travelling wave ion mobility spectrometers.
The fact that Teff,vib is higher than the gas temperature has several implications:
(1) The evolution of Teff,vib with the wave height, gas pressure and wave speed highlights that Teff,vib
is related to v (the ion speed in the laboratory frame of reference, see Eq. 15). In that respect, the study of Teff,vib also reveals important aspects of the ion motion in TW IMS. The wave speed s affects Teff,vib,
and thus the drift speed v of ions, although it has no impact on K or E. This reveals that ions cannot instantaneously accommodate for the changes of electric field induced by the waves.
(2) Collisions in the TW IMS are inelastic, i.e. they result in a transfer of relative translation energy into internal energy of the analyte. The collision regime is therefore different in TW IMS than in DT IMS. In DT IMS, ion motion in the direction of the electric field is negligible compared to thermal motion and the ions are at the gas temperature. In TW IMS, the field contribution to ion velocity
regime is different in TW IMS than in DT IMS, with a switch to “high field” conditions caused by the higher E/N ratios at stake in the traveling wave ion guide.
(3) Stating the obvious is to say that, if collisions are inelastic, it means that the colliding partners do not behave as hard spheres. This is important in the interpretation of the collision cross section itself, which is actually a momentum transfer collision integral. When the ion-gas collision model deviates from the hard spheres limit, ion-gas interaction potentials come into play, and the collision cross section itself becomes dependent on the temperature.32 In other words, should become (T
eff)
if field heating is significant.
(4) The fact that Teff,vib is higher than the gas temperature also implies that the effective temperature
in the Mason-Schamp equation, Teff (Eq. 2), is higher than the gas temperature. Therefore, the expected
dependence of Teff with the ion mass and charge has also important implications on the collision cross
section calibration. Indeed, the usual calibration procedure consists in measuring the drift time td in TW
cells for ions of known . The collision cross section is corrected to account for both q and μ. However, the fact that the ion mobility depends on Teff, and that Teff could change from ion to ion, is not currently
taken into account in the calibration procedure. This may explain why calibration with denatured proteins (high charge-to-mass ratios) is not reliable for native proteins (low charge-to-mass ratios):15
they do not have the same effective temperature. Future work will be devoted to take the effective temperature into account for collision cross section calibration of TW IMS. Meanwhile, it is advisable to calibrate TW IMS with ions of similar masses and charges as the analyte.
An important question is how the effective temperature changes with the nature of the ion. In the present study, we investigated the field heating of a single analyte (m = 200 and z = 1) and demonstrate a strong correlation between Teff,vib and v. This last parameter is related to the ion mobility K (Eq. 1)
q, reduced mass µ, and collision cross section Ω). Therefore, based on Equation (2), we can anticipate that larger ions should, at equivalent charge, be less heated than small entities as their progression in the gaseous medium is slower. However the mobility increases with the charge, and therefore multiply charged ions of large molecules could still be significantly heated. Further experiments need to be carried out in order to confirm these trends.
To conclude, the use of TW IMS for structural studies must be considered with care, because the ion heating could in some instances be significant enough to alter ion structures while they are crossing the mobility cell. This is a disadvantage if the goal is to preserve the solution-phase structures, and if these are unstable at higher internal temperatures. Relatively fragile small molecules (like the benzylpyridium ion) or non-covalent complexes observed at relatively high z/ ratios are more likely to be concerned than large native protein complexes, typically analyzed at relatively low charge states compared to their size. On the other hand, field heating of the ions could also be exploited by modulating the T-wave instrumental parameters, as a convenient way of changing the ion temperature and exploring conformational dynamics.
ACKNOWLEDGMENT. The authors thank the FRS-FNRS (Research associate position to VG, FRFC 2.4.589.08.F to EDP), and the FEDER funds (EU) for financial support. Dr. Christian Bleiholder is acknowledged for useful comments on the temperature dependence of the collision cross section.
Supporting Information Available. Correspondence between Pirani and capacitance gauge pressure
measurements, details of vibrationnal effective temperature calculation, derivation of Equation (5), detailed calculation of FY before, inside and after IMS, additional data as described in text, are available at http://pubs.acs.org.
REFERENCES
1. Ewing, R. G.; Atkinson, D. A.; Eiceman, G. A.; Ewing, G. J. Talanta 2001, 54, 515-529. 2. Eiceman, G. A.; Stone, J. A. Anal.Chem. 2004, 76, 390A-397A.
3. Makinen, M. A.; Anttalainen, O. A.; Sillanpaa, M. E. Anal.Chem. 2010, 82, 9594-9600. 4. Bowers, M. T.; Kemper, P. R.; vonHelden, G.; Vankoppen, P. A. M. Science 1993, 260,
1446-1451.
5. Clemmer, D. E.; Jarrold, M. F. J.Mass Spectrom. 1997, 32, 577-592.
6. Wyttenbach, T.; Bowers, M. T. Modern Mass Spectrometry 2003, 225, 207-232.
7. Kanu, A. B.; Dwivedi, P.; Tam, M.; Matz, L.; Hill, H. H., Jr. J.Mass Spectrom. 2008, 43, 1-22. 8. Revercomb, H. E.; Mason, E. A. Anal.Chem. 1975, 47, 970-983.
9. Mason, E. A.; McDaniel, E. W. Transport properties of ions in gases, Wiley-VCH Verlag GmbH & Co. KGaA.: Weinheim, Germany, 1988.
10. Guevremont, R. J.Chromatogr.A 2004, 1058, 3-19.
11. Giles, K.; Pringle, S. D.; Worthington, K. R.; Little, D.; Wildgoose, J. L.; Bateman, R. H. Rapid Commun.Mass Spectrom. 2004, 18, 2401-2414.
12. Thalassinos, K.; Slade, S. E.; Jennings, K. R.; Scrivens, J. H.; Giles, K.; Wildgoose, J.; Hoyes, J.; Bateman, R. H.; Bowers, M. T. Int.J.Mass Spectrom. 2004, 236, 55-63.
13. Ruotolo, B. T.; Benesch, J. L.; Sandercock, A. M.; Hyung, S. J.; Robinson, C. V. Nat.Protoc.
2008, 3, 1139-1152.
14. Smith, D. P.; Knapman, T. W.; Campuzano, I.; Malham, R. W.; Berryman, J. T.; Radford, S. E.; Ashcroft, A. E. Eur.J.Mass Spectrom.(Chichester, Eng) 2009, 15, 113-130.
15. Bush, M. F.; Hall, Z.; Giles, K.; Hoyes, J.; Robinson, C. V.; Ruotolo, B. T. Anal.Chem. 2010, 82, 9557-9565.
16. Michaelevski, I.; Eisenstein, M.; Sharon, M. Anal.Chem. 2010, 82, 9484-9491. 17. Zhong, Y.; Hyung, S. J.; Ruotolo, B. T. Analyst 2011, doi: 10.1039/C0AN00987C.
18. Vékey, K. J.Mass Spectrom. 1996, 31, 445-463.
19. McLuckey, S. A. J.Am.Soc.Mass Spectrom. 1991, 3, 599-614. 20. Shvartsburg, A. A.; Smith, R. D. Anal.Chem. 2008, 80, 9689-9699.
21. Shvartsburg, A. A. Differential ion mobility spectrometry. Nonlinear ion transport and fundamentals of FAIMS., Taylor & Francis Group, LLC: Boca Raton, FL, 2009.
22. Drahos, L.; Heeren, R. M. A.; Collette, C.; De Pauw, E.; Vékey, K. J.Mass Spectrom. 1999, 34, 1373-1379.
23. Collette, C.; De Pauw, E. Rapid Commun.Mass Spectrom. 1998, 12, 165-170.
24. Collette, C.; Drahos, L.; De Pauw, E.; Vékey, K. Rapid Commun.Mass Spectrom. 1998, 12, 1673-1678.
25. Gabelica, V.; De Pauw, E. Mass Spectrom.Rev. 2005, 24, 566-587.
26. Matz, L.; Hill, H. H. Jr.; Beegle, L. W.; Kanik, I. J.Am.Soc.Mass Spectrom. 2002, 13, 300-307. 27. Beegle, L. W.; Kanik, I.; Matz, L.; Hill, H. H. Int.J.Mass Spectrom. 2002, 216, 257-268. 28. Asbury, G. R.; Hill, H. H. Anal.Chem. 2000, 72, 580-584.
29. Howdle, M. D.; Eckers, C.; Laures, A. M. F.; Creaser, C. S. Int.J.Mass Spectrom. 2010, 298, 72-77.
30. Hoxha, A.; Collette, C.; De Pauw, E.; Leyh, B. J.Phys.Chem.A 2001, 105, 7326-7333. 31. Raznikov, V. V.; Kozlovsky, V. I.; Dodonov, A. F.; Raznikova, M. O. Rapid Commun.Mass
Spectrom. 1999, 13, 370-375.
32. Wyttenbach, T.; vonHelden, G.; Batka, J. J.; Carlat, D.; Bowers, M. T. J.Am.Soc.Mass Spectrom. 1997, 8, 275-282.