HAL Id: hal-00000446
https://hal.archives-ouvertes.fr/hal-00000446
Submitted on 25 Jun 2003
HAL is a multi-disciplinary open access
archive for the deposit and dissemination of
sci-entific research documents, whether they are
pub-lished or not. The documents may come from
teaching and research institutions in France or
abroad, or from public or private research centers.
L’archive ouverte pluridisciplinaire HAL, est
destinée au dépôt et à la diffusion de documents
scientifiques de niveau recherche, publiés ou non,
émanant des établissements d’enseignement et de
recherche français ou étrangers, des laboratoires
publics ou privés.
Investigating the reasons for the failure of paleointensity
experiments: a study on historical lava flows from Mt.
Etna (Italy)
Manuel Calvo, Michel Prévot, Mireille Perrin, Janna Riisager
To cite this version:
Manuel Calvo, Michel Prévot, Mireille Perrin, Janna Riisager. Investigating the reasons for the failure
of paleointensity experiments: a study on historical lava flows from Mt. Etna (Italy). Geophysical
Journal International, Oxford University Press (OUP), 2002, 149, pp.44-63. �hal-00000446�
Investigating the reasons for the failure of palaeointensity
experiments: a study on historical lava flows from Mt. Etna (Italy)
Manuel Calvo,
1Michel Pr´evot,
2Mireille Perrin
2and Janna Riisager
31Dpto. de F´ısica. Escuela Polit´ecnica Superior. Universidad de Burgos. Av. Cantabria, s/n. 09006 Burgos, Spain. E-mail: mcalvo@ubu.es 2G´eophysique, Tectonique et S´edimentologie, URM CNRS-UMII 5573, Universit´e Montpellier II CC060, 34095 Montpellier Cedex 5, France 3Geological Museum, University of Copenhagen, Øster Voldgade 5-7, 1350 Copenhagen K, Denmark
Accepted 2001 September 21. Received 2001 September 21; in original form 2000 July 3
S U M M A R Y
A refined palaeointensity experiment, accompanied by rock-magnetic studies, has been carried out on six lava flows from 1910 and 1928 from Mt. Etna. The purpose of the study was to try to understand why these very young basaltic flows are generally unable to provide a correct estimate of the magnitude of the ambient magnetic field during flow cooling. Susceptibility versus temperature curves and ore microscopic studies show that 3 types of magnetic minerals (phases ‘h’, ‘m’ and ‘l’) are present in these flows, some samples containing a single largely dominant magnetic phase while others contain a mixture of several phases. Phase ‘h’ is a thermally stable, near magnetite phase resulting from titanomagnetite oxyexsolution. Phase ‘l’ is a thermally stable titanomagnetite with a Curie temperature of approximately 200◦C.
Phase ‘m’ is a titanomagnetite phase of Curie temperature between 450–490◦C which is
un-stable at temperatures above 400◦C. In addition to the usual reliability checks of the Thellier
method (NRM-TRM linearity, pTRM checks), our palaeointensity experiments included ad-ditional heating allowing determination of the MD or PSD-SD character of each pTRM and determination of CRM or transdomain remanences possibly acquired during heating. From the 28 samples studied 20 provide a linear NRM-TRM plot over about 1/4 or more of total NRM. However, only six of them, all containing near-magnetite as a single phase, display positive pTRM checks. Nevertheless, these six samples yield a mean palaeointensity of about 52 µT, which exceeds the real field palaeomagnitude (42 µT) by some 25 per cent. The rea-sons for this almost-total failure of palaeointensity experiments are diverse. For samples with a dominant ‘l’ phase, pTRMs present a behaviour typical of large MD grains, with as much as 1/3 of remanence with unblocking temperatures exceeding the blocking range. No CRM is acquired. Yet a remanence does develop during heating in a field (followed by cooling in zero field). We suggest that this remanence is a transdomain remanence resulting from domain rearrangements. These two observations are in conflict with some of the basic requirements of the Thellier method. Phase ‘m’ seems chemically stable up to 400◦C but pTRM changes start at
lower temperatures. This thermal instability and the development of a significant transdomain remanence seem to be the causes of the failure of palaeointensity experiments. The reason for the rather large (and quite unexpected) error in the average palaeointensity provided by the samples containing only a near magnetite (phase ‘h’) may lie in the fact that the low to medium temperature pTRMs, which represent a significant fraction of the total TRM, seem to be carried by small MD particles. In conclusion, several modifications of the Thellier method are proposed.
Key words: basalt, Etna, geomagnetic field, palaeointensity, rock magnetism, transdomain
remanence.
1 I N T R O D U C T I O N
The study of the remanent magnetization of rocks has proven to be an extremely useful tool to deal with many different
prob-lems in earth sciences. In most cases, only the directional infor-mation provided by declination and inclination of the remanence vector is needed, but some investigations also demand the knowl-edge of the strength of the palaeofield vector, which is called the
palaeointensity. Its determination is more difficult, since the magnitude of the palaeofield vector, as opposed to its direction, cannot be directly read from the magnetization vector. While the direction of magnetization is, in most cases, parallel to the di-rection of the applied field, its magnitude is only proportional to the intensity of magnetization, so that remagnetization experiments have to be carried out to retrieve the strength of the magnetizing field.
Absolute palaeointensity determinations are especially important due to their geomagnetic interest. A description of the whole mag-netic field vector is of great significance for the study of the Earth’s magnetic field and its changes with time. In particular, the knowl-edge of the variation of palaeointensity trough time may provide deep insight about the evolution of the core and the core-mantle boundary (Pr´evot et al. 1990; Pr´evot & Perrin 1992). Unfortunately, as can be recognised in recently published compilations (Tanaka
et al. 1995; Perrin & Shcherbakov 1997; Ju´arez et al. 1999), the
number of reliable palaeointensity data available is still limited. Less than one determination per million years have been obtained for the time span between 10 and 400 Ma (Perrin 1998). Therefore, we are still far away from a trustworthy description of the temporal variations of the Earth’s magnetic field intensity.
Despite many different attempts to obtain undisturbed results, a high percentage of samples from each studied collection does not yield reliable results. In addition, dispersion observed in palaeoin-tensity results is much higher than in directional results, which may be often due to the fact that incorrect palaeointensity determinations are considered to reflect the actual magnetic field at the time of mag-netization of the studied rocks. The paucity of reliable palaeointen-sity data is thus directly related to the difficulty of obtaining reliable absolute palaeointensity determinations. This is so because of dif-ferent reasons:
(i) The primary remanence of a rock must be a thermoremanent magnetization (TRM) in order to be suitable for palaeointensity studies. If the remanence of a studied sample is a chemical rema-nent magnetization (CRM), palaeointensity determinations might be much too low (Draeger & Pr´evot 1998).
(ii) Rock samples employed for palaeointensity determinations must obey the Thellier laws of reciprocity, independence and addi-tivity of partial thermoremanent magnetization (pTRM) acquired in non-overlapping temperature intervals (Thellier & Thellier 1959). This behaviour is only verified for true SD particles, while multido-main (MD) grains do not obey these laws. Pseudo single-domultido-main (PSD) grains carrying a TRM may approximately satisfy the re-quirements of the Thellier method for the smallest particles, but not for the larger ones (Shaskanov & Metallova 1972; Levi 1977; Bol’shakov & Shcherbakova 1979; Worm et al. 1988).
(iii) During heating, irreversible chemical/mineralogical or phys-ical (Kosterov & Pr´evot 1998) changes can affect the magnetic phases, which results in spurious palaeointensity estimates.
The purpose of the present study is to investigate the reasons for the failure of palaeointensity determinations on historical lava flows from Mt. Etna (Sicily, Italy). Though often studied, Etnean lavas are known to be difficult to use for palaeointensity studies, due mainly to their thermal instability (Tanguy 1975; Tric et al. 1994; Haag et al. 1995). Historic lavas, however, have the advantage of a real control of the palaeofield intensity and direction which were present during the time of their formation, thus providing an unambiguous check of the correctness of palaeointensity determinations. On the other hand, understanding the reason for the failure of palaeointensity experiments on the Etnean basaltic lavas, may help to obtain some
general information of interest for palaeointensity studies on basalts, since these rocks typically fail to provide reliable palaeointensity results (Perrin 1998).
For this study we devised a specific version of the method pro-posed by Thellier & Thellier (1959), modifying it in order to distin-guish between problems related to physical and chemical alterations and those linked to the failure of the Thellier pTRM laws. In ad-dition, with the same aim in mind, we carried out extensive rock magnetic experiments.
2 S A M P L I N G A N D P R E L I M I N A R Y P A L A E O M A G N E T I C M E A S U R E M E N T S
Mt. Etna is located in the eastern part of Sicily (Italy) (Fig. 1), and its geological characteristics have been described by several authors (e.g. Kieffer & Tanguy 1993; Tanguy & Kieffer 1993). Its activity began with sporadic eruptions about 500 000 yrs ago (pre-Etnean eruptions), although its main activity did not start before 200 000 BP and has continued until present. Mt. Etna has been characterised by different eruptive phases: effusive volcanism, explosive volcan-ism and phreatomagmatic periods. From a petrologic point of view, its volcanism evolves from tholeitic to alkaline lavas. Most rocks emitted in modern eruptions are trachibasalts.
In this paper we will report palaeomagnetic, palaeointensity and rockmagnetic results of six lava flows belonging to the 1910 and 1928 eruptions. Sampling sites are shown on Fig. 1 and their geo-graphic co-ordinates are indicated on Table 1. Samples were taken with a portable fuel powered drill and oriented by means of a solar compass. Flows with varying thicknesses—from 50 cm (flow 1910-III) to 5 to 6 m (flow 1928-II)—were chosen and samples were taken through the whole thickness of the flow, in order to obtain results belonging to the top, centre and bottom of each of the sections. In the laboratory, samples were cut into different specimens (generally, two to four standard one-inch specimens), so that specimens from the same core were available to carry out palaeointensity as well as palaeomagnetic and rock magnetic experiments.
Remanent magnetization of the samples was measured with a CTF cryogenic magnetometer at the palaeomagnetic laboratory of the University of Montpellier. Measurements were only recorded af-ter stabilisation of remanence in the cryogenic magnetomeaf-ter, which was made possible with a program which permitted plotting of mag-netization changes in real time (Levˆeque 1992).
In Table 1, mean NRM results for each flow and the mean NRM value for all flows are shown, a result of D = 359.3, I = 49.8,
k = 852.2, α95=2.3, N = 6 being obtained. In addition, 14
spec-imens belonging to the same collection but not to the samples taken for palaeointensity experiments were selected for alternating field demagnetization. Only a single palaeomagnetic component, together with a small viscous component, which was easily erased at 1–3 mT, could be recognised (Fig. 2). In just one case the ini-tial viscous component represented a high fraction of total NRM. Characteristic remanent magnetization (ChRM) of these specimens yielded a result of D = 356.1, I = 49.0, k = 520.4, α95=2.9 and
N = 6 (because the mean of all six sites was calculated). Their NRM
direction of D = 0.4, I = 47.8, k = 163.5 and α95=5.3 was in
ac-cordance with the NRM direction obtained for all specimens, so that the direction of these 14 specimens can be considered to be repre-sentative for the whole sample set. Both NRM and ChRM values are also reported on Table 1. Six direct measurements of the Earth’s magnetic field carried out in localities of Sicily in 1924 (Cafarella
et al. 1992) yield a mean direction of D = 353.9, I = 52.4. These
Figure 1. Mt. Etna. Location of sampling sites and lava flows. (Modified from Rolph et al. 1987.)
in the present study, but the moderate deviation of 3.7◦ between
both directions might be explained as due to the magnetic anomaly produced by the magnetized rocks of Mt. Etna.
Median destructive field (MDF) values determined from AF de-magnetization curves from the previously mentioned fourteen spec-imens lie between 6 and 32 mT, a mean value of 19 mT being obtained. Several samples yield MDF values around 10 mT or even lower. MD grains could be of importance in such kind of samples.
With one exception, higher MDF are observed in those samples, which are closer to the borders of the flow.
Magnetic viscosity indices (Thellier & Thellier 1944; Pr´evot 1981) were determined for each second sample of the whole col-lection, so that viscosity indices were not available for all samples subjected to the palaeointensity experiment. Samples were stored for two weeks in ambient magnetic field in such way that the field was parallel to the cylindrical axis of each specimen, and then their
Table 1. NRM results. Site LON/LAT S N D I k α95 1910-I 15.27, 37.67 16 9 358.4 50.1 36.7 8.6 1910-II 15.27, 37.67 17 9 5.2 49.5 19.0 12.1 1910-III 15.27, 37.67 26 22 352.8 49.2 80.1 3.5 1928-I 15.55, 37.77 36 22 0.4 49.7 157.1 2.5 1928-II 15.60, 37.77 67 51 1.7 49.2 49.9 2.9 1928-III 15.68, 37.77 43 35 357.5 50.6 436 1.2 Mean 6 359.3 49.8 852.2 2.3
remanence was measured. Measurements were carried out immedi-ately after placing specimens into the cryogenic magnetometer, in order to not to loose information about viscous remanence created during their two-week storage. Subsequently, they were stored again for two weeks in ambient field, but anti-parallel to the initial position and their remanence was measured again.
Viscosity indices yield moderate values. Only 24 per cent of 77 determinations display values higher than 5 per cent. Considering a lognormal distribution of viscosity indices, a mean value of v = (2.9 ± 0.3) per cent is obtained. 16 specimens used for palaeointen-sity experiments yield a somewhat lower mean viscopalaeointen-sity index of (1.8 ± 0.5) per cent.
3 M A G N E T I C M I N E R A L O G Y
Rock magnetic experiments were carried out in order to characterise the carriers of thermoremanence of the samples used for palaeoin-tensity investigations, as well as to determine their thermal stabil-ity and grain size. For this purpose, three different methods were employed:
(i) Weak field thermomagnetic measurements, specifically, sus-ceptibility versus temperature (κ-T ) curves. The temperature de-pendence of initial magnetic susceptibility was measured using a
Figure 2. Orthogonal vector plot of AF-demagnetization of a representa-tive sample. Solid symbols: horizontal projection. Open symbols: vertical projection. Demagnetization steps are indicated in mT.
Bartington MS2 susceptibility-meter associated with a furnace. In these experiments, samples could be heated up to a maximum tem-perature of 700◦C and then cooled down, while susceptibility was
being measured. Most measurements were carried out in vacuum better than 10−2 mbar, although a few measurements in air were
also performed. For each of the samples used for the palaeointensity experiment, one specimen was taken to carry out a heating-cooling run prior to the experiment. Some other specimens belonging to the same sites were also taken. In addition, κ-T curves of specimens subjected to the palaeointensity experiment and removed after cer-tain temperature steps for determination of hysteresis parameters (see Section 5.1) were also measured. Curie points were determined taking inflexion points in κ-T curves following the drop in suscep-tibility after Hopkinson peaks.
(ii) Microscopy, consisting of optical and electronic observations of polished thin sections and electron microprobe analysis. Maxi-mum magnification of optical observations, which were carried out under oil, was ×1250. Electron microprobe analysis was performed with a Camebax device.
(iii) Hysteresis measurements at room temperature, which were carried out at the IPG palaeomagnetic laboratory in St. Maur (France). The measuring device basically consists of a translation magnetometer located in the gap of a large electromagnet. The spec-imens had a weight of 2–3 g, and the maximum field used varied between 0.8 and 1 T.
Depending upon the characteristics of the κ-T curves, four dif-ferent curve types (L, M, H and C) could be distinguished during the heating-cooling runs. As three magnetic phases were recognised, three of the curve types correspond to those cases in which one of these phases is clearly predominant in the heating curve (types L, M and H). The fourth and latter category is ascribed to curves in which at least two different magnetic phases provide magnetic sig-nals of similar magnitude in the heating curve. Magnetic properties of samples belonging to the first three groups are listed on Table 2.
3.1 Type L samples
κ-T curves of type L are characterised by the presence of three magnetic phases in the heating curve and two in the cooling curve (Fig. 3a). The predominant one in the heating curve is a low Curie point phase—‘phase l’-, with a Curie temperature between 200◦C
and less than 300◦C. In addition, an intermediate temperature phase
with a Curie temperature of approximately 450◦C–490◦C and a high
TCphase, with a Curie point of approximately 560◦C can be
recog-nised. The latter is probably related to the presence of magnetite. Nevertheless, both show a weak magnetic signal compared to phase ‘l’. On cooling, just magnetite and a phase with Curie temperature between 150–300◦C remain. Only two samples, 163 and 164 from
site 1928-I show a clear L-type behaviour.
Microscopic observations show that ferromagnetic minerals vary largely in size, its dimensions ranging between a few hundreds of µm and a few µm or less. Whatever their size, these crystals are titano-magnetites without any visible exsolutions or traces of alteration, which are not observed even at the highest magnification (×1250).
Electron microprobe analyses of ten of these crystals indicate that two populations of homogeneous titanomagnetite with slightly dif-ferent chemical composition are present. The fact that early and late crystallised titanomagnetite has a different chemical composition is a common observation in basaltic rocks (Pr´evot & Mergoil 1973).
The crystals of the population with sizes of the order of 100 µm have an ulvospinel molecular fraction of x = 0.37 ± 0.03. Iron
Table 2. Magnetic properties of samples with a single largely dominant ferromagnetic phase.
Core Site Mineralogical NRM0×10−3 Qn v TC JS×10−3 JRS/JS HC(mT) HCR(mT) HCR/HC
type (Am2Kg−1) (per cent) (◦C) (Am2Kg−1)
072 (1910-I) H(mx) 4.87 6.5 1.1 550 2844 0.15 11.3 29.5 2.61 078 (1910-I) H(mx) 3.10 3.4 1.8 550 2821 0.12 12.1 32.5 2.69 161 (1928-I) H(si) 3.42 6.2 0.0 538 2898 0.11 12.1 34.0 2.81 162 (1928-I) H(si) 2.72 4.0 – 534 2949 0.11 11.1 31.5 2.84 163 (1928-I) L 2.95 2.4 5.0 191 2195 0.11 5.3 13.7 2.57 164 (1928-I) L 2.64 2.8 – 174 2222 0.10 5.1 14.2 2.77 256 (1928-II) M 3.05 4.1 – 453 3102 0.20 15.8 35.0 2.21 258 (1928-II) M 2.38 2.9 – 477 3054 0.20 18.6 39.2 2.11 259 (1928-II) M 2.31 2.7 3.1 463 3181 0.20 17.0 38.4 2.26 260 (1928-II) M 2.26 3.0 – 477 3337 0.16 17.0 263 (1928-II) H(si) 5.02 8.9 0.7 543 2479 0.15 15.0 40.5 2.63 265 (1928-II) H(si) 7.82 15.2 5.2 527 2626 0.15 16.0 40.5 2.47 266 (1928-II) H(si) 5.62 11.0 – 544 1622 0.18 16.1 34.6 2.15 344 (1928-III) H(si) 2.76 3.7 – 554 2602 0.13 14.3 34.8 2.43 345 (1928-III) M 2.50 3.8 3.1 467 2698 0.21 18.0 37.5 2.08 346 (1928-III) M 2.80 4.0 – 451 2720 0.20 17.0 35.4 2.08 347 (1928-III) H(si) 2.39 4.7 1.1 524 2406 0.13 15.1 38.6 2.56
is partly substituted by aluminium and magnesium. The number of Al cations δAl found for 4O2− equals to 0.23 ± 0.02, while
δMg=0.21 ± 0.02. Calculations were made following the procedure
described by Pr´evot et al. (1981). In the absence of any substitution,
Figure 3. Representative examples of susceptibility versus temperature curves measured in vacuum (κ-T curves). Solid symbols are for heating, open symbols for cooling curves. Susceptibility values are normalized to maximum susceptibility. Flow and sample number as well as κ-T curve type (see text) is indicated in each case.
the expected Curie temperature has a value of 340 ± 20◦C. The
lowering of TCdue to Al and Mg substitution amounts to 135◦C
ac-cording to experimental data on synthetic minerals (Richards et al. 1973; O’Donovan & O’Reilly 1977). Thus the expected Curie point of 205±20◦C is in reasonable agreement with thermomagnetic data
of the present study (Table 2).
The smaller titanomagnetite crystals found in the groundmass are characterised by x = 0.50 ± 0.01, δAl=0.13 ± 0.02 and δMg
= 0.11 ± 0.02. The expected Curie temperature is 180 ± 20◦C,
which also agrees with the measured value, an agreement indicating the absence of low temperature oxidation. This second phase is the most abundant one and, due to its smaller size, it is the main TRM carrier, and therefore it will be called the ‘l’ phase in the following. Fig. 4 shows the results of the measurement of hysteresis parame-ters. As suggested by this figure and Table 2, the grain size of phase ‘l’ corresponds to large PSD close to true MD particles.
Figure 4. Saturation remanence to saturation magnetization ratios as a func-tion of coercivity of remanence to coercivity ratios (after Day et al. 1977) measured on untreated specimens: Type L (solid dots), type M (open squares) and type H (crosses) samples.
3.2 Type M samples
Fig. 3(b) shows the second type of κ-T curve found (type M). In the heating curve, two phases could be recognised, one with a Curie point of approximately 450◦C–490◦C (‘phase m’) and another one
with a Curie point corresponding to a magnetite or a near mag-netite phase (Table 2). On cooling, the former disappears, and a new phase, with a Curie point between 200◦C and less than 300◦C
is created. The latter phase remains stable after subsequent heating (Fig. 8). In order to detect at which temperature transformation of phase ‘m’ took place, it was also tried to cool down samples before arriving at 600◦C during the heating procedure. It could be
recog-nised that transformation of phase ‘m’ occurred at temperatures above 400◦C. The average Curie point of phase ‘m’ yields a value of
465 ± 10◦C, which coincides with the
intermediate-Curie-tempera-ture phase found on type ‘L’ samples and which corresponds to a pure (Fe,Ti)-titanomagnetite with x = 0.20 ± 0.05. Type M curves were more frequently observed than type L ones, as six samples show a clear type M behaviour.
Microscopic observations of polished sections reveal that two generations of titanomagnetite are present, like in type L samples. When observed under oil at the largest magnifications, many crys-tals look, however, heterogeneous, showing a great amount of fine lamellae lying along (1,1,1) planes (Fig. 5a). Due to its tiny size, the exsolved phase cannot be positively identified, but considering the orientation of lamellae and their reflectivity, it can be almost certainly considered to be ilmenite. This oxyexsolution pattern cor-responds to a C3 stage (Haggerty 1976). Although the other crystals seem to be homogeneous, we believe them to be exsolved as well, though at a smaller scale, as thermomagnetic curves do not show the presence of low TCtitanomagnetite.
Due to the thermal instability of phase ‘m’, which will be dis-cussed later (Section 5.1), it is not clear whether the near magnetite phase recognised on all κ-T curves is originally present or produced during heating. It should be nevertheless noted that type H samples (see below), cored within the same outcrops as type M samples, do contain a near-magnetite phase of deuteric origin. Thus, also the near-magnetite phase observed in type M samples probably formed during the initial cooling of the flow.
The average JRSto JSratio calculated from values from type M
curves listed on Table 2, yields 0.20 ± 0.04, suggesting that the magnetic grain size corresponds to PSD particles approaching the SD threshold. At this point it should be recalled that oxyexsolved titanomagnetite grains do not provide an JRS/JSratio equal to 0.5
even if they are of SD size, as magnetic interactions typically reduce this ratio to 0.35 (Davis & Evans 1976).
3.3 Type H samples
These κ-T curves (Figs 3c, d) are the simplest ones observed in the present study. On the heating curve, the dominant phase has a Curie point corresponding to magnetite or a near magnetite composition (phase ‘h’). In some cases, and contrarily to the previously described types, there is only a single ferromagnetic phase present on the heat-ing curve. The latter kind of curves will be called type H(si), while mixed type H curves, which besides a predominant phase ‘h’ show the presence of a second phase in the heating curve, will be named type H(mx). Often type H samples do not show any trace of alter-ation in the cooling curve (Fig. 3c). In other cases, a weak con-tribution of a type ‘l’ phase can be recognised on the cooling curve (Fig. 3d), in one case this appears also on an H(si) sample (sample 161). The mean Curie temperature of phase ‘h’ yields 540 ± 10◦C
(Table 2), which corresponds to a pure (Fe,Ti)-titanomagnetite
com-Figure 5. Ore microscopic studies, both examples with ×125 magnifica-tion, carried out under oil. (a) Type M sample 345. Titanomagnetite with ilmenite exsolution lamellae lying along (1,1,1) planes. C3 oxidation stage (Haggerty 1976). (b) Type H + sample 263. Titanomagnetite subdivided by well-developed ilmenite exsolution lamellae. Irregular grey pseudobrookite exsolution can also be recognised. Oxidation stage C4 to C6 (Haggerty 1976).
position with x = 0.06 ± 0.02. Type H(si) curves correspond to sam-ples collected relatively close to flow limits, although other samsam-ples, also lying near flow borders, do not belong to the type-H group.
Optical microscopic observations show again the presence of large (up to 200 µm) and small (less than a few tens of µm) titano-magnetite crystals, corresponding to two periods of crystallisation during cooling. With the exception of few titanomagnetite crystals included within silicate and which are sometimes homogeneous, ti-tanomagnetites are subdivided by well-developed exsolution lamel-lae (Fig. 5b). As illustrated in this plate, the pseudomorphic assem-blages correspond to oxidation stages C4 to C6 of Haggerty (1976). The presence of pseudobrookite is important in the present context as this mineral breaks down below 585◦C (Lindsley 1991).
There-fore, these pseudomorphic alterations seem to have occurred above the Curie temperature of the dominant magnetic phase, and thus the remanence of type H samples is almost certainly a TRM. The same holds for the remanent magnetization carried by type L sam-ples, since the solidus temperatures of the Fe3O4-Fe2TiO4system
exceed 1400◦C. In contrast, the primary remanence of type M
sam-ples could be either a TRM or a TCRM (thermochemical remanent magnetization), since a few examples of oxyexsolution occurring at temperatures lower than the Curie temperature of magnetite seem to be have been found in nature (Gromm´e et al. 1969).
Microscopic observations of polished sections of type H samples suggest that the effective grain size of phase ‘h’ resulting from il-menite and spinel exsolutions is a few µm. Surprisingly, the average
JRS/JSratio of these samples is only 0.14 ± 0.02, which suggests a
large PSD size.
3.4 Type C samples
Several samples do not show the predominance of any of the three phases previously described, but correspond to a composite type, in which at least two magnetic phases of somewhat comparable magnitude are present on the κ-T heating curve (Figs 3e, f ). They will be called type C samples. Being a mixture of the three sam-ple types described above, the magnetic mineralogy of this kind of samples is not specific, and it will not be the subject of a special description.
4 P A L A E O I N T E N S I T Y E X P E R I M E N T S
4.1 Method
As mentioned above, the aim of the present study was to investi-gate the reasons for the difficulties encountered in obtaining reliable palaeointensity estimates with Thellier type experiments. This drew us to devise a specific procedure for our palaeointensity experiment associating its results with different rock magnetic experiments. The whole procedure was aimed at (i) investigating both chemical-mineralogical alterations and changes in magnetic properties due to heating during the palaeointensity experiment, (ii) determining the possible acquisition of spurious remanences such as chemical remanent magnetization (CRM) during heating and (iii) studying the biases in palaeointensity determination related to the presence of multidomain grains sensu largo (i.e. PSD + true MD). Since remanences produced during the heating procedure may be differ-ent from a CRM (Shashkanov & Metallova 1970; Gernick 1983), we will designate them with the generic expression ‘heating rema-nent magnetization’ (HRM) as long as their origin is not known. It should be mentioned that with an objective rather similar to ours, McClelland & Briden (1996), designed a new version of the Thellier method in a previous study. However, unlike ours, their method does not allow an unambiguous discrimination between MD and HRM effects.
For the experiment, 28 standard one-inch samples belonging to all six flows were taken. Each one was cut into two halves, a main spec-imen (MS) and a control specspec-imen (CS), so that experspec-iments were carried out on 56 specimens. Samples were chosen to have different positions inside of each of the flows represented. The experimental procedure was performed as follows:
(1) NRM of MS and CS is measured.
(2) CS is AF-demagnetized in a B = 150 mT peak field and the remanence left measured. We found that AF-demagnetization up to such a high field will leave CS practically demagnetized so that the magnitude of CS(step 2) is always very small.
(3) All specimens (MS and CS) are heated up to a temperature
T1in a field B = 50 µT. After reaching T1, samples are kept at that
temperature for approximately ten min. Then, the field is switched off, but the temperature T1is still kept constant for the same amount
of time in order to allow any thermoviscous remanence (TVRM) acquired at T1to decay. Subsequently, samples are cooled down in
zero field (in order to avoid pTRM-creation) to room temperature, and their remanence is measured. This first heating-cooling cycle at T1might have induced a HRM in the samples, which was
deter-mined from CS, since HRM = CS(step 3)-CS(step 2). The choice to measure HRM upon the first heating was funded on the fact that chemical changes, if they occur, are much more important during the first heating than during the following ones. Thus the CRM associated to the first heating is expected to be larger.
(4) Again CS is demagnetized in the B = 150 mT field, and the remanence left measured.
(5) In a second heating-cooling cycle, all samples are heated again to a temperature T1, this time in zero field. At that temperature,
the field is switched on (B = 50 µT), and after approximately ten min, samples are cooled down to room temperature, thus creating a pTRM. Remanence of all specimens is measured again, and the pTRM created determined from CS, since pTRM = CS(step 5)-CS(step 4).
(6) During the third heating-cooling cycle at T1all samples are
heated up again to T1, kept for some minutes at that temperature, and
then cooled down to room temperature, all this in zero field. This last cycle was included in order to detect the presence of non-unblocked fractions of the pTRM created between T1and room temperature,
so called pTRM-tails (Bol’shakov & Shcherbakova 1979), due to the existence of MD grains in the studied samples. The remanence of this pTRM-tail was determined from CS, since pTRM-tail = CS(step 6)-CS(step 4).
(7) Then, CS was again AF-demagnetized (peak demagnetizing field B = 150 mT), and the whole procedure was repeated again, starting at step 3, but at a higher temperature T2.
Such heating-cooling runs were performed at 14 different tem-perature steps: 80, 110, 140, 170, 200, 230, 260, 300, 350, 400, 450, 485, 525 and 555◦C. A last single heating to 590◦C was also
per-formed. In addition, serial pTRM-checks were performed after the 230, 400 and 485◦C runs (i.e. after the 485◦C step, pTRM checks
were carried out at 110, 200, 300 and 400◦C). The objective of the
serial pTRM-checks was to see whether distinct pTRMs change in unison or not after heating at a given temperature.
The NRM left after each temperature step Ti was determined
from the measurement of the main specimens (MS) after step 3. Nevertheless, the true remaining NRM can be slightly different from the measured NRM left because the latter can include some HRM or pTRM-tail components acquired during previous heating and still blocked at Ti. In addition, a small thermoviscous component can
remain. However, the overall effect of these components should be small.
Palaeointensity experiments were carried out at the palaeomag-netic laboratory of the University of Montpellier II. Heating and cooling runs were performed in a device constructed in that labora-tory, basically consisting of a Pyrox furnace introduced in a three-layered magnetic shielding. Temperature values were checked by means of three thermocouples placed at different positions of the heating chamber of the furnace. Temperature reproducibility be-tween two heating procedures to the same nominal temperature was within 3◦C. Heating and subsequent cooling of samples was carried
out in the same chamber, cooling being performed by subjecting the heating/cooling chamber to an air current. All heating-cooling runs were performed in vacuum better than 10−2mbar. Due to the
vac-uum and the method of cooling, the whole heating-cooling run was a rather long-lasting procedure, which could take between seven and nine hours. The intensity of laboratory field used (50 µT) could be held with a precision better than 0.1 µT. Remanent magnetization of the samples was measured with a CTF cryogenic magnetometer and only recorded after stabilisation of remanence in the magnetome-ter. Room temperature bulk susceptibility was measured for each
specimen after every heating-cooling run with a Bartington MS2 susceptibility-meter.
4.2 Tentative palaeointensity calculations
A qualitative appreciation of the variety of NRM-TRM diagrams obtained from samples with different susceptibility versus temper-ature curve types can be gained from Fig. 6. Samples 265 and 266 yield a linear plot over a significant NRM fraction and pTRM checks seem to be positive. For samples 078 and 167 a partial linear arrange-ment of points is also observed but pTRM checks seem negative. For the last two samples (163 and 345), the NRM-TRM points are not aligned and the pTRM checks are obviously negative. Thus, it seems obvious that many of these samples cannot provide reliable palaeointensity estimates. The interpretation of palaeointensity data obtained with the Thellier method is commonly based on two types of considerations, the characteristics of the NRM-TRM data and the results of pTRM checks. Similarly, we first tentatively calculated palaeointensity values following this usual approach. The results are listed in Table 3 for all samples meeting the NRM-TRM mini-mum criteria, bold face fonts being used for the samples, which, in addition, satisfy our pTRM-check criteria, which will be explained below.
For the NRM-TRM data, our minimum criteria were the following:
(i) N (the number of points visually aligned on the normalized NRM-TRM diagram) equal or larger than four.
(ii) NRM fraction factor f (the fraction of remanence taken for palaeointensity determination) equal or larger than 0.15. If we con-sider a rather typical basaltic sequence like the Steens Mountain Basalt, which was subjected to a very extensive palaeointensity in-vestigation (Pr´evot et al. 1985), the choice of this threshold would have lead to rejecting slightly less than 10 per cent of the total palaeointensity determinations.
(iii) Elimination of data suspected to correspond to the VRM acquired in situ. In agreement with the basic idea of the Thel-lier method, palaeointensity determinations must use the lowermost temperatures NRM-TRM data in order to minimise the risk of mag-netic or chemical changes. However the points which could be af-fected by magnetic viscosity have to be rejected first. The lowest-temperature NRM fraction corresponding to the viscous remanent magnetization (VRM) acquired since flow cooling can be roughly estimated from the viscosity coefficient v of the sample measured over two weeks (see Section 2) extrapolated to t = 80 yrs. As-suming a log-t dependence of the VRM and a fourfold increase for t = 0.7 million yrs, as previously observed for a large collec-tion of sub-aerial basalts (Pr´evot 1981), we found that the low-temperature NRM fraction corresponding to an 80-yr old VRM amounts approximately to 2.5v. Thus we have to expect that the lowest-temperature NRM-TRM points corresponding to a NRM de-crease inferior to approximately 2–3v reflect the demagnetization of a VRM instead of a pTRM. Note that the calculation above is approximate because the rate of acquisition of VRM depends upon the magnetic mineralogy of each sample. However, in most cases the 2.5v threshold is observed to correspond to a rather abrupt re-duction of the NRM-TRM slope. This is expected from the SD theory (N´eel 1955) which suggests that VRM is larger than the pTRM carried by the same set of particles. Consequently, when the VRM decrease is plotted versus the pTRM acquisition, the slope defined by these data-points exceeds that of the data-points corre-sponding to the TRM decrease. The points correcorre-sponding to this initial and steeper part of NRM-TRM diagram were not
consid-ered for palaeointensity calculation. This change in slope was also used to calculate the relative intensity of the VRM acquired in situ (Table 3). As can be recognised from Table 3, most samples (20 out of 28) provide palaeointensity data fulfilling these wide acceptation criteria. Moreover, it turns out that all selected data fulfil in fact narrower requirements: in all cases N is larger than 7 and f larger than about 1/4.
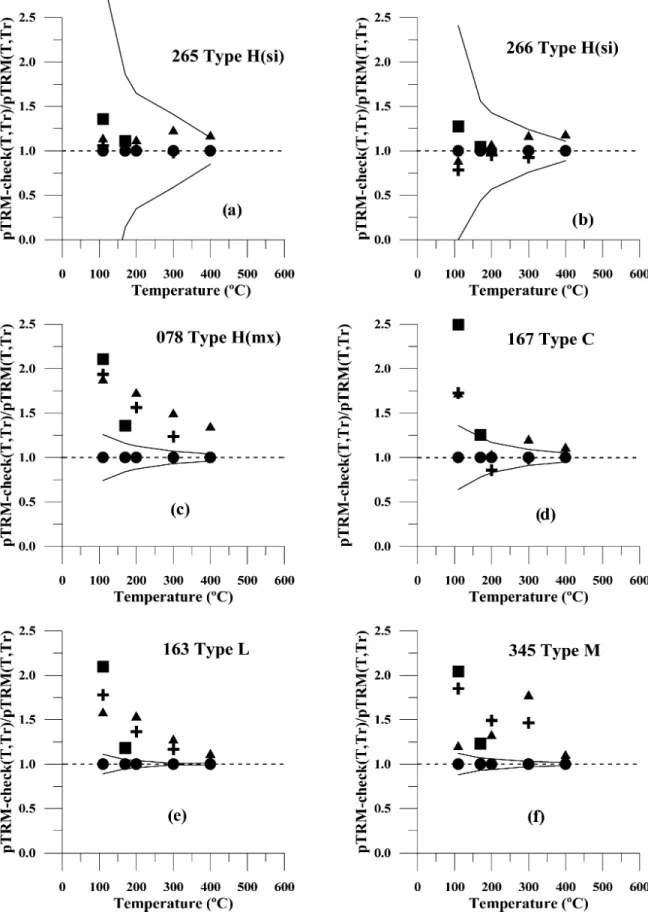
Our second set of criteria is related to pTRM checks. The ther-mal stability of pTRM is a check that Thellier & Thellier (1959) considered as fundamental. The results of pTRM checks for some representative samples of our collection are illustrated in Fig. 7, which shows changes in pTRM magnitude normalized to the first pTRM measurement as a function of the temperature of the last double heating step. It is not straightforward to choose the critical threshold between positive and negative pTRM checks. First, one must take into account the fact that large relative errors in pTRM cal-culation can occur at low temperatures because the measurements include a largely dominant NRM left. For this reason, a reliabil-ity limit was calculated as a function of the total magnetization, assuming a precision of 1 per cent in the measurements and a lin-ear relationship between NRM lost and pTRM acquired during the palaeointensity experiment. Then, if pTRMrand NRMrare relative
pTRM and NRM values, varying between 0 and 1, for a given value of NRMrat a certain temperature step, a maximum allowable error
pTRM is obtained for the corresponding value of pTRMr, with
pTRM = ±0.01(pTRMr)/(1 − NRMr). These reliability limits are
shown on Fig. 7, and they allow recognising the changes in pTRM which are experimentally significant.
Another difficulty is that the pTRM difference ( pTRM) is de-pendent upon the temperature interval between that of the pTRM check and that of the last double heating preceding checking. Thus, in the present palaeointensity context, the practical significance of a change in pTRM cannot be simply evaluated from the relative change in pTRM. To take this point into consideration, and also the variability of the temperature distribution of unblocking tempera-tures, we chose to consider also the change in pTRM/ NRM as being crucial.
We have considered here that pTRM checks are positive if they meet the following two conditions:
(i) The relative difference between original pTRM and pTRM check does not exceed 15 per cent, an empirical threshold al-ready used for some palaeointensity studies on basalts (e.g. Goguitchaichvili et al. 1999). Nevertheless, a greater relative dif-ference has been accepted in those cases in which the difdif-ference between original pTRM and pTRM check, although exceeding 15 per cent, was still comprised in the reliability limit calculated above taking into account the maximum allowable error pTRM.
(ii) The difference of the slopes of the segments of the NRM-TRM curve between Tmax and Tcheck before and after the pTRM
check does not exceed the same percentage. The results of this elaborated pTRM check are shown in the last column of Table 3. Positive pTRM checks are observed only on six samples (in boldface in the Table), all of type H(si) although one of them (sample 344) yields a negative check.
We can summaries the results of our palaeointensity experiments as follows:
(1) Only 6 samples, all containing magnetite resulting from deuteric oxyexsolution—mineralogical type H(si)—as single mag-netic carrier, meet our acceptation criteria regarding NRM-TRM plot characteristics and thermal stability of pTRM. They all
Figure 6. NRM-TRM diagrams for different sample types. Solid circles are for NRM-TRM data points used for palaeointensity calculation. Empty circles are for NRM-TRM data points not used for palaeointensity calculation. Triangles are for pTRM-checks. An adjusted line is shown in those cases in which palaeointensity has been calculated. Palaeointensity results of the examples shown: (a) Sample 265: B = 35.5 ± 0.5 µT (110–520◦C) (b) Sample 266: B =
43.0 ± 1.0 µT (20–520◦C) (c) Sample 078: B = 43.8 ± 1.5 µT (80–485◦C) (d) Sample 167: B = 48.7 ± 1.3 µT (20–520◦C) (f ) Sample 345: B = 31.4 ±
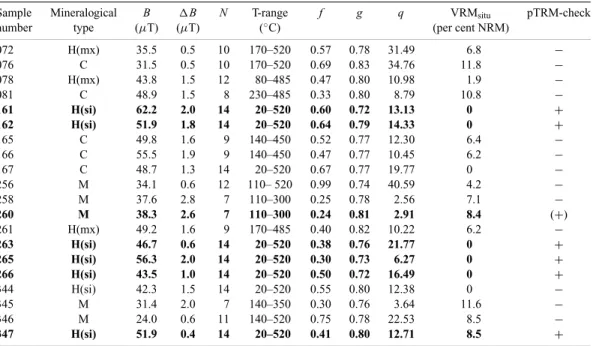
Table 3. Tentative palaeointensity calculations.
Sample Mineralogical B B N T-range f g q VRMsitu pTRM-check
number type (µT) (µT) (◦C) (per cent NRM)
072 H(mx) 35.5 0.5 10 170–520 0.57 0.78 31.49 6.8 − 076 C 31.5 0.5 10 170–520 0.69 0.83 34.76 11.8 − 078 H(mx) 43.8 1.5 12 80–485 0.47 0.80 10.98 1.9 − 081 C 48.9 1.5 8 230–485 0.33 0.80 8.79 10.8 − 161 H(si) 62.2 2.0 14 20–520 0.60 0.72 13.13 0 + 162 H(si) 51.9 1.8 14 20–520 0.64 0.79 14.33 0 + 165 C 49.8 1.6 9 140–450 0.52 0.77 12.30 6.4 − 166 C 55.5 1.9 9 140–450 0.47 0.77 10.45 6.2 − 167 C 48.7 1.3 14 20–520 0.67 0.77 19.77 0 − 256 M 34.1 0.6 12 110– 520 0.99 0.74 40.59 4.2 − 258 M 37.6 2.8 7 110–300 0.25 0.78 2.56 7.1 − 260 M 38.3 2.6 7 110–300 0.24 0.81 2.91 8.4 (+) 261 H(mx) 49.2 1.6 9 170–485 0.40 0.82 10.22 6.2 − 263 H(si) 46.7 0.6 14 20–520 0.38 0.76 21.77 0 + 265 H(si) 56.3 2.0 14 20–520 0.30 0.73 6.27 0 + 266 H(si) 43.5 1.0 14 20–520 0.50 0.72 16.49 0 + 344 H(si) 42.3 1.5 14 20–520 0.55 0.80 12.38 0 − 345 M 31.4 2.0 7 140–350 0.30 0.76 3.64 11.6 − 346 M 24.0 0.6 11 140–520 0.75 0.78 22.53 8.5 − 347 H(si) 51.9 0.4 14 20–520 0.41 0.80 12.71 8.5 +
correspond to the 1928 eruption, yielding an average palaeostrength of 52.1 ± 6.7 µT). This value largely exceeds the field magni-tude at this epoch, which is estimated to have been 42.4 ± 0.4 µT (Cafarella et al. 1992). This value was calculated from historical data of geomagnetic observations carried out in different locations of Sicily, mainly in 1890/92 (32 data-points) and also in 1923/24 (7 data points). Note that according to recent magnitude measure-ments at the surface of the volcano (Tanguy and Le Goff, in prepa-ration), the local magnetic anomalies dues to the TRM of ancient flows produce no systematic bias and only a limited scatter (typically ±1,000 nT) in the local field magnitude.
(2) A second group corresponds to those 14 samples, which sat-isfy our minimum acceptation criteria regarding NRM-TRM data, but provide negative pTRM checks. They correspond to all types of magnetic mineralogy except H(si). The average palaeomagnitude is 40.8 ± 9.0 µT, in agreement with the expected one. However, the failure of pTRM checks indicates that the Thellier method is inappropriate for these samples and suggests that this agreement is coincidental.
(3) No significant linear segment is observed on the NRM-TRM plots of the remaining 8 samples which are obviously unsuitable for Thellier experiments. This group comprises the two L samples stud-ied, about half (5) of the samples with complex magnetic mineralogy (C samples) and one M sample.
In conclusion, when studied by our variant of the Thellier–Coe method, most of this set of modern Etnean basalts fails to satisfy the usual reliability criteria of palaeointensity determination. Only some 20 per cent of the basaltic samples investigated meet these criteria but they provide palaeointensity data which are, as a whole, significantly overestimated. In the following, we investigate the rea-sons of this double failure.
5 O R I G I N S O F N O N - I D E A L
P A L A E O I N T E N S I T Y B E H A V I O U R
The failure of palaeointensity experiments carried out with this set of Etnean basalts may be due to several causes including:
(1) irreversible chemical and/or magnetic changes caused by heating;
(2) bias due to the development of a Heating Remanence (HRM); (3) non-ideal characteristics of TRM carried by these rocks.
5.1 Irreversible chemical and magnetic changes
In order to analyse the thermal stability of the ferromagnetic phases present in the studied samples and the characteristics of the chemical and magnetic changes they might have suffered after heating, dif-ferent rockmagnetic experiments were performed. Susceptibility-versus-temperature curves of untreated specimens were already analysed on Section 3. Additionally, rockmagnetic experiments were carried out on specimens belonging to the same samples and hav-ing experienced the same treatment than specimens selected for palaeointensity determinations. For this purpose, an extra specimen was taken from every one of the 28 cores from which samples for palaeointensity experiments were obtained, and each of them was cut into five pieces. All but one fragment of each of the specimens were introduced into the furnace and also subjected to the palaeoin-tensity experiment explained in section four. The last fragment was preserved for room temperature measurements. At certain temper-atures (230, 400, 485, and 525◦C) one fragment of every one of the
28 samples was removed. In this way, sub-specimens heated to 230, 400, 485 and 525◦C or kept at room temperature were available. In
addition, after completion of the palaeointensity experiment, spec-imens employed for palaeointensity determination, and heated at that moment to 590◦C, were also available for rockmagnetic
de-terminations. Consistency of k-T curves and hysteresis parameter ratios determined at different temperatures (i.e. on different spec-imens) confirm homogeneity of the sub-specimens with respect to rock magnetic parameters.
Furthermore, during the palaeointensity experiment, room tem-perature bulk susceptibility κ0was measured for each specimen after
every heating-cooling run with a Bartington MS2 susceptibility-meter, in order to check possible magnetic and/or chemical changes produced by heating.
Figure 7. Normalized changes in pTRM magnitude versus the temperature of the last previous heating step during the palaeointensity experiment. The pre-check heating temperatures are shown by different symbols. Solid circles: First heating to temperature Tj. Solid squares: 230◦C. Crosses: 400◦C. Solid
triangles: 485◦C. pTRM values are normalized to pTRM(T
j, 0) initially acquired by the sample, without having been heated to temperatures T > Tj. Reliability
Figure 8. Susceptibility versus temperature curves of type L, M and H samples subjected to the palaeointensity experiment, after having been heated to different temperatures. Temperatures indicated in each curve show the temperature steps of the palaeointensity experiment after which κ-T curves have been measured. Note that curves a, b and c, shown for type-L sample (164) correspond to successively increasing temperatures during the palaeointensity experiment. Solid symbols are for heating, open symbols for cooling curves.
5.1.1 Mineralogical changes
Fig. 8 shows κ-T curves belonging to some representative samples of types L, M and H (when untreated) after having been subjected to heating at different increasing temperature steps during the palaeoin-tensity experiment. Phase ‘l’ of type L samples seems almost unaf-fected by these heating, as can be recognised in the curves shown in Figs 8(a) and (b), in which no significant changes are observed. Phase ‘m’ of type L samples can still be recognised on the specimen previously heated to 400◦C, but has disappeared on the specimen
subjected to a 590◦C heating. Despite heating, type H curves also
remain basically unaltered, and only a slight drop of approximately 30◦C in the Curie point of phase ‘h’ can be distinguished after
heat-ing to 590◦C. No significant chemical changes seem to occur below
the uppermost heating.
In contrast, type M samples display clear evidence for large chem-ical changes during heating in palaeointensity experiments, changes starting at temperatures over 400◦C (Figs 8d and e), as phase ‘m’
cannot be recognised above the latter temperature. As already men-tioned in Section 3, also κ-T curves of previously untreated speci-mens show a largely irreversible behaviour. Phase ‘m’ disappears at temperatures between 400 and 500◦C while a low T
Cphase with an
average Curie point of 257 ± 14◦C develops. This new phase may
be perhaps one of the products of spinodal decomposition of phase ‘m’, due to heating below 600◦C. The solvus of the Fe
3O4-Fe2TiO4
system (O’Reilly 1984) suggests that upon heating at 450◦C an x =
0.2 titanomagnetite can exsolve along 100 planes in an intergrowth of two titanomagnetites with x ≈ 0.5 and x ≈ 0.1. These values
cor-respond to Curie points of approximately 250◦C and 520◦C, which is
in agreement with our observations, although the latter Curie point seems to have a somewhat lower value than the one observed on the κ-T cooling curves, which amounts to 539 ± 15◦C. However, as
mentioned in Section 3, the near magnetite phase present in type M samples is probably partly of deuteric origin. Thus, the measured Curie point might correspond to an intermediate value between the primary and secondary near-magnetite phases.
5.1.2 Magnetic hysteresis changes
Determination of hysteresis parameters at different temperatures and measurement of bulk susceptibility at room temperature were used to try to obtain information about magnetic changes produced by heating.
During the palaeointensity experiment, room temperature bulk susceptibility was measured after each heating-cooling run with a Bartington MS2 susceptibility meter, in order to check possible magnetic changes due to heating. Fig. 9 shows the variation of this parameter as a function of heating temperature. With the exception of minor changes at the upper heating temperatures, no traces of alteration can be recognised in any of the different sample types. Fig. 3, however, shows that clear changes in k-T curve are observed after heatings for type L, M and C samples, even though the susceptibility values at room temperature before and after heating are almost equal. Hysteresis parameters were also determined on specimens sub-jected to the palaeointensity experiment and removed after certain temperature steps, as explained at the beginning of this section.
Figure 9. Susceptibility at room temperature for representative specimens of different sample types, measured after each heating step of the palaeoin-tensity experiment, as a function of temperature of the heating step. Figs 10 and 11 show the behaviour of hysteresis parameters after different heating steps. Only moderate changes can be recognised, especially if the grain-size related ratios are considered (Fig. 10). Regarding the latter, only at the uppermost heating temperature of 590◦C a moderate increase of the J
RS/JSratio and a diminishing
of the BCR/BCratio can be observed. Even type M samples, which
exhibit very large chemical changes beyond 400◦C, only display
limited variations of these ratios. This seems to support the idea that these chemical changes are due to spinodal decomposition rather than to exsolution.
Figure 10. Ratio of saturation remanence to induced saturation magnetiza-tion versus ratio of remanent coercive force to coercive force (after Day et al. 1977) for representative specimens of different sample types, after heating at different temperature steps during the palaeointensity experiment. Heating temperatures during palaeointensity experiment are indicated.
Figure 11. Hysteresis parameters measured at room temperature, as a func-tion of heating temperature during the palaeointensity experiment. (a) Satu-ration remanence. (b) Coercive force.
5.1.3 pTRM checks
For type H(si) and M samples, the results of pTRM checks and comparison of heating and cooling k-T curves lead to the same conclusions: H(si) samples are thermally stable while M samples are thermally unstable, possibly already at temperatures as low as 230◦C according to pTRM checks (Fig. 7). Depending on sample,
type H(mx) and L samples display more or less similar heating and cooling k-T curves, but obvious changes in pTRM capacity are always observed. Clearly, pTRM checking appears to be the most sensitive way of detecting magnetic changes.
5.2 Heating Remanence
HRM, as defined in Section 4, is a generic term referring to a rema-nence acquired during heating under the application of a constant weak field. There are at least three kinds of remanent magnetization,
which can appear in the course of standard Thellier palaeointensity experiments:
(i) A viscous remanent magnetization acquired at a temperature
Ti during the time in which temperature this temperature is held
constant between the consecutive heating and cooling phases. This magnetization is commonly called a thermoviscous remanence (TVRM).
(ii) A crystalline remanent magnetization due to grain growth of a new ferromagnetic phase or a chemical remanent magnetization
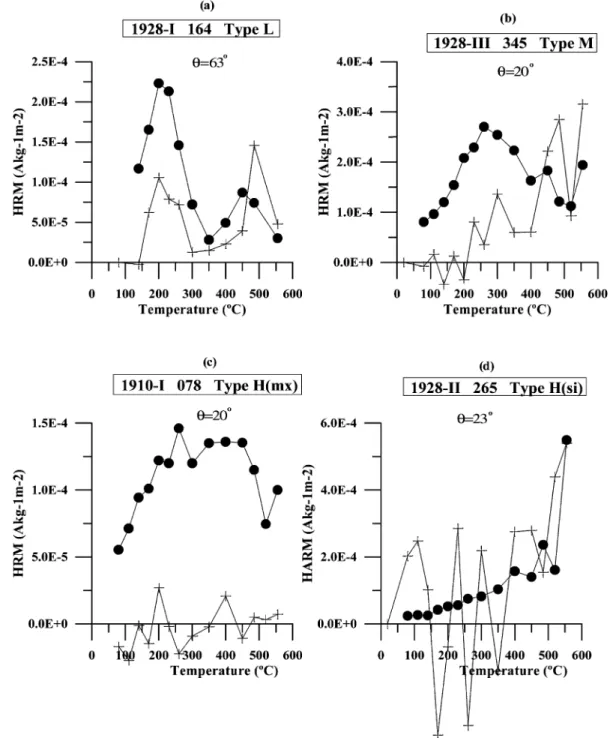
Figure 12. HRM as a function of heating temperature during the palaeointensity experiment. Crosses: Indirect calculation of HRM from the NRM direction and intensity of the main specimen, called HRM(Ind) in the text. Solid circles: Direct calculation of HRM from measurements of the control specimen, called HRM(Dir) in the text. θ is the angular deviation between the directions of NRM and applied field during the palaeointensity experiment. Maximum values of HRM(Ind.) and HRM(Dir.) normalized to initial NRM: (a) (164): HRMmax(Int.) = 8.4 per cent NRM; HRMmax(Dir.) = 5.5 per cent; (b) (345):
HRMmax(Int.) = 10.8 per cent NRM; HRMmax(Dir.) = 12.6 per cent; (c) (078): HRMmax(Int.) = 4.7 per cent NRM; HRMmax(Dir.) = 0.9 per cent; (d) (265):
HRMmax(Int.) = 7.0 per cent NRM; HRMmax(Dir.) = 6.9 per cent.
due to changes in the chemical composition of pre-existing magnetic phases. Both magnetization types, which are sometimes difficult to distinguish, are equally labelled CRM.
(iii) A transdomain remanent magnetization (TDRM), due to re-arrangements of domain structure as temperature varies (Moon & Merril 1986; Sholpo et al. 1991).
Fig. 12 shows HRM values and their variation with heating tem-perature Ti for type L, M and H samples. HRM(dir) was directly
In addition, for some samples, HRM was calculated from NRM di-rections at each temperature step of the palaeointensity experiment, following the method proposed independently by Coe et al. (1984) and Goguitchaichvili et al. (1999) as a ‘CRM-check’. A major prob-lem of this indirect method is that the smaller the angular deviation θbetween NRM and applied field during heating is, the more im-precise becomes the determination of HRM(ind). It should be noted that there is an essential difference between both ways of obtaining HRM. In our direct method of determination, the control specimen is subjected to AF demagnetization at a 150 mT peak field between two successive heating temperatures Ti and Ti+1. Thus the
rema-nence is reset to zero between two successive temperature steps and HRM is determined independently for each temperature step. With the indirect method, HRM is obtained from measurements of the main specimen, which is used for NRM determination, and is not AF-demagnetized. Consequently, HRM(ind) at Tirepresents some
(complex) net cumulative effect of the heating to Tiand all previous
heatings.
We believe that the HRM determined in our palaeointensity ex-periments is not a TVRM. Being produced by thermal activation at constant temperature and field, a TVRM has two fundamental properties:
(i) It decreases as soon as the field is cancelled. In the present experiment, the temperature plateau at Tiwas maintained for some
10 min under the applied field of 50 µT. Subsequently, the sample was left for the same time at the same temperature in zero field. The TVRM previously acquired should then have decreased largely, if not totally.
(ii) TVRM can only block magnetic grains whose blocking tem-peratures lie in a narrow range just above Ti. Consequently, a
TVRM acquired at Tiis normally of much smaller magnitude than
pTRM(Ti,T0). In contrast, our experiments indicate that in most
cases HRM and pTRM are of similar magnitude, the value of HRM being about half of that of pTRM, though showing large variations with Ti.
Comparing HRM obtained from the main and the control spec-imens allows to distinguish if this magnetization is a CRM or a TDRM. A CRM acquired at temperature Ti is only partially
de-stroyed by a subsequent heating to a slightly more elevated temper-ature T1+1. This means that if the sample is not AF-demagnetized
between successive heatings, the CRM measured at Ti+1is the sum
of the CRM acquired during the heating to Ti+1and some fraction
of the CRM acquired during temperature cycling at lower tempera-tures. Thus, if HRM was a CRM, its magnitude would be expected to be larger when obtained from indirect determination from the main specimen than from the direct determination from the control specimen, the difference increasing with Ti. As shown by Fig. 12,
this is not the case for any sample once it is allowed for experimental uncertainties. Thus HRM is not a CRM.
We suggest that HRM is a transdomain remanence, presumably acquired at the end of the heating ramp or during the time the sam-ples are held at constant temperature Ti with the field switched
on. According to this hypothesis, it is expected that a reorgani-sation of domain structure occurs during every temperature cy-cling, destroying the TDRMs acquired previously at lower tem-peratures. Thus, HRM(ind) and HRM(dir) are expected to be of similar magnitude, with no tendency for HRM(ind) to become rel-atively larger and larger as Ti is increased. As shown by Fig. 12,
this is essentially what is observed. It should be noted that when the angular deviation between the NRM and the applied field directions is small, the indirect method becomes imprecise. This is
evidenced by the scatter of the HRM(ind) values of the three spec-imens with close to 20◦, and explains the negative HRM(ind)
values recognised in these cases. In spite of this dispersion, how-ever, a tendency can be recognised for H(ind) to be smaller than H(dir), except for type H(SI) sample (265). This suggests that the TDRM magnitude depends on the initial magnetic state of sample, the AF demagnetized state favouring TDRM acquisition. This is in agreement with the fact that new positions of domain walls after AF treatment in MD materials are often particularly unstable (N´eel 1952).
A further argument in favour of our hypothesis is that the magni-tude of HRM tends to vary in a way akin to that of the pTRM-tail, although the relation between both types of remanence varies in different temperature intervals and from one sample to the other (Fig. 13). As will be discussed below, pTRM-tail is a distinctive feature of MD particles s.l., probably due to domain reorganisation during temperature cycling.
The HRM(dir) discussed above has unblocking AF fields smaller than 150 mT. Note that there is no clear indication in favour of the presence of some harder HRM fraction in our samples. To check this point, we calculated for each CS specimen and every temperature
Tithe vectorial difference between CS(step 4) at Ti and the initial
baseline CS(step 2) at T0. This difference might correspond to a
hard HRM, for example a CRM, left after AF cleaning. However, this vectorial difference was found to remain very small at any Ti.
5.3 Non ideal behaviour of pTRM
The main advantage of the partial TRM method (Thellier & Thellier 1959) over full TRM methods (e.g. Van Zijl et al. 1962; Shaw 1974) is in principle to allow the determination of palaeostrength from the lowest blocking temperature intervals. Because magneto-chemical changes are more likely to occur at higher temperatures, this re-duces the probability of incorrect determinations. The price for this advantage is that pTRM must possess certain properties, which, if not fulfilled, will provide incorrect palaeointensity determinations. The following three independent properties have to be verified:
(i) The magnitude of pTRM must be invariant with respect to the thermal and magnetic treatments applied prior to pTRM acquisition. This condition is not fulfilled by MD (sensu lato) particles (Sholpo
et al. 1991; Shcherbakov et al. 1993; Shcherbakova et al. 2000). In
particular, the pTRM(T1, T2) acquired after heating of a sample to
TCin zero field is larger than the same pTRM(T1, T2) acquired after
cooling down of the sample to room temperature prior to pTRM acquisition. Following the denomination from Shcherbakova et al. (2000), we will call the former pTRMaand the latter pTRMb. The
fact that pTRMaand pTRMbare not equal might be thought to be the
reason for the curvature of the NRM-TRM plots of MD particles first observed by Levi (1977). Some recent experiments Shcherbakov & Shcherbakova (in press) however, do not confirm this intuition. The physical reasons for this curvature, which is obviously correlated with MD characteristics, remains to be elucidated.
(ii) Partial thermoremanences acquired by a single specimen in different temperature intervals must be independent from each other. As a consequence, pTRMs acquired in consecutive temperature in-tervals should obey the additivity law, which is indeed verified for SD particles. However, as far as MD grains are concerned, the law of additivity is only valid for pTRMa, but not pTRMb(Shcherbakov
et al. 1993).
(iii) Blocking and unblocking temperatures of pTRM should be equal. This property has been sometimes considered as part of an
Figure 13. Relationship between HRM and pTRM-tail values, as a function of heating temperatures during the palaeointensity experiment. The corresponding temperature is indicated at each point.
extensive ‘law of independence’ (Shcherbakov et al. 1993; Perrin 1998; Shcherbakova et al. 2000). Deviation from this ideal behaviour for a pTRM(Ti, Ti+1) results in a tail of the thermal demagnetization
curve of this pTRM between Ti and TC(Shaskanov & Metallova
1972). Bol’shakov & Shcherbakova (1979) proposed to use the ra-tio of the tail of the [pTRM(Ti, Ti+1)] to the partial
thermorema-nence pTRM(Ti, Ti+1) measured at Tias a diagnostic parameter of
the domain structure of the grains carrying a specific pTRM. Re-cently, Shcherbakova et al. (2000) refined this method by proposing to use the room temperature value of this ratio. For pTRMathey
propose that the thresholds between SD/PSD and PSD/MD (sensu
stricto) grains correspond respectively to ratios (called Aa) equal
to 4 per cent and 15–20 per cent. The existence of the tail is inter-preted as a fundamental property of sensu lato MD particles, due to temperature-dependent rearrangements of domain structure.
In the present study, both the pTRM and its tail (pTRM-tail) were determined in the palaeointensity experiments from the con-trol specimen CS, with (pTRM-tail) = CS(step 6)-CS(step 4). The measured pTRM is a pTRMb, not a pTRMa. This choice was made
because the latter requires heating up to TC, which can modify
the magnetic properties of the sample. Another difference with the method proposed by Shcherbakova et al. (2000) is that in our exper-iments the specimen was demagnetized by AF instead of thermally. In agreement with Shcherbakov et al. (personal communication,
2001) this kind of pTRM will be noted pTRMaf. From their data,
we estimated that the thresholds of SD/PSD and PSD/MD ratios (called Aaf) are approximately 5 ± 1 per cent and 10 ± 2 per cent
respectively.
Fig. 14 shows that for all our samples the tail ratio Aaf
systemat-ically decreases as temperature increases. For type L samples, this ratio clearly exceeds the PSD/MD threshold within a great frac-tion of the range of pTRM acquisifrac-tion. This is a clear evidence that pTRM is carried by sensu lato MD grains. This should preclude the use of the Thellier method for these samples. For type M sam-ples, the tail ratio is mostly within the MD range, but often not far from the PSD/MD threshold, for most of the temperature interval of pTRM acquisition. This casts additional doubts on the significance of the palaeointensity results listed in Table 3 for the 5 samples be-longing to that group. For type H(si) samples, the tail ratio is of the order of 10–20 per cent over the main range of pTRM acquisition, which suggests, in agreement with hysteresis measurement, that the grain size does not correspond to SD grains but rather to particles straddling the PSD/MD threshold.
6 D I S C U S S I O N
For samples of types L and M, the failure of palaeointensity ex-periments can be easily explained by the investigations reported in Section 5.
Figure 14. pTRM-tail to pTRM ratio (crosses) and pTRM normalized to maximum pTRM (solid circles) of representative specimens of different sample types as a function of heating temperature during the palaeointensity experiment. pTRM-tail to pTRM ratios corresponding to the SD/PSD threshold (5 per cent) and PSD/MD threshold (10 per cent) (see text) are indicated.
None of the samples belonging to the type L group provides palaeointensity results. The Aaf tail ratio reaches as much as
40 per cent (Figs 14a,b). Considering that in addition to SD particles, small PSD grains (as defined by the pTRM-tail ratio) provide cor-rect palaeointensity results (Shcherbakov & Shcherbakova 2001), one sees from this figure that only NRM/TRM points beyond 250◦C
might be considered as usable for palaeointensity calculation. Un-fortunately, pTRM checks are clearly negative at and beyond 230◦C
(Figs 6 and 12c). Thus, the failure of palaeointensity experiments can be explained by the MD behaviour of TRM and magnetic changes starting at low temperatures. Interestingly, no obvious mineralogical change is observed (Figs 3a and 8a).
From six type-M samples studied, five yield NRM-TRM lin-ear segments fulfilling criteria (N ≥ 7, f ≥ 0.24) for tentative palaeointensity computations to be carried out (Table 3). The aver-age and standard deviation of these 5 tentative determinations yields