Discovering Structure of Data to Create Multiple
Perspective Visualization
by
Yao Li
Submitted to the Department of Electrical Engineering and
Computer Science
in partial fulfillment of the requirements for the degree of
Master of Engineering
at the
MASSACHUSETTS INSTITUTE OF TECHNOLOGY
June 2004
c
°2004 Yao Li. All rights reserved.
The author hereby grants to MIT permission to reproduce and
distribute publicly paper and electronic copies of this thesis and to
grant others the right to do so.
Author . . . .
Department of Electrical Engineering and Computer Science
May 7, 2004
Certified by . . . .
Howard E. Shrobe
Principal Research Scientist
Thesis Supervisor
Certified by . . . .
Patrick H. Winston
Professor of Artificial Intelligence and Computer Science
Thesis Supervisor
Accepted by . . . .
Arthur C. Smith
Chairman, Department Committee on Graduate Students
Discovering Structure of Data to Create Multiple Perspective
Visualization
by
Yao Li
Submitted to the Department of Electrical Engineering and Computer Science on May 7, 2004, in partial fulfillment of the
requirements for the degree of Master of Engineering
Abstract
The goal of visualization is to help human understand, reason, and learn better and quicker. In pursuit of this goal, this thesis presents an architecture for intelligent visualization systems, which supports multiple perspectives in a parallel structure and offers high flexibility in the addition, deletion, and modification of different visualizations. It validates its design through a prototype containing a number of innovative arrangements and options, which effectively improved trial users’ under-standing.
Thesis Supervisor: Howard E. Shrobe Title: Principal Research Scientist Thesis Supervisor: Patrick H. Winston
Acknowledgments
I would have found this thesis work impossible to conduct without the help of my advisors, many friends, colleagues, and my family.
I am eternally indebted to my thesis advisors, Howie Shrobe and Patrick Win-ston, for their guidance, inspiration, and support, and to my supervisor, Dr. Paul Keel, in particular, for generously sharing his knowledge and for always being there to rescue me out of crisis.
Among my colleagues in AIRE and EWall, I am indebted to Stephen Peters for his patience and for always showing me extra kindess; to Max Van Kleek for his friendship and for debugging my code at 3am, to Harold Fox for his unique insights and sense of humor. I also thank everyone in lab for making coming in something to look forward to everyday.
I have been lucky to have had the chance to collaborate with Alvise Simondetti and Duncan Wilson from ARUP. I thank them for constant feedback on my work.
I would also like to express my sincerest gratitude to Dr. Robert Laddaga, Pro-fessor Randall Davis, and especially to Aaron Adler and Dr. Paul Robertson for painstakingly going through my thesis drafts and providing invaluable comments.
Last, but not least, I am forever grateful to my parents for their love and for putting up with me, my little brother Zhenye Xak Mei and my adorable Kelly Clancy for their indulgence and going out of their way to help me out and keep my sanity intact, my beloved Kazutaka Takahashi for his patience, support and care.
Contents
1 Introduction 19
1.1 The Significance of Visualization . . . 19
1.2 Goal . . . 21 1.2.1 Problem . . . 22 1.2.2 Guiding Principles . . . 24 1.2.3 Implications . . . 25 1.3 Examples . . . 26 1.3.1 Matrix Arrangement . . . 26 1.3.2 Landscape Arrangement . . . 27 1.3.3 Highway Option . . . 27 1.3.4 Sizing Option . . . 28 1.3.5 Convergence Option . . . 28 1.4 Specialized Definition . . . 29 1.5 Overview . . . 31 2 Related Work 33 2.1 ThinkMap . . . 33
2.2 Conversation Map . . . 35 2.3 Graph Layout . . . 36 2.4 Visual Who . . . 37 2.5 Websom . . . 38 2.6 Chat Circle . . . 39 3 Background 43 3.1 EWall . . . 43 3.1.1 EWall modules . . . 44 3.2 AIRE . . . 45 3.3 ARUP . . . 46 4 Architecture 47 4.1 Model View Paradigm . . . 48
4.2 Functional Units . . . 50 4.3 Main Controller . . . 50 4.4 I/O Interface . . . 51 4.4.1 Input . . . 52 4.4.2 Output . . . 54 4.4.3 Discussion . . . 56 4.5 Data Processor . . . 57 4.5.1 Filter . . . 57 4.5.2 Scaler . . . 57 4.5.3 Interpreter . . . 58
4.5.4 Discussion . . . 58 4.6 Display . . . 58 4.6.1 Arrangements . . . 59 4.6.2 Options . . . 60 4.6.3 Discussion . . . 61 5 Back End 63 5.1 Input . . . 63 5.1.1 File . . . 64 5.1.2 Transaction . . . 65 5.2 Output . . . 66 5.2.1 Information Objects . . . 67 5.2.2 Connections . . . 68 5.2.3 Transactions . . . 68 5.3 Data Processing . . . 69
6 Front End: Arrangements 71 6.1 Overview . . . 72 6.2 Evaluation Arrangements . . . 73 6.2.1 Default Arrangement . . . 73 6.2.2 Random Arrangement . . . 73 6.3 Content Arrangements . . . 78 6.3.1 Landscape Arrangement . . . 79 6.3.2 Timeline Arrangement . . . 85
6.4 Connection Arrangements . . . 87
6.4.1 Circle Arrangement . . . 88
6.5 Association Arrangements . . . 92
6.5.1 Matrix Arrangement . . . 93
6.5.2 Spring Arrangement . . . 96
7 Front End: Options 99 7.1 Overview . . . 99
7.2 Size Options . . . 100
7.2.1 Normal Node Size . . . 101
7.2.2 Medium Node Size . . . 102
7.2.3 Small Node Size . . . 103
7.3 Link Options . . . 104 7.3.1 Highway . . . 104 7.3.2 Links Visible . . . 108 7.4 Context Options . . . 109 7.4.1 Sequence . . . 109 7.4.2 Transparency . . . 110 7.4.3 Sizing . . . 113 7.4.4 Age . . . 114 7.4.5 Weight . . . 114 7.4.6 Priority . . . 115 7.4.7 Convergence . . . 115
7.4.8 Location . . . 116 7.4.9 People . . . 116 7.4.10 Content . . . 118 8 Conclusion 121 8.1 Results . . . 121 8.2 Contribution . . . 122
List of Figures
1-1 A visualization by the Map.Net program [15] using symbols, and small, medium, and large objects to represent various levels of web-sites. Color, size, border thickness, text stroke, and other visual di-mensions, with a total of more than twenty, are to encode various
properties. . . 22
1-2 A plot of five data points [17] using all 3D spatial dimensions, color, text, and mirror image of the entire plot. . . 23
1-3 A sample exploration of a visualization by [18] for up to 7 million articles. . . 24
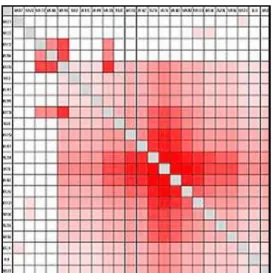
1-4 Matrix Arrangement screen shot. . . 26
1-5 Landscape Arrangement screen shot. . . 27
1-6 Highway option screen shot. . . 27
1-7 Sizing option screen shot. . . 28
1-8 Convergence option screen shot. . . 28
2-1 ThinkMap screen shot. . . 34
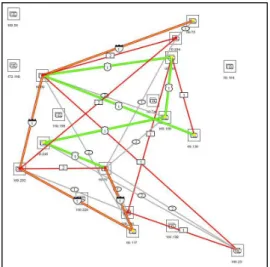
2-3 Graph Layout screen shot. . . 37
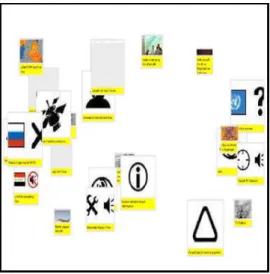
2-4 Visual Who screen shot. . . 38
2-5 Websom screen shot. . . 39
2-6 Chat Circle conversation mode screen shot. . . 40
2-7 Chat Circle history mode screen shot. . . 41
4-1 Communication flow through the functional units. . . 47
4-2 Inputs are processed by components in the input unit, then sent to the main controller. Outputs are circulated from the main controller and written into the appropriate formats by the designated compo-nents in the output unit. . . 51
4-3 A sample line from the incoming weblog is converted to the standard XML format. . . 53
4-4 A sample line from the incoming communication log is converted to the standard XML format. . . 53
4-5 A sample line from the standard XML file output. . . 55
4-6 A sample standard XML transaction output. . . 56
4-7 File bits sent from the main controller to the data processor are trans-formed into information objects and connections by the filter, the scaler, and the interpreter, and then sent back to the main controller. 57 4-8 Preprocessed information flows down from the main controller to the display unit. User inputs flow back up from the display unit to the main controller. . . 59
5-1 A sample standard format XML file input. . . 64
5-2 A sample standard format XML transaction input. . . 66
6-1 The toolbar. Buttons in the bracket correspond to various arrange-ments. . . 72
6-2 Default Arrangement screen shot. . . 73
6-3 Random Arrangement screen shot. . . 73
6-4 Value ranges for node center placement’s (a)x- and (b)y-coordinates. 74 6-5 Case two flowchart. . . 75
6-6 Case two screen shot. . . 76
6-7 Time duration indicators in (a)time and (b)date format. . . 79
6-8 Landscape Arrangement screen shot. . . 80
6-9 Screen shots showing similar daily pattern in weblogs from two dif-ferent days where the number of access range from (a)a few hundred to (b)more than three thousand. . . 81
6-10 When contents in the EWall Workspace Module are (a)disorganized, Landscape Arrangement graphs (b)high peaks. . . 82
6-11 When contents in the EWall Workspace Module are (a)organized, Landscape Arrangement graphs (b)low peaks. . . 83
6-12 NewsView screen shot. . . 85
6-14 Node ordering changes as the center of gravity (marked by an arrow) is moved from (a)the rim (b)towards the center of the circle until it
reaches (c)the center. . . 88
6-15 Screen shot of communication log visualization by Circle Arrangement. 89 6-16 Node (represented by their index numbers in the sorted connectivity list) ordering changes as the center of gravity is moved from (a)the rim (b)towards the center of the circle until it reaches (c)the center. . 91
6-16 (a)Symmetric and (b)assymetric Matrix Arrangement screen shots. . 93
6-18 Optimized indices ordering screen shot. . . 94
6-19 Matrix Arrangement point system. Different sample placements with (a)initial, (b)same, and (c)improved total points. . . 95
6-20 Spring Arrangement screen shot. . . 96
7-1 The toolbar. The buttons in the bracket correspond to various options.100 7-2 An E-Card. . . 101
7-3 (a) A person/IP node; (b) a location node; (c) a content node. . . 102
7-4 Small Node Size option screen shot. . . 103
7-5 Highway option screen shot. . . 104
7-6 (a)Basic search graph (b)highway mapping on top of it. . . 105
7-7 The total length for path A-B-C-D-E is 4 versus 3 for path A-E. How-ever, A-E should be the chosen highway because its edge weight is larger than any single edge in the first path. . . 106
7-8 Highways: (a)level one and two; (b)level three and four; and
(c)level one, two, four, and five. . . 107
7-9 Link Visible in Spring Arrangement screen shots: Links in (a)the basic graph are (b)invisible for cluster analysis or (c)highway highlights. . 108
7-10 Sequence option mock-up. . . 109
7-11 When the Transparency option is selected, the group of options to the right is enabled; when the Transparency option is deselected, the group is disabled. . . 110
7-12 Transparency option screen shot. . . 111
7-13 An ECard is (a)fully opaque, (b)uniformly and (b)partially transparent.112 7-14 When the Sizing option is selected, the group of options to the right is enabled; when the Sizing option is deselected, the group is disabled113 7-15 Sizing option screen shot. . . 113
7-16 Screen shot of the Age option with the Sizing option. . . 114
7-17 Screen shot of the Weight option with the Fading option. . . 114
7-18 Screen shot of the Priority option with the Sizing option. . . 115
7-19 When the Convergence option is selected, the group of options to the right is enabled; when the Convergence option is deselected, the group is disabled. . . 115
7-20 Screen shot of the Location option combined with the Circle Arrange-ment. . . 116
7-21 Mapping of location nodes’ placement. Location node A is mapped in the middle of the center of people nodes 1, 2, 3, and 5, whereas location node B is mapped in the middle of nodes 4 and 6. . . 116 7-22 Screen shots of the People option with the Circle Arrangement. When
the people nodes on the rim are reordered, the location nodes’ place-ments are updated accordingly. . . 117 7-23 Screen shots of the Content option with the Circle Arrangement.
When the people nodes on the rim are reordered, the location and content nodes’ placements are updated accordingly. . . 119
Chapter 1
Introduction
The goal of visualization is to help human understand, reason, and learn better and quicker. In pursuit of this goal, this thesis presents an architecture for intelligent visualization systems, which supports multiple perspectives in a parallel structure structure and offers high flexibility in the addition, deletion, and modification of different visualizations. It validates its design through a prototype containing a number of innovative arrangements and options, which effectively improved trial users’ understanding.
1.1 The Significance of Visualization
“A picture is worth a thousand words.” Before character systems were established in civilization, human records consisted solely of pictures. Today, we still rely heavily on visualization to gain better and quicker understandings, by presenting abstract concepts in visual forms or geometric metaphors. For example, software diagrams
and data structures are used in learning abstract software concepts; growth rate, heartbeats, and brain waves are also frequently plotted to help detect abnormal patterns. Human reasoning is often visual in nature: hierarchical family structures are named “trees” and social groups “circles”. As Patrick Winston stated in [19], “Vision makes it possible to solve problems that would otherwise be difficult or impossible.”
Ever since 6200 BC [8], when one of the oldest known maps was made, vi-sualization has been used for navigation and exploration. The need for statistical graphs was initiated during development of precise physical quantity measurements in the 16th century, marking the beginning of advancement in visualization. Dur-ing the followDur-ing century, new graphical forms were invented such as topographic maps. Development in statistical theory in the 18th century further fueled the rapid growth of visualization, since large quantities of data could then be analyzed. As statistics in social, economic and other fields were gathered, and official state sta-tistical offices were established throughout Europe, the importance in the study of visualization was publicly recognized. Towards mid-19th century, visualization was used to provide new insights in other fields, such as physics and biology. Finally, innovations in graphical approaches and evolution in computers lead to a bloom in new visualization techniques.
In today’s world, visualization has become increasingly significant as the quan-tity and complexity of data grow with the rapid interactions between geographical regions, between commercial industries, and between academic disciplines. Good visualization not only reduces the difficulty caused by language and expertise
dif-ference but also makes huge quantities of data manageable.
1.2 Goal
This thesis work aims to provide an architecture for intelligent visualization sys-tems, and to help users better understand data. It presents simple perspectives with different foci on individual aspects of the same processed information. In a wider context, it will serve as a platform for future user studies in human visual processing, leading to a better understanding of human intelligence.
The specific goal of this project was to design, implement, and test the HAPPIE system 1, which is highly adaptable to a wide variety of inputs and allows easy
addition, deletion, and modification of various visualizations.
1Hetro-Aesthetic Parallel-Perspective Intelligent Eye, a system intended to help users “see” better.
It is named after my windows box, happy.csail.mit.edu, who got increasingly depressed during the course of thesis work, but will hopefully recover shortly hereafter.
1.2.1 Problem
This thesis work began with an extensive survey and analysis of both commercial visualization applications and academic research projects (see Chapter 2). Three main shortcomings were identified as common among them.
First, all information properties are packed into one intricate visualization through multiple mappings with copious visual dimensions, as seen in [4] and
Figure 1-1: A visualization by the Map.Net program [15] using symbols, and small, medium, and large objects to represent various levels of websites. Color, size, border thickness, text stroke, and other visual dimensions, with a total of more than twenty, are used to encode various properties.
[15]. To locate a specific prop-erty, users must find out the correct mapping in the visual-ization. As a result, they are burdened with an investigation process, with a duration propor-tional to the complexity of the visualization. During this pro-cess, users have to consider all visual dimensions in use, some-times more than twenty of them, as illustrated in Figure 1-1,
before they can locate the information of interest. For example, in the image, the number of pages found at each website is represented by the size of the red dot inside the symbol for the site. Unfortunately, before users discover this association,
they must explore the meaning encoded in the color, shape, and size, as well as many other visual dimensions associated with screen objects, in addition to those associated with links between objects, background, text, and all other visual com-ponents. Figure 1-2: A plot of five data points [17] using all 3D spatial dimensions, color, text, and mirror image of the entire plot. 2
Second, the number of visual dimensions used exceeds what was necessary. Users’ navigation process, as described in the first problem, is further aggravated by the unnecessary multiplicity of visual encoding of content information, as illustrated in Figure 1-2. Clearly, a visualization with twenty visual dimensions, using four dimensions for each information property, takes much more labor to decipher than a visualization with five visual dimensions, in which each represents an information property. Because users have to learn a long list of mappings when a few would have been sufficient, this drawback not only wastes time and energy but also leads to potential confusion.
Third, the amount of information presented to users is overwhelming. For example, Figure 1-3shows over one million data points packed into a single visualization. To accommodate such vast data sets and to allow users to view a specific data point in detail, extensive zooming features are required. One approach was to put the zoomed views on the same page as seen in [4] and [16]. This layout not only costs space and brings distraction, but also reduces the possible size of the main
2Edward Tufte commented, “This may well be the worst graphic ever to find its way into print.”
Figure 1-3: A sample exploration of a visualization by [18] for up to 7 million articles.
visualization, therefore reducing its potential content vol-ume and complexity. Another approach was to allow users to zoom in and out on the same visualization, as seen in [2] and [14]. With a data set of high magnitude, it takes a few magnifications to reach an actual object representing a data point, identical to the common map navigation process. However, in data navigation processes, users are unfamiliar with the structure of the output. As a result,
after several magnifications, it is no longer trivial to recollect and grasp where the current detailed branch on the screen fits in the big picture of the overall visualiza-tion, causing a decrease in users’ understanding of the conceptual structures.
1.2.2 Guiding Principles
The direction of this thesis work is shaped by three principles, in order to improve upon the three weaknesses described in the previous section.
Simplicity: Less is more.
Parallel Perspectives: Plots, tables, figures, and many other visualization forms
are customarily used to exhibit the same idea and aid the understanding process. Because each representation focuses on a separate aspect and characteristic of the same content, the only way to take advantage of all visualizations and have different visualizations complement each other is to provide all of them in a parallel structure
for the user. Each occupies the full screen one at a time, to allow maximum capacity.
Intelligence: Regardless of the complexity involved in visualization, a system
can-not be considered intelligent if it always presents everything it is given and every-thing it knows to users. To be able to assist users, a system must first understand its own content, and then present partially interpreted information, reducing users’ work load. Finally, the system can obtain feedback from users to gain additional knowledge regarding users’ preferred ways of thinking. The system then improves, using the feedback, by itself or with the developer’s help.
1.2.3 Implications
This thesis work is a step towards the larger goal of understanding human intelli-gence. As Winston stresses in [19], “It is hard to imagine how we can understand how the brain thinks unless we understand how it sees.” Like Winston, many AI scientists believe that human intelligence lies partially within the vision channel.
This thesis work will contribute towards the goal of building a real AI system, one that substantially understands human intelligence and is capable of imitating the human thought process. An “imperfect” AI system, such as HAPPIE, with lim-ited knowledge of human intelligence, can aid human users in some parts of the thought process. Specifically, HAPPIE, with an understanding of visual processing, can provide tangible assistance in three ways: 1) by participating in recognition and digestion of relevant data; 2) by facilitating the interpretation of data and its associ-ation with existing knowledge; and 3) by exposing users to alternative perspectives
and unrecognized insights. Finally, the results from user studies, conducted at the end of the thesis work, may shed light on human vision processing and enrich our understanding of human intelligence.
1.3 Examples
The following are examples of some of the implemented arrangements and options.
1.3.1 Matrix Arrangement
Figure 1-4: Matrix Arrangement screen shot.
The Matrix Arrangement conducts link analysis by presenting each link as a grid and sorting the indices, which represent information objects, to cluster the most important links around the diagonal.
1.3.2 Landscape Arrangement
Figure 1-5: Landscape Arrangement screen shot.
The Landscape Arrangement presents a development trend by graphing the re-lationship between two information properties.
1.3.3 Highway Option
Figure 1-6: Highway option screen shot.
The Highway option calculates and highlights the most important paths in any arrangement, in which connections are visualized as edges.
1.3.4 Sizing Option
Figure 1-7: Sizing option screen shot.
The Sizing option alters the size of information objects displayed on the screen according to one of three user specified criteria.
1.3.5 Convergence Option
Figure 1-8: Convergence option screen shot.
The Convergence option combines different types of data and analyzes the rela-tionship between them.
1.4 Specialized Definition
The terms defined below have specific meanings throughout the scope of this thesis.
It is important to distinguish data, information, and knowledge, as each refers to the input at different stages of the data processing procedure.
data Data are factual unprocessed values, carrying no significance on their own. Examples of data are images, text, and visitor logs.
information Once data are interpreted, they take on meaning and be-come processed and subjective information, containing a purpose and a meaning within a given context. Information is a collection of evidence, which provides answers to “who”, “what”, “where”, and “when” questions. Examples of information are pictures from an event, emails, and activity pattern plots.
knowledge Knowledge is a collection of applicable information, which provides answers to “how” and “why” questions. Only users can ac-quire knowledge but the system aims to help users by filtering out irrelevant information and hopes to inspire new insights by providing alternative perspectives. Examples of knowledge are evaluation of how successful an event was based on the pictures, agreement on an issue based on emails exchanged, and insight on a better distribution of security force based on the visitor traffic plot.
A clear distinction is made between the usage of visualization and arrangement.
visualization Visualizing refers to the action of presenting content and vi-sualization refers to the end result on the screen. An example of visualizing process is the laying out of images. An example of visual-ization is a family tree chart.
arrangement Arrangements are visualization mechanisms that map the given data set to a specific visual pattern in order to focus on one unique aspect of the data, such as connectivity, distribution, or change over time. Arrangements carry out the visualizing activity and present the final visualizations to users. Examples of arrangement are random distribution, circle layout, and table structure.
For clarification, other terms with specific meanings are defined as follows:
content in context In the visualizing process, content is preserved though transferred to different contexts. In other words, the material remains unchanged as it is shifted through different frames, in which concep-tual dimensions are mapped to visual dimensions.
deep copy Deep copy, also called clone, is a copy of an object that contains the entire encapsulated information of the original object, without sharing information with the object. By having no association with the original object, the clone can be used independently of the object.
visual dimension Visual dimensions are independent alterable properties in the display. Examples of visual dimension are border color, link thickness, and text size.
weblog Weblogs are logs produced by a webserver in order to record accesses to individual pages controlled by the server. Generally, entries in weblogs contain details about the pages being accessed, identities of the parties accessing the page, time stamps of the accesses, and other information that the webserver recognizes.
1.5 Overview
Chapter 2 of this thesis provides additional background information, specifically on collaboration groups and the data provider. This thesis proceeds to describe the HAPPIE system in detail. Specifically, Chapter 3 explains the design considerations and the architecture. Chapter 4 covers the data interpretation carried out by the back end. Chapter 5 and Chapter 6 list arrangements and options in the visualiza-tion front end. This thesis concludes with related work in the data visualizavisualiza-tion field, highlighted in Chapter 7, followed in Chapter 8 by a summary of the contri-bution that this work may offer.
Chapter 2
Related Work
This thesis work began by surveying various commercial visualization applications and academic research projects. Six of them, each representative of the various visualization philosophies, were examined in detail. I isolated and built upon the more successful aspects of these applications while avoiding the pitfalls inherent in each one.
2.1 ThinkMap
ThinkMap from Plumb Design [16] is an elaborate application with easily compre-hensible user interface. It presents a diverse range of knowledge and relationships with the aid of three separate displays, as shown in Figure 2-1. The user can view connections between the current data topic and other objects in the database, while exploring the topic in more detail in the spatial and chronological dimensions.
com-Figure 2-1: ThinkMap screen shot.
plete a data table and a relation table, and then select display properties for the appearance and interactions of data objects. Next, developers create, test, and deploy the implementation with Preview Window. Users browse and select data objects on all displays concurrently with actions customized by the developers to activate fields and changes in displays. Commonly, the last selected object moves to the center of the spider display, surrounded by connected data objects, while other displays lay out related information or related data objects.
ThinkMap is useful especially in commercial applications given its impressive, complex, and comprehensive nature. That is indeed the functionality of most of its developed applications. However, its high graphic intensity imposes high system requirements. In addition to having a multi-visualization approach, the same data objects are shown repetitively on multiple displays with no alteration in their ap-pearance. Both of these features impose a limit on the size and complexity of each display.
2.2 Conversation Map
Conversation Map [4] visualizes text messages of a communication archive database supplied by the user. It provides a global view of the database as a whole, close-ups of specific threads and topics, as well as full details of individual messages with links to related documents. The system analyzes data and relationships to aid understanding and interpretation of knowledge. It functions efficiently with min-imum inputs from the user, requiring minimal network bandwidth and graphical resources due to its mostly text based output and simple graphics, as illustrated in Figure 2-2.
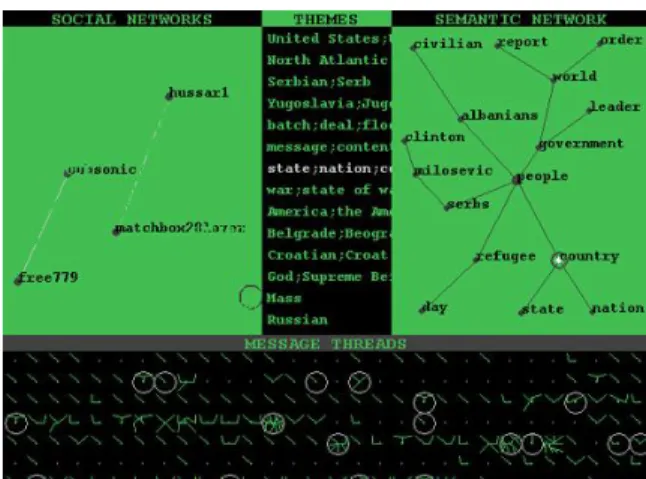
Figure 2-2: Conversation Map screen shot.
The output of Conversation Map has three hierarchical levels:
Database level: Conversation Map computes four fields to display interaction, commonality, correlation, and activeness in communication threads. The Social Networks field plots participants and citations/replies as nodes and edges where the rate of interaction dictates edge lengths. The Discussion Themes field analyzes the lexical cohesion in messages and lists all topics. The Message Thread field graphs
the vivacity of communication as webs in equally sized boxes, showing density of contacts in each thread.
Communication thread level: A window made of three separate panels lists the participants, the themes, and plots a spider web graph centered at the initial mes-sage with all responses as linked nodes branching out.
Message level: System lists the subject, author, organization, group, date, ID, references, links to previous and next messages, and the message body with hyper-text quotations lead quoted message.
Conversation Map is useful for modestly sized communication archives. It is not scalable due to its lack of hierarchical categorizations. Only a limited amount of leg-ible text can fit in a given screen size. Scrolling leads to confusion and elimination of text labels will lead to ambiguity. Also, because there is no mechanism to avoid overlaps in display, group labels will eventually be overwhelming and unreadable. Its displays and functions are only developed and useful for communication archive type databases.
2.3 Graph Layout
Graph Layout repositions data points and edges to create a clean display with the least number of overlapping edges. It calculates the coordinates of nodes repre-senting data objects and edges reprerepre-senting relationships based on specific criteria given by the user. A graph is then displayed on the screen with the nodes and edges, as illustrated in Figure 2-3.
Figure 2-3: Graph Layout screen shot.
There are two deficiencies in Graph Layout. With limited visual dimensions, Graph Layout cannot represent complex data relation dimensions. Also, Graph Layout is not applicable for highly connected data, for the number of edges grow at order of n squared, and they will overlap and tangle, regardless of the algorithm.
In conclusion, Graph layout is not useful unless the purpose of visualization is to present a few types of relationships and the connections between data objects are sparse.
2.4 Visual Who
Visual Who gives the user flexibility to define grouping layout and generates a clear overview of all document correlation and global distribution.
Objects are rendered with a minimum set of visual dimensions representing all system states and developments. The system automatically repositions with addi-tion, movement, or deletion of anchors, insuring its flexibility and scalability. It has
Figure 2-4: Visual Who screen shot.
fast loading time because the displays only consist of colored text user names, as illustrated in Figure 2-4.
Unfortunately, Visual Who only gives an overview of a community without browsing or reading abilities, since names overlap on the display, making it impos-sible to analyze concentrated areas and therefore limiting the system’s effectiveness. Visual Who utilizes a minimum of resources to illustrate a clear overview of a large community. Unfortunately, that is the only use for the system, due to lack of hierarchical structure and overlap in display.
2.5 Websom
WEBSOM automatically categorizes documents into groups based on their content. Related groups cluster to allow approximations of topics.
WEBSOM is convenient because input documents are automatically organized into labelled clusters with related neighbors. Related categories are displayed
ad-Figure 2-5: Websom screen shot.
jacently for approximation of groupings, allowing categories to overlay instead of having rigidly separated ones, as illustrated in Figure 2-5.
The number of categories is highly restricted. In a given window size, only a limited number of legible text labels can be displayed. It has a homogeneous display of clusters, but the identical look and lack of spatial pattern makes it challenging to identify clusters. It is difficult to find the correct documents because the user needs to know the exact region of the document category to retrieve it.
WEBSOM is meant to be helpful in narrowing down searches and locating re-lated groups. However, familiarity with the categories automatically generated by the system is required to obtain accurate search results.
2.6 Chat Circle
Chat Circle is a primitive collaboration display application. It relies purely on exter-nal inputs to group messages by user name, user chosen topics and record them by
time. It is efficient in utilizing graphical visual dimensions.
Chat Circle has two screen modes: conversation mode and history mode. Solid circles and message bars are related to the user’s interest threads during a specific time period; the rest are not filled.
When Chat Circle is in conversation mode, it displays each user name next to a colored circle which brightens and expands for a few seconds when the participant inputs a message, then shrinks down gradually to a dot as participant idles, as illustrated in Figure 2-6.
Figure 2-6: Chat Circle conversation mode screen shot.
When Chat Circle is in history mode, archives of conversations are stored as col-ored vertical rods for individual participants symbolizing login sessions over time. Messages posted by each participant are saved as horizontal bars placed at the post-ing time on the participant’s own rod. Each message bar displays its message when rolled over by the mouse, and its length is proportional to its message size, as illus-trated in Figure 2-7.
commu-Figure 2-7: Chat Circle history mode screen shot.
nity activities as well as individual interactions are equally well presented. Espe-cially important threads can also be highlighted. It maximizes display resources by having a one to one mapping between different data fields and visual dimensions such as position, size, color, and transparency.
Chat Circle is inconvenient because users are not allowed to determine the posi-tion of threads, and therefore cannot monitor all interesting threads unless they are near each other on the graph. Within a given window size, only a limited number of messages and users be shown at once, restricting the system’s capacity. It is not efficient since regions of Chat Circle need to be re-graphed with every input, lim-iting the screen refresh rate. Because each user is represented by a small colored dot with a user name, it is likely to get lost in a large chat window and fail to lo-cate a user. Finally, it does not support privacy because messages are strictly public information.
Chapter 3
Background
3.1 EWall
The EWall project concentrates on providing users with an intelligent environment to improve the efficiency and effectiveness of information collection, manipulation, and organization, as well as inter-user communication and collaboration. EWall’s salient idea is the appropriate modularization level of a “card” for encapsulating information. A card puts restraints on the complexity of objects displayed, as only a modest amount of information can be presented in the area of each card. Yet, a card’s information domain is not as limited as its display domain: it can contain other information such as links to related files. In addition, the format of a card provides standardization for potentially radically different information.
3.1.1 EWall modules
There are five divisions in the EWall project: the EWall Workspace Module, the EWall Exchange Module, the EWAll NewsView Module, the EWall Database Mod-ule, and the EWall Visualization Module. This thesis work implements the EWall Visualization Module.
EWall Workspace Module
The EWall Workspace Module provides a designated area for users to gather, edit, and arrange information. It standardizes each entry, regardless of the content or the format, into an isolated information object, in the predefined ECard format. An entry could be an idea, a piece of evidence for an idea, or a news item, in the format of pure text, an image, or a file.
EWall Exchange Module
The EWall Exchange Module coordinates collaboration and information sharing be-tween individual users, bebe-tween groups, and bebe-tween single users and groups. Communications between Workspace Modules are recorded as transactions, con-taining only the updated information properties (see Section 5.1.2), to minimize communication flow and therefore increase scalability.
EWall NewsView Module
The EWall NewsView Module collects updates on existing information, messages exchanged between collaborating Workspace Modules, and outside news bits via servers communicating with news sources.
EWall Database Module
The EWall Database Module archives all ECards and modifications to them within Workspace Modules, as well as transactions between communicating Workspace Modules. The module creates relations between objects in its depository, connecting previously isolated clusters.
EWall Visualization Module
Although the HAPPIE system is designed as a stand-alone application, it also func-tions as the EWall Visualization Module. It can visualize the content of a single user’s work on one Workspace Module. It can visualize combined content from several user’s work on multiple Workspace Modules linked through the Exchange Module. It can also visualize partial or all information stored inside the NewsView module and the Database Module.
3.2 AIRE
Agent-based Intelligent Reactive Environments, AIRE [1], is a research group at the MIT Computer Science and Artificial Intelligence Laboratory. AIRE is dedicated to
examining how to design pervasive computing systems and applications for people. To study this, AIRE designs and constructs Intelligent Environments (IEs), which are spaces augmented with basic perceptual sensing, speech recognition, and dis-tributed agent logic.
This thesis work has collaborated with AIRE group to explore potential applica-tions and testing platforms for the system.
3.3 ARUP
ARUP is an international engineering consulting firm. This thesis work was con-ducted in close collaboration with ARUP personnel. Throughout the development of HAPPIE, weblogs and communication logs were provided by ARUP for testing. Bi-weekly meetings with employees from ARUP were also held, providing feedback for constant improvements to the system. A week-long site visit was made after a prototype had been completed. After presentations of the work, ARUP engineers and managers contributed further comments on the effectiveness and potential ap-plications of the system.
Chapter 4
Architecture
I/O Main Controller Data Processor Display Figure 4-1: Communication flow through the functional units.Maximizing the flexibility and the expandability of the HAPPIE system are the two central goals of the architec-ture of the system, as illustrated in Figure 4-1. Starting from the I/O unit of the system, detailed in Section 4.4, using the interlingua approach [3], a standard format is enforced while mini translators are created to allow vari-ous other file and transaction formats. The addition and deletion of supported formats can be conveniently accom-plished by introducing new translators or removing exist-ing translators, as explained in Section 4.4.3.
The data processor is modularized such that the entire procedure of input data interpretation can be customized, by modifying or aug-menting components in the data processor responsible for the specific steps, as
described in Section 4.5.4. The operation could also be elaborated by inserting new components into the processor at any step.
Finally, the display unit allows simple addition, deletion, activation, and de-activation of its components, which are arrangements and options, as detailed in Section 4.6.3.
4.1 Model View Paradigm
The design follows the model-view-controller paradigm, explained in detail in Chapter 41 of [21]. The guiding principle of the model view paradigm is to com-pletely isolate the model from the view, such that elements containing content information are insulated from elements containing display information. No direct communication is allowed between these two types of elements. Instead, messen-gers between the elements are used to deliver notifications regarding modifications, additions, and deletions. Messages from the model to the view are transported via messengers called observers, whereas messages from the view to the model travel via messengers called listeners.
The main controller, described in Section 4.3, acts as the application class, which creates the model, the view, the observers, and the listeners, initiates connections from the model to the observers to the view, as well as connections from the view to the listeners to the model.
The model is the master copy of content information, maintained in the main controller. Individual copies of information object views and connection views are
produced based on the master model copy then sent to the arrangements, detailed in Section 4.6. Skeleton information including images and text content to be vi-sualized are included in the initial copy created for each arrangement from the main controller. Individual arrangements define all other view information, such as weight, height, and color for each information object view and each connection view during the visualization process. The final visualization, composed of all ar-rangements, extracts those field values from the local view copy. Visualizations are detailed in Chapter 6 and Chapter 7.
User input received by arrangements are stored in arrangements. A notification is sent to the observer responsible for the particular view element with the change. The observer probes the view element for the change and transmits the change to the main controller to update the corresponding model element in the master model copy. Symmetrically, after the main controller receives input through the I/O unit (see Section 4.4), runs it through the data processor (see Section 4.5), and updates the master model copy accordingly, and the listener affiliated with the changed model element is informed. The listener obtains the change from the model element and relays the information to connected view element.
The model view paradigm highly simplifies the architecture by allowing each arrangement to define the appearance of its view elements - in other words, how to display them. What to display, on the other hand, stays exclusively in a single master model copy with all updates amended directly on that copy. This satisfies the design goals, by allowing flexible view copies to be removed and modified, and places no restraint on the number of new view copies to be added.
4.2 Functional Units
There are four functional units: the main controller, the I/O interface, the data processor, and the display component. As illustrated in Figure 4-1, data enters the I/O unit, and then moves to the main controller. The main controller feeds the data into the data processor and receives refined output: information objects as well as the connections between those objects. The information objects and connections are then sent to the display to be presented to the user. Users can interact with the display and provide feedback, which is then propagated back to the main controller, directed to the I/O unit, and outputted from there as files or transactions.
4.3 Main Controller
The main controller is connected to all other functional units. It directs the flow of data, information, and requests from one unit to another. Information is archived, cloned, and updated as needed in the main controller.
The main controller saves a master copy of the information objects and con-nections. It then distributes a deep copy of the master copy to each visualization arrangement in the display unit. This way, each arrangement has independent con-trol over its own copy, without influencing the work done in all other arrangements.
4.4 I/O Interface
The I/O interface consists of an input and an output unit, illustrated in Figure 4-2.
Main Controller Data Processor Display
File
Reader
Translator
Transaction
Receiver
standard XML File non-standard fileFile Writer
InputTransaction
Router
OutputI/O Unit
non-standard transaction standard transaction standard XML File standard transaction rendered as standard XML File rendered as standard transactionFigure 4-2: Inputs are processed by components in the input unit, then sent to the main controller. Outputs are circulated from the main controller and written into the appropriate formats by the designated components in the output unit.
4.4.1 Input
The input unit is composed of three components, as illustrated in Figure 4-2. Each of the components is designated to a specific input data type: non-standard files, standard XML files, or transactions. Non-standard files or non-standard transactions are first converted to standard format XML files or standard transactions by the translator, then sent to the file reader or the transaction receiver. Standard XML files and standard transactions are received directly by the file reader and the transaction receiver, respectively.
Translator
The translator is a collection of mini-convertors, each of which is created for a special file format or a special transaction format. All mini-convertors are linked to the file writer or the transaction router. When data are properly extracted out of the files or transactions, they are then rendered as standard XML files or standard transactions. Currently two convertors have been made, one for weblogs and the other for communication logs. Both convertors parse incoming files line by line, extracting data according to preprogrammed ordering and field value locations.
Weblog Convertor
In the following example, the weblog convertor first takes a line from a weblog, then parses the line into values for individual fields, such as time, IP address, username, retrieval method, and URL stem. Next, the file writer obtains the extracted field
values and renders them as a standard XML file, as illustrated in Figure 4-3. weblog standard XML File 09:58:45 69.113.1.214 - GET /taps\_help/taps.htm - 200 1191 Mozilla/4.0+(compatible;+MSIE+5.01;+Windows+NT+5.0 SITESERVER=ID=362ba234d6c9e12e39124b29b5d566a0
Translator (Weblog Convertor)
<time>09:58:45</time> <ip>69.113.1.214</ip>
<retrieval method>GET</retrieval method> <url stem>/taps\_help/taps.htm</url stem>
...
...
Figure 4-3: A sample line from the incoming weblog is converted to the standard XML format.
Communication Log Convertor
Similarly, the communication log convertor takes a line from a communication log, then parses it into values for individual fields, such as “from name”, “from address”, “to name”, “to address”, “cc name”, “cc address”, and “subject”. Next, the file writer obtains the extracted field values and renders them as a standard XML file, as illus-trated in Figure 4-4 .
comm. log
standard XML File "Duncan Wilson","[email protected]"," `Student
Business Project 2' ","[email protected]"," `Duncan Wilson' ", "[email protected]",,,"RE:Agenda"
Translator (Communication Log Convertor)
<from name>Duncan Wilson</from name>
<from address>[email protected]</from address> <to name>Student Business Project 2</to name>
<to address>[email protected]</to address> <cc name>Duncan Wilson</cc name>
<cc address>[email protected]</cc address> <subject>RE: Agenda</subject>
...
...
Figure 4-4: A sample line from the incoming communication log is converted to the standard XML format.
Non-standard Transactions Convertor
For a non-standard transaction, a convertor identical to the two built for weblogs and communication logs can be easily implemented. The convertor will go through the same procedures to separate data fields from the given identifier, extract data from each separated field in the specified order, and render the extracted data as a standard transaction by the transaction router.
File Reader
The file reader accepts files in the standard XML file format, as described in Section 5.1.1. Values wrapped inside the XML tags are saved as file bits, indexed by the XML start tags. The file bits are later transformed into information objects and connections, as described in Section 4.5.
Transaction Receiver
The transaction receiver accepts transactions in the standard transaction format, as described in Section 5.1.2. Values wrapped inside the XML tags indicate updates to the existing information. The values are saved as data bits, indexed by the XML start tags. The data bits are later transformed into updates on existing information objects and connections, as described in Section 4.5.
4.4.2 Output
The output unit is composed of a file writer and a transaction router, each desig-nated to one of the two specific output types, standard files or standard transactions.
File Writer
The file writer outputs files in the standard XML file format, as described in Section 5.1.1. The output file has two parts, information objects and the connections. Each information object is wrapped inside the object’s XML start and end tags signifying a complete object, as illustrated in Figure 4-5. Inside the start and end tags, start and end tag pairs indicating attribute names are placed to separate attribute values. Explanation of the information objects, connections, and standard attributes can be found in Section 5.2. Similar tags envelop individual connections and their descriptions.
<object>
<ID>12345</ID>
<time stamp>1074198308588</time stamp> <weight>0.6</weight>
</object>
Figure 4-5: A sample line from the standard XML file output.
Transaction Router
The transaction router outputs transactions in the standard transaction format, as described in Section 5.1.2. The output transaction indicates four essential proper-ties for the update, including the type of change being made, the ID of the user requesting the update, the time stamp of the update, and the content of the update, all detailed in Section 5.2.3. The transaction is wrapped inside its XML start tag and end tags signifying a complete transaction, as illustrated in Figure 4-6. Inside the start and end tags, start and end tag pairs enclose individual information.
<Transaction_ version="0.1"> <Transaction_TransactionType>4</Transaction_TransactionType> <Transaction_ID> <Identifier_ version="0.1"> <Identifier_Name>ben</Identifier_Name> <Identifier_Hostname>maklaptop</Identifier_Hostname> <Identifier_HostIp>192.168.0.4</Identifier_HostIp> <Identifier_HostPort>17778</Identifier_HostPort> </Identifier_> </Transaction_ID> <Transaction_Timestamp>1083677226783</Transaction_Timestamp> <Transaction_Args> <SetTextTrans_Args version="0.1"> <SetTextTrans_ID>1083677203179</SetTextTrans_ID> <SetTextTrans_Text>test</SetTextTrans_Text> </SetTextTrans_Args> </Transaction_Args> </Transaction_>
Figure 4-6: A sample standard XML transaction output.
4.4.3 Discussion
Independent translators maximize control of the exact input file and transaction formats. When a new input format needs to be recognized by the system, only a new translator corresponding to that format needs to be added to the I/O unit. Likewise, when an input format is no longer in use, the matching translator can be removed from the I/O unit.
Equivalent control can be built for output file and transaction formats as well. Although outputs from the current version are only produced in the standard for-mat, translators similar to the ones in the input unit can be easily implemented for the output unit and convert standard outputs into other formats.
4.5 Data Processor
I/O Main Controller Data Processor Display Filter Scaler Interpreter file bits useful bits info objsinfo objs & connections
Figure 4-7: File bits sent from the main controller to the data processor are transformed into information objects and connections by the filter, the scaler, and the interpreter, and then sent back to the main
controller.
The data processor is made of three parts: the filter, the scaler, and the interpreter, as illustrated in Figure 4-7.
4.5.1 Filter
File bits sent by the main controller are first passed through the filter in the data processor. The filter then parses the bits for useful data. The selection criteria are specified in Section 5.3.
4.5.2 Scaler
The filtered useful bits are output by the filter and passed on to the scaler. The scaler defines information proper-ties with the necessary data fields. Connection properproper-ties are also defined if the input data provides data on con-nections. If the number of data points exceeds the prede-fined threshold, the points are grouped into information objects, as described in Section 5.3. Otherwise, the scaler transforms them one by one into information objects.
4.5.3 Interpreter
Finally, if no predefined connections are found between the information objects, the interpreter creates connections, as detailed in Section 5.3. The finished products of information objects and connections are then sent back to the main controller.
4.5.4 Discussion
The data processor functions as an independent entity with each data treatment step contained in separate components. Any step, or even the entire process, can be removed or replaced by changing of components. Extra components can also be added at any point of the process to further refine the data.
4.6 Display
The display unit presents the processed information objects and connections to users. The display is partitioned into arrangements and options, as illustrated in Figure 4-8, where arrangements defines the basic visualization structures and op-tions control the outlook of the final visualizaop-tions. The Model-View-Controller paradigm, described in Section 4.1, guides the distribution of content and view information. After input data is processed into a set of information objects and connections, the set is circulated back to the main controller. The controller makes deep copies of the set and sends a copy down to each arrangement in the display.
I/O Main Controller Data Processor
Display
Options
Arrangements
options on/off objs & links user input user input Figure 4-8: Preprocessed information flows down from the main controller to the display unit. User inputs flow back up from the display unit to the main controller.4.6.1 Arrangements
Detailed in Chapter 6, arrangements are visualization mechanisms that map the given data set to a specific visual pattern in order to focus on one unique aspect of the data, such as connectivity, distribution, or change over time. Examples of arrangement are the Matrix Arrangement, the Circle Arrangement, and the Landscape Arrangement.
Each arrangement functions on its own and manipulates its own copy of the information objects and connections as needed. Arrangements are not aware of the existence nor the activities of other arrangements. No information is exchanged directly between arrangements at any given time. All messages travel back to the main controller and are then delivered to the appropriate components.
When users provide feedback through an arrangement, the input is directed back to the main controller for two pur-poses. First, the main controller adjusts the master copy, and second, it distributes the information to components, including the I/O unit for output as well as other arrange-ments for modification on their copies.
4.6.2 Options
Detailed in Chapter 7, options are additional features functioning on top of arrange-ments to control the final outlook of the visualization produced by arrangearrange-ments. Examples of options are the Age Option, the Weight Option, and the Priority option, highlighting a specific information property; the Highway option, adding an extra interpretation of the existing information; and the Convergence option, allowing a few parallel information properties to be examined collectively.
Whenever users change the selection status of any of the options, that option is designated to notify all arrangements of its status change. The option requests a list of enabled arrangements from the main controller, and informs each arrangement of the change. It is then up to individual arrangements to modify their visualization following the message from the option, or to take no action if the particular option is not applicable.
A list of active options are maintained in the main controller. The main con-troller also keeps a lookup table, indexed by options, indicating all arrangements in which a particular option could be used. It is possible to compare the list of ar-rangements under a given option and the active arar-rangements list, when the option status changes. Therefore, when the option requests a list of arrangements to notify, only arrangements found in both lists need to be sent.
4.6.3 Discussion
Centralization of information is achieved by routing all communication flows through the main controller. An arrangement or an option can be easily added, removed, or deactivated as the only list of active items resides in the main con-troller.
As a result, efficiency is achieved by eliminating the synchronization process and minimizing the amount of communication. Updates in the data set are immediately acknowledged in the master copy retained by the main controller. The main con-troller then broadcasts the changes to components on the active items list. By doing so, information remains consistent throughout all active arrangements, and only the relevant information is distributed to a limited number of components, namely the I/O unit and all active arrangements.
An extra step to filter out the directly affected arrangements can be added when the main controller selects arrangements for change announcements. However, potential inconsistency is introduced as some active arrangements will not be aware of the changes in information.
Chapter 5
Back End
The HAPPIE system is divided into an invisible data processing back end and a visible display front end. The intelligence lies within the back end, which reads in data files, such as weblogs, news reports, and brainstorming section records, extracts useful information, and modularizes them into information objects and connections. The back end can suggest appropriate visualization selections for the particular input, based on the program’s understanding of the data structure and content. The front end displays all processed information objects and connections in the selected visualizations, detailed in the next two chapters.
5.1 Input
Input to the back end includes, but is not limited to, standard format XML files and standard format transactions. Inputs of other formats are first translated into the standard formats, detailed in Section 4.4.1, before being processed by the back end.
5.1.1 File
Input data files are collections of data bit descriptions. Inside individual descrip-tions, detailed values for all data fields are provided. A number of data fields are marked as “required”, in order to obtain basic information essential for display, such as ID, time, and title. They are identical to basic attributes for information objects, described in Section 5.2.1. In addition, there are optional data fields, providing val-ues to other possibly useful data fields, such as notes, credibility, and website links. When value for a field can not be found, the data processor will fill in a default value or make up a value for fields that requires distinct values, such as ID.
Standard input files are in XML file format, as illustrated in Figure 5-1. <Group> <ID>493872</ID> <Entries> <Entry1> <IP>169.56.1.106</IP> <Time>03:42:27</Time> </Entry1> <Entry2>details</Entry2> <Entry3>details</Entry3> <Entries> </Group>
...
...
...
...
Figure 5-1: A sample standard format XML file input.
Inside the start and end XML tags of the data bit (in this example, a group), all required and optional field attributes are wrapped by XML tags composed of the field name. Super attribute, such as an entry, embodies multiple sub-attributes or is comprised of multiple values. Descriptions for the sub-attributes are contained in
the super attribute’s start and end tags. Inside the tags, each sub-value description is wrapped by an unique XML tag prevent the file reader from overwriting values with identical tags. Non-standard format input files are translated into the standard format, as described in Section 4.4.1.
5.1.2 Transaction
Transactions, detailed in [11] and [9], increase the efficiency in communication between components by carrying minimal information: the transaction type, ID, time stamp, and arguments. Similar to a message subject line, transaction type describes the purpose of the message, such as deletion, addition, or update requests. The unique ID provides a systematic way of distinguishing transactions even if they have identical values for other fields. The time stamp enables prioritization and archive of transactions. Finally, the arguments contain the content of the message.
Similar to standard input files, standard input transactions are also in XML for-mat, as illustrated in Figure 5-2. An start and end XML tag pair, containing the version number of the transaction, envelops the entire transaction. Each of the four parts are wrapped individually by a start and end tag pair. Inside the tag pair for ID, user information, host IP, and other identifier values are further defined by another layer of XML tag pairs. The message body has an identical structure.
<Transaction_ version="0.1"> <Transaction_TransactionType>4</Transaction_TransactionType> <Transaction_ID> <Identifier_ version="0.1"> <Identifier_Name>ben</Identifier_Name> <Identifier_Hostname>maklaptop</Identifier_Hostname> <Identifier_HostIp>192.168.0.4</Identifier_HostIp> </Identifier_> </Transaction_ID> <Transaction_Timestamp>1083677226783</Transaction_Timestamp> <Transaction_Args> <SetTextTrans_Args version="0.1"> <SetTextTrans_ID>1083677203179</SetTextTrans_ID> <SetTextTrans_Text>test</SetTextTrans_Text> </SetTextTrans_Args> </Transaction_Args> </Transaction_>
...
...
Figure 5-2: A sample standard format XML transaction input.
5.2 Output
Output from the back end consists of information objects and connections between the objects. The following are examples of such information objects and connec-tions: website readers and association from their common visits to the same pages, individual articles and similar news content, arguments or pieces of evidence and support for/opposition to relations between them.
5.2.1 Information Objects
Identification
Each information object carries two IDs, an original ID and a current ID. When information objects are created by the back end, a unique ID is assigned to each information object as both its original ID and current ID. When information objects are cloned, for distribution to individual front end arrangements, a different unique ID is created to overwrite the value of the current ID in each information object. This allows separate arrangements to manipulate their own copies of information objects, without affecting copies of the same object in other arrangements. While the current ID makes the cloned information objects independent, the original ID allows backtracking from those copies to the master copy in the main controller. In cases when users change information objects on screen, through the active front end arrangement, the change can be propagated back to the master copy and be updated in all other arrangements.
Basic Attributes
Including the original and current ID, each information object has seven basic at-tributes, time, title, image, weight, and type. The type attribute has three values in the current implementation - people, location, time - but could be easily expanded to include other categories. These seven attributes allow basic data analysis, includ-ing comparison, orderinclud-ing, and categorization, as well as visual display, includinclud-ing representation, organization, and augmentation. When values for these attributes
were not found in the input, default value can be substituted in or generated when an unique value is required.
Optional Attributes
Optional attributes are stored in an expandable hash table. The hash key is the unique name of the attribute, and the value retrieved from through the key is the value of the specific attribute.
5.2.2 Connections
Connections have three basic attributes, from-object, to-object, and weight. When a connection is undirected, the from and to objects are interchangeable. An optional attribute table is also designed to record additional information.
5.2.3 Transactions
Transactions outputted by the back end communicate updates, which are requested by users through the front end, to connected components such as the EWall Ex-change Module or the EWall Database Module. Transaction format and content are identical to the standard format input transactions, detailed in Section 5.1.2.
5.3 Data Processing
Extraction
The back end first parses the incoming data for useful information. For example, it will look for text strings in the form of XX:XX:XX for time information, text strings starting with “http://” for source information, and other predefined standard for-mats.
Compression
The back end scales the information based on the input’s magnitude and converts them into information objects. When the size of the input is small, each information bit can be made into an information object. When the input is too large for the display, the back end groups similar information bits together to a small number of information objects. Using dynamic programming, a longest common subsequence [5] detector can be built to look for text string similarities.
Extension
The back end is also capable of creating connections between information objects based on file content’s similarities. Similar to the compression mechanism, the back end can look for information objects with similar values for random properties. A threshold should be placed to prevent a near fully connected graph being created.
![Figure 1-1: A visualization by the Map.Net program [15] using symbols, and small, medium, and large objects to represent various levels of websites.](https://thumb-eu.123doks.com/thumbv2/123doknet/14747846.578853/22.892.136.464.412.667/figure-visualization-program-symbols-objects-represent-various-websites.webp)