Publisher’s version / Version de l'éditeur:
Journal of Solid State Chemistry, 87, 2, pp. 415-422, 1990
READ THESE TERMS AND CONDITIONS CAREFULLY BEFORE USING THIS WEBSITE. https://nrc-publications.canada.ca/eng/copyright
Vous avez des questions? Nous pouvons vous aider. Pour communiquer directement avec un auteur, consultez la
première page de la revue dans laquelle son article a été publié afin de trouver ses coordonnées. Si vous n’arrivez pas à les repérer, communiquez avec nous à PublicationsArchive-ArchivesPublications@nrc-cnrc.gc.ca.
Questions? Contact the NRC Publications Archive team at
PublicationsArchive-ArchivesPublications@nrc-cnrc.gc.ca. If you wish to email the authors directly, please see the first page of the publication for their contact information.
NRC Publications Archive
Archives des publications du CNRC
This publication could be one of several versions: author’s original, accepted manuscript or the publisher’s version. / La version de cette publication peut être l’une des suivantes : la version prépublication de l’auteur, la version acceptée du manuscrit ou la version de l’éditeur.
Access and use of this website and the material on it are subject to the Terms and Conditions set forth at
The thermodynamics of the system Zr(Fe0.75Cr0.25)2 + H2 using heat
conduction calorimetry
Grant, D. M.; Murray, J. J.; Post, M. L.
https://publications-cnrc.canada.ca/fra/droits
L’accès à ce site Web et l’utilisation de son contenu sont assujettis aux conditions présentées dans le site LISEZ CES CONDITIONS ATTENTIVEMENT AVANT D’UTILISER CE SITE WEB.
NRC Publications Record / Notice d'Archives des publications de CNRC: https://nrc-publications.canada.ca/eng/view/object/?id=09090ebd-aaf8-4a34-8967-d6af526a0bce https://publications-cnrc.canada.ca/fra/voir/objet/?id=09090ebd-aaf8-4a34-8967-d6af526a0bce
JOURNAL OF SOLID STATE CHEMISTRY 87,415-422 (19%)
The Thermodynamics of the System Zr(Fe0.75Cr,,25)2 + H, Using Heat Conduction Calorimetry
D. M. GRANT,’ J. J. MURRAY,2 AND M. L. POST
Division of Chemistry, The National Research Council of Canada, Ottawa, Ontario KlA OR6, Canada
Received January 11, 1990; in revised form April 23, 1990
The system Zr(Feo,,5Cr0,,5)2 + Hz has been reported to exhibit one compound hydride phase Zr(Fe0,,5Cr0,25)2H, with x 2 1.8. The present in situ free energy/enthalpy measurements indicate a more complex situation involving two compound hydrides, one having the approximate composition 1.8 5 x 5 2.0, and the other, x s 2.3. The steady state pressure-composition and calorimetric evidence for this is presented and discussed.
Introduction
Both ZrFe, and ZrCr, are Laves phases which form hydrides of the composition ZrM,H2. The ZrCr2 hydride is extremely stable compared with the ZrFe, hydride. The ternary system, Zr(Fe, -,,Cr,), , which exists for 0 < y < 1, exhibits intermediate H2 equilibrium pressures and as a result use of a ternary unhydrided phase of selected composition allows very specific tailoring of the hydride properties. Some of these ternary phases exhibit the rapid kinetics, appropriate H2 pressures at or near ambient temperature, and large hydrogen capacities, which are necessary for hydride applica- tions such as hydrogen storage, heat pump- ing, etc. Because of this, pressure-composi- tion-temperature (p-x-T, where x is the hydrogen content) studies of these com-
’ Present address: Oxford Research Unit, The Open University, Berkeley Road, Oxford OX1 5HR, United Kingdom.
r To whom correspondence should be addressed.
pounds have been made with a view to char- acterization for such applications. (Z-3)
In this laboratory we have studied the de- tailed thermodynamics and crystallographic structures of selected compound hydride phases such as LaN&H, (4-6), CaNi,H, (7-ZO), and Mg,NiH, (II, 12) using in situ heat conduction calorimetry and in situ X-ray and neutron powder diffractometry. A calorimetric study of a Zr(Fe,-,Cr,), + H, system (y = 0.25) is reported here as representative of A&-type compound hy- drides. Limited X-ray diffraction measure- ments for this system with y = 0.25, and some calorimetric studies fory = 0.45, were also made. These latter systems also have been reported to have at least two unusual characteristics: a very highly sloped “pla- teau” region (13) and an apparent solubility range of the compound hydride (j3 phase) which is exceptionally wide. Zr(Fe,,,5Cro,2,)2
+ HZ, the system studied most extensively in this work, has been reported to have an absorption plateau pressure at 298 K of ap- proximately 13 3 atm (I) and a single com-
416 GRANT, MURRAY, AND POST
pound hydride which exists over approxi- mately 2 < x < 2.85 in Zr(FeO,&r,,,,),H, for pressures of <20 atm.
Experimental
Samples were prepared by arc melting 3 to 6 g of a mixture of the elements using a high purity evacuable arc melter and dry box handling procedures. Cr as pellets, and Fe and Zr as foils, were used as received from Alpha Chemicals and had a stated pu- rity of 99.9% or better total, 99.95% or better metallic. The mixture was prepared with a 2% excess of Cr compared to the desired final stoichiometry, since Cr is substantially more volatile than the other elements at the estimated melting temperature. In addition, in order to minimize vaporization, the pel- lets of Cr were wrapped in strips of the Fe and then of the Zr foil for the first arcing. The evacuable arc melter was pumped to <lo-* atm prior to backfilling with 0.25 atm argon. After the initial melt, the boule was inverted and melted a second time. Selected samples were annealed at 1200 K for periods of lo-12 days in welded stainless steel con- tainers backfilled with 0.25 atm argon. The argon used here and during arc-melting op- erations was purified to <I ppma 0, by get- tering over titanium at 900 K immediately before use. Samples were characterized for phases present using X-ray powder diffrac- tion, for impurities by dc arc emission spec- troscopy, and for stoichiometry via induc- tively coupled plasma atomic emission analysis.
Simultaneous pressure-composition (p-x) and enthalpy measurements were made by titrating H, gas in and out of the powdered hydride via an all welded, vac- uum tight, stainless steel manifold held at 301 .O K. The’samples were activated in situ by thorough evacuation followed by 3 hy- dridejdehydride cycles to =35 atm. The hy- dride was located in the measurement zone of a twin cell heat conduction calorimeter
held at 273.00 K. Details of the equipment and procedures have been described earlier, (4, 5, and 10). Pressures are measured to 50.1% and the errors in the measured en- thalpies range from kO.1 to +0.3 k.l (mol H,)-’ as SplGx varies from its minimum to its maximum. As in previous reports, en- thalpies are given per mole of H, for conve- nience even though the hydrogen is com- bined atomically in such hydrides.
Results and Discussion
The atomic emission analysis confirmed that the stoichiometry of the phases ob- tained corresponded to the composition of the starting mixture, except for the Cr loss indicated by the weight loss described be- low. However, with an estimated error level of -L3%, this technique is not sufficiently accurate to be definitive. The final sample weight after arc melting was always slightly less than the initial total weight of the ele- ments, usually by an amount just smaller than the 2% excess of Cr used in the initial mixture. The dc emission spectroscopy showed the maximum total metallic impuri- ties to be 0.2 at.%, with Sn as the major impurity at 0.1 at.%.
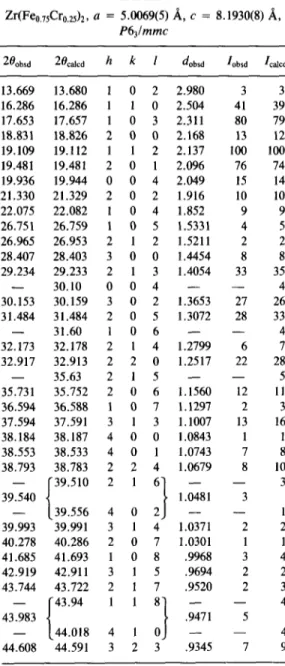
A total of four preparations of Zr(Fe,,,,Cr,,,,), were made, all of which gave powder X-ray diffraction patterns which were sharp (MO& radiation, De- bye-Scherrer mount, FWHM = 0.11, cf. FWHM = 0.10 for well-crystallized Si) which is characteristic of well-crystallized, homogeneous materials. For a representa- tive sample, the diffraction pattern was in- dexed on an hexagonal cell, with lattice pa- rameters a = 5.0069(5) and c = 8.1930(8) A. The peak intensities (determined using the peak profile analysis procedures of Sparks (14)) showed an excellent fit to inten- sities calculated for the MgZn, Laves phase structure (15) which is in the space group P6,lmmc with Zr on the Mg sites and Fe and Cr randomly distributed on the Zn sites
TABLE I Taken together, these results indicate that Zr(FeO.&r,&, a = 5.0069(5) A, c = 8.1930(8) A, the samples obtained after arc melting, one P6,lmmc of which was used for the calorimetric mea-
Zhbsd %alcd h k 1 dobsd Iobsd I&d surements, were well-crystallized, homoge-
neous, single phase samples with the stoi-
13.669 13.680 1 0 2 2.980 3 3 chiometry Zr(FeO,,,Cr,,,,),, and a metallic
16.286 16.286 1 1 0 2.504 41 39 purity of 99.8 at.%. The traces of ZrN which
17.653 17.657 1 0 3 2.311 80 79
18.831 18.826 2 0 0 2.168 13 12 were present should be inactive to hydrogen 19.109 19.112 1 1 2 2.137 100 100 and as a result would only cause minor er- 19.481 19.481 2 0 1 2.096 76 74 rors in the reported hydride compositions. 19.936 19.944 0 0 4 2.049 15 14 Figure 1 illustrates thep-x diagram for the 21.330 21.329 2 0 2 1.916 10 10 Zr(Fe,,,,Cr,,,,), + H, reaction which was
22.075 22.082 1 0 4 1.852 9 9
26.751 26.759 1 0 5 1.5331 4 5 obtained during one of the simultaneousp-x 26.965 26.953 2 1 2 1.5211 2 2 and enthalpy measurement sequences with 28.407 28.403 3 0 0 1.4454 8 8 the sample at 273 K. The data for this hy- 29.234 29.233 2 1 3 1.4054 33 35 drideldehydride sequence were obtained - 30.10 004 - - 4 over a period of 21 days with steady state 30.153 30.159 3 0 2 1.3653 27 26
31.484 31.484 2 0 5 1.3072 28 33 conditions obtained in both 6plSt and 6q/St 31.60 106 - 4 after each gas aliquot, where q is the mea-
- -
32.173 32.178 2 1 4 1.2799 6 7 sured heat. The long term nature of these 32.917 32.913 2 2 0 1.2517 22 28 experiments necessitates a very precise at- - 35.63 215 - - 5 tention to the attainment of a gas-tight gas 35.731 35.752 2 0 6 1.1560 12 11
36.594 36.588 1 0 7 1.1297 2 3 titration enclosure, and to titration proce- 37.594 37.591 3 1 3 1.1007 13 16 dures under well-controlled temperatures, 38.184 38.187 4 0 0 1.0843 1 1 all of which ensure accurate maintenance 38.553 38.533 4 0 1 1.0743 7 8 38.793 38.783 2 2 4 1.0679 8 10 - 39.540 - i 39.510 216 - I - 3 1.0481 3 T 0 FN 39.556 4 0 2 - - 1 39.993 39.991 3 1 4 1.0371 2 2 40.278 40.286 2 0 7 1.0301 1 1 41.685 41.693 1 0 8 .9968 3 4 42.919 42.911 3 1 5 .9694 2 2 43.744 43.722 2 1 7 .9520 2 3 - { 43.94 - 4 43.983 5 - 44.018 - 4 44.608 44.591 3 2 3 .9345 7 9 1 ++
Note. Guinier diffractometer, graphite monochro- ++ **++t+++
matized MO& (A = 0.70930 A) radiation, 0.3-mm cap- ++*
illary, rotating, 24°C.
THERMODYNAMICS OF Zn(Fe, 7sCr0.2s)z + Hz 417
in the ratio 3/l. This data is given in Table I. Some samples had 2 or 3 very weak (<3%
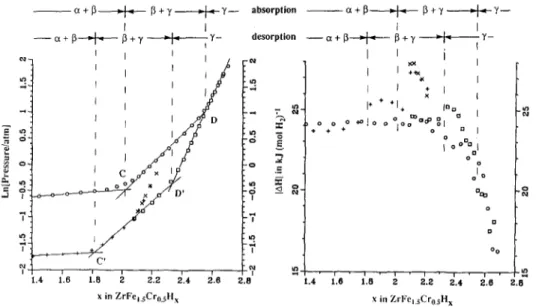
Z/Z’) diffraction lines which did not fit the FIG. 1. Pressure-Composition plot for MgZn, Laves phase structure. These were Zr(FeO,,SCrO,ZS)ZHx of each gas aliquot. 0, absorption; 0, initial desorp- at 273 K. x is the final composition
418 GRANT, MURRAY, AND POST
-3
-P
x in ZrFe,,,Cr,,H,
FIG. 2. JAHJ vs x for Zr(Fe,,,,Cr0,~5,),Hx at 273 K. x is the average composition during each gas aliquot. Corresponding p-x data given in Fig. 1.0, absorption; Cl, initial desorption; x , reabsorption; + , continuation of desorption.
and monitoring of the gas inventory and pu- rity. A necessary, and in a practical sense, sufficient, indicator that such integrity has been achieved is that compositional closure is obtained at the conclusion of the measure- ment sequence. It is clear from Fig. 1 that such a closure was obtained in these mea- surements .
This steady state p-x diagram, and its ac- companying AH vs x diagram, are the best thermodynamically interpretable data avail- able, given that true equilibrium diagrams are not attainable for this type of gas-solid system, since they generally exhibit signifi- cant hysteresis. A detailed interpretation of most published p-x diagrams could be mis- leading, since, being obtained in much briefer, l- to 3-day, experiments, they may contain anomalous features of kinetic rather than thermodynamic origins. Features ap- parent in Figs. 1 and 2, on the other hand, are true steady state features. Some of these features are particularly remarkable when compared to aspects of other compound hy- dride systems for which steady state p-x diagrams are also available.
The hysteresis in the region of lowest slope of p vs x (0.15 < x < 2.0, see Fig. l),which is taken to be a two-phase coexis- tence region, is large,
ln(Pabsbdes) = 3.45,
where Pabs and Pdes are the median absorp- tion and desorption pressures, respectively. This compares to a value of 0.73 for LaNi,H, (5). As well, this “plateau” is markedly sloped, with
ln(paz/pa,) = 0.90 and ln(pdz/pdl) = 1.00, where paI, pa2 and pdr , pd2 are the absorption and desorption pressures at the lower (1) and upper (2) bounds of this region (see Fig. 1). For LaNi,H, these values are 0.02. Such characteristics were reported earlier by Ivey and Northwood (I).
A notable feature is the persistence of the pressure hysteresis well beyond the obvious marked change in slope in the p-x curve (at x = 2.0 in absorption), which is normally taken to be a boundary between a two-phase coexistence region and a single- phase region. In this region where x > 2.0 (in absorption), p-x reversibility only occurs for x > 2.5. Such a persistence of the pressure hysteresis has not been observed in the true steady state p-x dia- grams available for other hydride systems such as LaNi, + H, (5, 16) and CaNi,
+ H2 (7, 10). Most theories of the p-x hysteresis phenomenon (17, 18) are based upon behavior of a two-phase mixture and hysteresis within a single phase hydrogen solution is not predicted. This observation alone is suggestive that the composition range 2.0 < x < 2.5 (in absorption) is also a two-phase coexistence region.
A second notable feature is the clear point of inflection (at x = 1.0) within the region of lowest slope in both absorption and desorption. Indeed, the notably high slope of the In p vs x plot for this two phase region is largely a feature of the portion from x = 0.15 to x -L 1.0. Above
THERMODYNAMICS OF Zn(FeO,,&,,,), + H,
~ a + p+ B + y +y- absorption -a+P--+- P+Y4Y-
I I I I
--a+P-+-P+u -+---yy- desorption --a+P-.+-- p+y+Y-
I I
^. I
419
1.4 1.6 1.6 2 2.2 2.4 2.6 2.8 x in %rFe,,&ro,5tl, x in Zrl’c, $ro jH,
FIG. 3. Detail of p-x and IAHl plots for x > 1.4 in Zr(Fe0.75Cr0,25)2Hx, showing the inferred phase regions. 0, absorption; Cl, initial desorption; x , reabsorption; + , continuation of desorption.
x = 1 .O, the slope is similar to that typically seen for the hydriding of binary intermetal- lies. Finally of note is that within the higher slope portion, 0.15 < x < 1.0, the slope of In p vs x in desorption is substantially greater than in absorption.
Figure 2 illustrates the enthalpy data ob- tained simultaneously with the p-x results in Fig. 1. Figure 3 shows the details for the region of greatest interest, x > 1.5, in which the p-x features described above occur. A second complete absorption/desorption se- quence was done for this material which actually preceded the scan reported in Figs. l-3. The results for this preceding scan are completely consistent with the results re- ported here. Another preliminary scan using a composition Zr(Fe,,,,Cr,~,,), showed simi- lar features.
The Region x > DD’
This is the region with x > D in absorption and x > D’ in desorption. From the p-x portion of Fig. 3, in addition to the inflection points C and C’ at x = 2.05 and x = 1.8,
which were taken by previous workers to be the lower boundaries of a single phase region, there is another pair of inflection points D and D’, at x = 2.57 and x = 2.30, within this apparent solution region. For compositions greater than D and D’, this system exhibits the fully reversible behavior in both p-x and IA&x characteristic of a simple solution process. As has been ob- served for many other compound hydrides the value of [AHI, the relative partial molar enthalpy of solution decreases rapidly within this region with the increasing hydro- gen content, reaching a value of 16 kJ (mol H,)) ’ at the upper bound for these measure- ments, x = 2.69, p = 6.62 atm. During the desorption in the first measurement series, a reabsorption/desorption sequence (RADS) was done beginning at x = 2.46, for a Ax = 0.15. Both the p-x and IA&x results showed complete reversibility. Based upon these results one can conclude unequivo- cally that the region above DD’ is a simple hydrogen solution into a compound hydride designated here as the y phase.
420 GRANT, MURRAY, AND POST
The Region CC’ < x < DD’
Even though the p-x diagram exhibits a steep slope in this region, many characteris- tics typical of a two-phase coexistence re- gion are present. They are
-1np vs x, in both absorption and desorp- tion, exhibits distinct slope changes at both boundary compositions.
-The region exhibits a substantial p-x hysteresis.
-A RADS over Ax = 0.15, starting from the desorption portion of the main scan in the region D’C’, shows clear interplateau behavior (19) in both the p-x and IA&x data.
The clearly present hysteresis, an attribute associated with two-phase coexistence (17, I8), and the corroborating observation of interplateau behavior (19) are convincing evidence that this is a two-phase coexis- tence region.
As shown by Bowerman etal. (19), during the initial portion of an inter-plateau se- quence which starts from the desorption pla- teau, added hydrogen dissolves in both phases without any interphase conversion occurring. This simultaneous solution pro- cess, without phase conversion, generally continues until roughly 80% of the transition to the absorption plateau has occurred. Dur- ing this stage the process is completely re- versible. As shown in Fig. 3, the first reab- sorption point gives a IAHI of 27.8 kJ (mol Hz)-‘, 3 kJ (mol HZ)-t higher than for the immediately preceding desorption point. Subsequent hydrogen additions (x’s) lead to rapidly diminishing [AHI values with x. The following desorption (t ‘s) yielded com- plete reversibility in both p-x and IAHI-x with sharp discontinuities in both when the desorption “plateau” was reattained.
The two-phase coexistence shown by this data corresponds to a steady state condi- tion, and, in desorption, is between forms of the y phase and some other phase. Be- cause of the rapidly dropping pressures of
this two-phase region “plateau,” the y phase will have a lower hydrogen content than at the phase boundary D’. Thus, the observed values of IAH\ during the RADS are higher than any observed for they phase in the x > DD’ region, because of this re- duced hydrogen content of the y phase and the observed rapid decrease in IAH] with increasing x for the y phase. These observed values of 1 AH\ do not fall along an extrapola- tion of the values of (AH\ observed for x > DD’ because during RADS there is a coex- isting phase which is also dissolving or re- leasing hydrogen. The identification of this other phase is problematical.
The pronounced p-x slope changes at C and C’ indicate a phase boundary at these compositions in absorption and desorption, respectively. The IA+x results in absorp- tion are featureless at the composition D whereas the enthalpy results in desorption show small but clear peaks over several hy- drogen aliquots in IAHI associated with both D’ and C’. Such discontinuities are consis- tent with two-phase/single-phase bound- aries at these points. The failure to observe these enthalpy discontinuities in absorption is probably due to smearing of the enthalpies associated with these boundaries caused by irreversible formation of the single phases during the briefly elevated pressure periods needed in the hydrogen titration. Such smearing has been observed before (5, 10, 16). Finally, if one assumes that this region is a two-phase conversion between phase y and a phase p with a hydrogen solution along the CC’ line with a IAH/ of solution of -25.8 kJ (mol Hz)-‘, the p-x and [AH\-x effects observed in the RADS are predicted.
The evidence presented above is consis- tent with there being two compound hy- drides, p and y, in this system at 273 K with values of x of 1.8-2.05 and >2.33, respec- tively. The small compositional difference between these phases could yield the high slope in the p-x data in their coexistence region. Confirmation of this interpretation
THERMODYNAMICS OF Zn(Feo,&r,,& + H, 421 by in situ X-ray diffraction (or other appro-
priate technique such as neutron diffraction) is necessary.
Using the in situ apparatus and techniques which we have described earlier (9,20), two series of hydrogen absorption/desorptions were attempted at room temperature for Zr(Fe,,,&,~,,),. In both cases the initial hy- drogen addition to pressures which should have given a composition well within the y phase gave X-ray diffraction patterns show- ing two coexisting phases with the same lat- tice type as the unhydrided phase. The ma- jor component had lattice parameters much greater than the unhydrided phase and the minor component (~10%) had parameters approximately equal to those of the unhy- drided phase. This agrees with the previous results of Ivey and Northwood (I). How- ever, in both attempts, the subsequent pump out did not lead to reversal of the reaction. Indeed, the reaction system appeared to be completely poisoned. This lack of revers- ibility makes these results inconclusive and uninterpretable in terms of confirming or de- nying the phase relations indicated by the calorimetric study, since the extent of hy- drogen absorption corresponding to the dif- fraction results is unknown.
Since no such irreversibility was experi- enced in the all-welded, bellows-valved stainless steel apparatus used for the calo- rimetry, very thorough degassing proce- dures of the glass capillary portion of the X-ray apparatus were employed for the sec- ond in situ attempt. No improvement in the poisoning was observed. The sensitivity of this system to poisoning was also reported by Ivey and Northwood (I). Neutron dif- fraction probably could resolve this problem since in situ studies can be made using an all metal apparatus which can be readily de- gassed.
The Region A < x < CC’
In this region IAH/ decreases smoothly and reversibly from about 25.2 kJ (mol Hz)- ’
at the lower composition boundary, x i= 0.2, to about 23.8 kJ (mol Hz)-’ at the upper boundary, x = 1.9. This region, ideally, should exhibit a reversible, constant en- thalpy of conversion, IAH,I, since it is a two- phase conversion between the cz phase and a compound hydride. However, in a “pla- teau” region exhibiting significant slope of In(p) vs x, each hydrogen aliquot causes, in addition to conversion between the two phases, a change in the hydrogen content of the phases. As a result, instead of a constant (AHI, one will observe a (AHI which varies across the “plateau,” depending upon the relative proportions of the two solution pro- cesses which occurs and the values of IA&I of these processes. In this system the appar- ent (Y solution region (x < 0.1) is very narrow causing 6p/6x to be very large. Conse- quently, very little a! solution will occur as the pressure rises during the two-phase con- version. Therefore the decrease in IAHcl across the two-phase conversion would be largely due to increased solution of hydro- gen in the compound hydride and is consis- tent with the partial enthalpy of solution, (AH,(, decreasing rapidly with increasing hydrogen content. Indeed the measure- ments for x > ~1.8 showed that the com- pound phase y and the proposed phase p both exhibit substantial hydrogen solubility, i.e., a relatively low (SplGx). Furthermore the y phase does exhibit a very rapidly de- creasing IAH, with increasingx; insufficient direct data is available to determine 6(IAH,1)/6x for the proposed p phase.
The present results show that, in addition to the large hysteresis and high slope of the p-x data for this region, reported by others,
there are also clear changes in the p-x char- acteristics at B, x = 1 (Fig. 1). As described earlier, these results were obtained over 21 days and, therefore, correspond to steady state conditions for each gas aliquot. Since the slope of In(p) vs x, in both absorption and desorption, is much higher for x < 1 than for x > 1 (see Fig. 2), it is clear that
422 GRANT, MURRAY, AND POST
the phenomenon causing the highly sloped plateau is not occurring uniformly across this region.
In contrast, the IAH,\ vs x data for this region shows excellent reversibility throughout without any measureable fea- ture associated with the composition x = 1 .O. This observation makes it unlikely that the change in slope of In(p) vs x is caused by an event correlatable to the equilibrium state of this system, i.e., to the existence of
a phase at x = I. The substantial pressure
change across this two-phase region and this clear change in 6p/6x at x = 1 both imply inhomogeneity. However, as described ear- lier, the samples of Zr(Fe,,&r,,,,), exhibit X-ray diffraction patterns which index as a single phase and have diffraction line widths characteristic of a homogeneous well-crys- tallized material. Furthermore. even after hydriding, these materials show very little line broadening. Given that Fe and Cr have very similar X-ray scatter coefficients and similar atomic/ionic radii, it is possible that inhomogeneity in their occupancy of the Zn sites in the MgZn, structure would not be detectable by X-ray diffraction. Put more generally, attaining full homogeneity for many transition metal ternaries may be very difficult to achieve, even with annealing near 1200 K, and any resulting inhomogenei- ties may be difficult to detect.Alternatively, the sample may be fully homogeneous and, as discussed by Oates and Flanagan (21), such a sloped “plateau” is due to other causes associated with local equilibrium. The CY Solution Region, x < A
ary is much less than the IAH, for the A/ CC’ region. This is expected behavior and has been observed in other systems, e.g., LaNi,H, (5, 16) and CaNi,H, (7).
References
I. D. G. IVEY AND D. D. NORTHWOOD, “Hydrogen Energy Progress,” Vol. V, p. 1395, Pergamon Press (1984).
2. D. SHALTIEL, J. Less-Common Met. 73, 329 (1980).
3. D. SHALTIEL, J. Less-Common Met. 62, 401 (1978).
4. J. J. MURRAY, M. L. POST, AND J. B. TAYLOR, J. Less-Common Met. 80, 201 (1981).
5. J. J. MURRAY, M. L. POST, AND J. B. TAYLOR, J. Less-Common Met. 80, 211 (1981).
6. M. L. POST, J. J. MURRAY, AND D. M. GRANT, Z. Phys. Chem. 163, 135(1989).
7. J. J. MURRAY, M. L. POST, AND J. B. TAYLOR, J. Less-Common Met. 90, 65 (1983).
8. L. D. CALVERT, B. M. POWELL, J. J. MURRAY, ANDY. LEPAGE, J. Solid State Chem. 60,62 (1985). 9. J. J. MURRAY, D. M. GRANT, E. AKIBA, AND M.
L. POST, Muter. Res. Bull. 21, 515 (1986). 10. D. M. GRANT, J. J. MURRAY, AND M. L. POST, J.
Chem. Thermodyn. 19, 1217 (1987).
11. M. L. POST AND J. J. MURRAY, J. Less-Common Met. 134, 15 (1987). Manuscript to be published. 12. M. L. POST, J. J. MURRAY, G. J. DESPAULT, AND
J. B. TAYLOR, Mater. Res. Bull. 20, 337 (1985). 13. D. G. IVEY AND D. D. NORTHWOOD, Ser. Metall.
19, 1319 (1985).
14. R. A. Sparks Program for Profile Fitting, Nicolet Corporation, Madison, WI.
15. Y. KOMURA AND K. TOKUNAGA, Acta Crystal- logr., Sect. B 36, 1548 (1980).
16. B. S. BOWERMAN, C. A. WULFF, AND T. B. FLAN- AGAN, Z. Phys. Chem. (Wiesbaden) 116, 197 (1979).
17. T. B. FLANAGAN AND J. D. CLEWLEY, J. Less- Common Met. 83, 127 (1982).
18. W. R. MCKINNON, J. Less-Common Met. 91, 293 (1983).
The desorption data indicate an upper 19. B. S. BOWERMAN, C. A. WULFF, C. E. BIEHL,
limit for this region of x = 0.08. There is AND T. B. FLANAGAN, J. Less-Common Met. 73,
insufficient data available to characterize 1 (1980).
the enthalpies in the (Y solution region. How- 20. 2. GAVRA AND J. J. MURRAY, Rev. Sci. Instrum.
ever, both the absorption and desorption
57, 1590 (1986).