Design of Aircraft Noise Abatement Approach
Procedures for Near-Term Implementation
By Nhut Tan Ho
M.S. Mechanical Engineering Massachusetts Institute of Technology, 1998
B.S. Mechanical Engineering University of Southern California, 1996
Submitted to the Department of Mechanical Engineering in Partial Fulfillment of the Requirements for the Degree of Doctor of Philosophy in Mechanical Engineering
at the
Massachusetts Institute of Technology February 2005
©2005 Massachusetts Institute of Technology. All rights reserved Signature of Author ……….
Department of Mechanical Engineering January 7, 2004 Certified by ………...
John-Paul Clarke, Associate Professor of Aeronautics and Astronautics Thesis Supervisor Certified by ………..
Derek Rowell, Professor of Mechanical Engineering Committee Chair Certified by ………..
Dr. Charles Oman, Senior Lecturer
Certified by ………..
Dr. James Kuchar, Technical Staff, MIT Lincoln Laboratory Accepted by ………..
Design of Aircraft Noise Abatement Approach
Procedures for Near-Term Implementation
By Nhut Tan Ho
Submitted to the Department of Mechanical Engineering in Partial Fulfillment of the Requirements for the Degree of Doctor of Philosophy in Mechanical Engineering
ABSTRACT
Advanced aircraft noise abatement approach procedures -- characterized by decelerating, continuous descent approaches using idle thrust, and enabled by flight guidance technologies such as GPS and FMS -- have been shown to reduce operational aircraft noise on communities surrounding airports. However, implementation in the near future presents two challenges. The first is to mitigate the adverse effects on aircraft performance of uncertainties in pilot response, weather, and other system components. The second is to enhance the ability of air traffic controllers to separate aircraft that are decelerating at different rates. The work in this thesis primarily addresses the first challenge by developing, first, a methodology to determine the optimum design parameters for a continuous descent approach, and, second, a new pilot cueing system. The methodology involved: 1) conducting a simulator-based, human factors experiment to obtain models of pilot delay in extending flaps/gear in conditions with and without turbulence; 2) formulating the procedure’s parameters as strategic and tactical control variables; 3) using the pilot delay models and the parameter formulation to perform a Monte Carlo Simulation to resolve the conflicting objectives of reducing noise and increasing probability of target achievement. Simulation results showed that the flap schedule has to be designed for a 50-ft- higher-than the target altitude without turbulence, and a 200-ft for turbulence; 4) determining the feasibility space of the parameters in different wind conditions. Results showed that when the wind uncertainty is large, accounting for the uncertainty in the procedure design significantly reduces the effectiveness of the procedure. A new pilot cueing system that does not require additional aircraft automation was developed to help pilots manage the deceleration of aircraft and achieve target conditions in a changing environment. The cueing system, consisting of gates (i.e., altitude/speed checkpoints) and a recommended flap schedule, was designed and evaluated in a second experiment using a desktop simulator which showed that gates reduce target error to within five knots and provide comparable performance to that of more automated systems without increasing pilot workload. Because the gates have the potential of enabling aircraft to fly consistent speed profiles, it is hypothesized that their implementation would address the second challenge by enhancing the controller’s ability to predict aircraft trajectories and their future separation.
Thesis Supervisor: John-Paul Clarke
Table of Contents
List of Figures... 7 List of Tables ... 10 Acronyms... 11 Acknowledgement ... 13 1. Introduction... 17 1.1. Motivation... 17 1.2. Implementation Challenges ... 201.3. Overview of the Thesis ... 21
2. ANAAPs Definition and Key Drivers for Procedure Design ... 24
2.1. Definition of Procedure Parameters... 24
2.2. Key drivers for procedure design... 26
2.2.1. Objectives of System Stakeholders... 26
2.2.2. Sources of System Uncertainty... 28
2.3. Guidelines for Designing an ANAAP for a Specific Airport and Aircraft... 30
2.3.1. Preliminary Design Using Energy Equation... 30
2.3.2. Procedure Design in a Research Project ... 32
3. Managing Uncertainty Through Strategic and Tactical Control... 34
3.1. Tactical and Strategic Control Formulation... 34
3.2. Strategic Control Design for Robustness to Pilot Uncertainty and Wind Prediction Error 38 3.2.1. Robustness to Pilot Uncertainty... 38
3.2.1.1. Modeling Pilot Response Time... 38
3.2.1.2. Performance Tradeoff: Noise Reduction and Target Achievement... 41
3.2.2. Design for Robustness to Uncertainty in Wind Prediction... 45
3.3. ATC Implementation of Strategic control ... 47
3.4. FMS Considerations for Tactical Control Implementation ... 50
3.4.1. FMS and Auto-throttle Logic... 50
3.4.2. Limitations of FMS VNAV and Auto-throttle... 52
3.4.2.1. VNAV Well-known Issues ... 52
3.4.3. Potential Solutions ... 60
4. Design and Evaluation of Gates as a Tactical Control Feedback Mechanism ... 63
4.1. Gates as a Feedback Mechanism ... 63
4.2. An Experiment for Design and Evaluation of Gates ... 67
4.2.1. Objectives and hypotheses... 67
4.2.2. Experiment Design... 69
4.2.2.1. Design of ANAAPs and gates... 69
4.2.2.2. Pilot Procedure with Gate Cueing Card... 73
4.2.2.3. Independent Variables ... 74
4.2.2.4. Measurements and Performance Metrics... 77
4.2.2.5. Simulator Facility... 78
4.2.2.6. Protocol... 79
4.2.2.7. Subjects... 80
4.2.3. Experiment Results ... 81
4.2.3.1. Performance in Terms of Achieving 150 Knots at CDAWP... 81
4.2.3.2. Noise Impact Performance... 87
4.2.3.3. Time Variation and Runway Capacity Analysis... 87
4.2.3.4. Design of Gates for Decision Making Enhancement... 89
4.2.3.5. Objective Assessment of Pilot Strategy in Using Gates ... 91
4.2.3.6. Subjective Assessment of Pilot Strategy in Using Gates... 94
4.2.3.7. Subjective Feedback on the Implementation of Gates... 96
4.2.4. Discussion and Conclusions ... 101
5. Issues on the Integration of ANAAPs into the ATC System... 105
5.1. Controller Limitation ... 105
5.2. Heterogeneity in System Components... 108
6. Thesis Contributions and Conclusions... 111
6.1. Development of Noise Abatement Approach Procedure Designs... 111
6.2. Development of a New Pilot Cueing System ... 113
6.3. Design Principle for Managing System Uncertainty ... 114
References... 116
A.1. Rules as a Mechanism Enabling Desirable System Behavior ... 120
A.2. A Generic Example: Random Walk ... 123
A.3. An Aviation Example: KEGE Procedure ... 126
A.3.1. Background... 126
A.3.2. Guidance and Navigation System Requirements... 127
A.3.3. RNAV Procedure ... 131
A.3.4. Pilot Technique-Guide Script ... 132
A.3.5. Discussion... 136
A.4. Application of rules for ANAAP ... 138
Appendix B. B737-300/B747-400 Simulator... 142
Appendix C. Experiment Data ... 144
C.1. ANOVA Results ... 144
C.1.1. Validation of ANOVA Assumptions ... 144
C.1.2. A Sample ANOVA Table ... 146
C.2. Questionnaires... 147 Appendix D. General System Considerations for Designing and Implementing an ANAAP 153
List of Figures
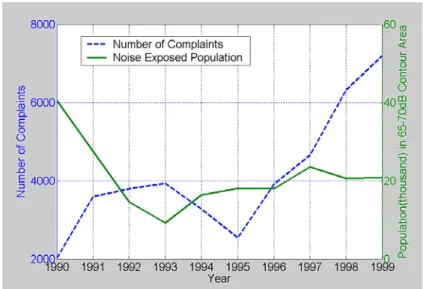
Figure 1: Number of Noise Complaints and Noise Exposed Population in 65-70dB Contour
Areas for Boston Logan International Airport. Source: MassPort Noise Office... 18
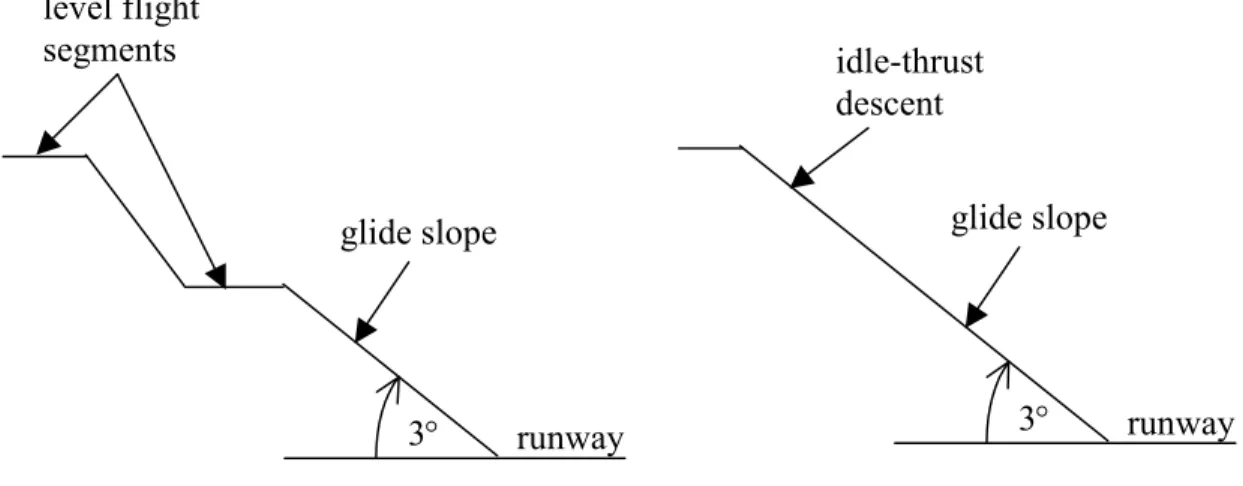
Figure 2: Standard ILS Approach Procedure (left), Advanced Noise Abatement Approach Procedure (right) ... 19
Figure 3: Procedure Definition ... 25
Figure 4: Pilots Control Loop During the Deceleration Segment of ANAAP ... 26
Figure 5: Envelope of HI and VTOD that Provides Feasible Flap Schedules... 36
Figure 6: Speed vs. Altitude Profiles for Different Flaps Schedules, Different VTOD’s, and Different HI’S... 36
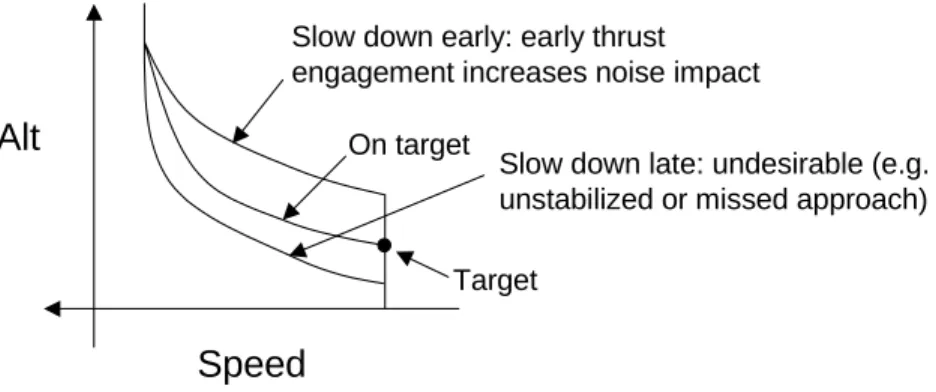
Figure 7: Speed Profiles for Late, On Target, and Early Pilot Response ... 38
Figure 8: Histogram and Fitted CDF (Cumulative Distribution Function) of Pilot Delay Time (PF Cues PM to Extend Flaps/Gear) ... 40
Figure 9: Histogram and Fitted CDF of Pilot Delay Time (PF Cues PM to Extend Flaps/Gear) in 25% Turbulence... 40
Figure 10: Histogram and Fitted CDF of Pilot Delay Time (PF Extends Flaps/Gear Himself ).. 40
Figure 11: Trade-off between the Probability Aircraft in Speed Window at 1000 ft and Noise Saving ... 44
Figure 12: Trade-off between the Probability Aircraft in Speed Window at 1000 ft and Noise Saving with Turbulent Pilot Response Model. ... 45
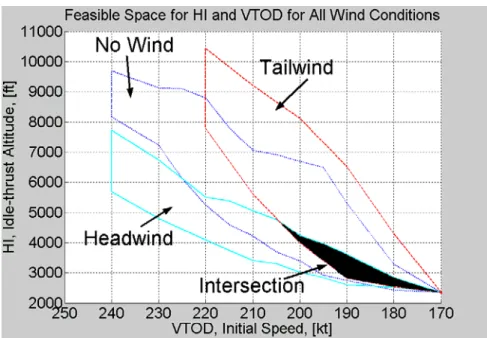
Figure 13:Speed Envelope for All Wind Conditions... 46
Figure 14: An Example of a Vertical Profile ... 51
Figure 15: VNAV Behaviors to Descend to the Final Approach Fix (adapted from Sherry, 2000). ... 54
Figure 16: Waypoint Locations for Flight Track... 55
Figure 17: Baseline Procedure Used in the Demonstration Test ... 55
Figure 18: CDA Altitude and Average Engine N1 vs. Distance to Runway Threshold... 56
Figure 19: CDA IAS and Average Engine N1 vs. Distance to Runway Threshold ... 57
Figure 20: CDA Average Engine N1 and Flap vs. Distance to Runway Threshold... 57
Figure 22: CDA Procedure for MD-80 Aircraft. [Reproduced With Permission of Alitalia
Airlines. Not to be used for navigation.]... 66
Figure 23: Crosschecking of Altitudes with DMEs in a Non-Precision Approach. ... 68
Figure 24: Waypoint Locations for Flight Track... 70
Figure 25: Altitude and Speed Profiles... 70
Figure 26: A Gate Cueing Card Prototype... 75
Figure 27: Simulator Setup. ... 79
Figure 28: Boxplot of the Speeds at the CDAWP. O and * symbols denote outliers... 82
Figure 29: Feedback Mechanism Effect on the CDAWP Speeds for Each Wind Condition. Mean of Speed Deviation with ± 1SE for Each Wind Condition. ... 82
Figure 30: Feedback Mechanism Effect on the CDAWP Speeds. Mean of Speed Deviation with ± 1SE for Each FM in All Combined Wind Conditions... 83
Figure 31: Feedback Mechanism Effect on the CDAWP Speeds. Mean of Speed Deviation with ± 1SE for Each Wind Condition with All FMs Combined... 83
Figure 32: Interaction Between Wind and Feedback Mechanism Treatments ... 86
Figure 33: Mean and 1 SE of 55-dB Noise Contour Area... 87
Figure 34: Flight Time Variation for No Wind Condition. ... 88
Figure 35: Runway Capacity for a B767 Following a B767. ... 88
Figure 36: Questionnaire on the Utility of Gates... 89
Figure 37: Number of Gates Pilots Prefer... 90
Figure 38: Comparison of the Usefulness of Last Gates and First Gates ... 90
Figure 39: Pilot Adaptation to Gate Speed Deviations: (a) No wind; (b) Headwind; (c) Tailwind. ... 93
Figure 40: Mean of Speed Deviation ± 1SE for Pilots with Goals and No Goals When No Flap Schedule and Gates were Provided... 95
Figure 41: Pilot and Controller Acceptance... 97
Figure 42: Acceptance of the Presentation of Gates... 99
Figure 43: Task’s Difficulty as Number of Gates Increased ... 100
Figure 44: Intrusiveness of Gates ... 101
Figure 45: Effect of Gates on Workload... 101
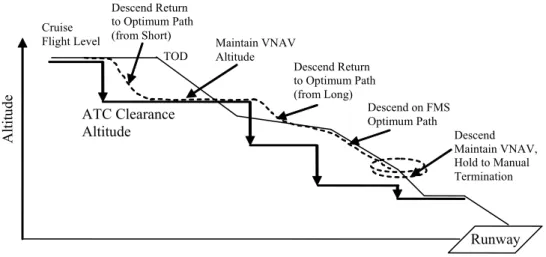
Figure 47: Typical Step-down Speed Profiles Under Existing Procedures ... 106
Figure 48: Separation Between Two Aircraft... 106
Figure 49: Example of Speed Profiles under ANAAP: Separation is Non-constant, Nonlinear With Time. ... 107
Figure 50: Vertical Profile of Existing CDA Implementing in Europe. ... 108
Figure 51: Abstraction of a Predefined Region Bounded By Rules ... 122
Figure 52: Rules Drive States Outside Predefined Region Back In. ... 122
Figure 53: Random Walk with Random Step Sizes and a Fixed Time Step Size ... 126
Figure 54: Aerial View of KEGE ... 127
Figure 55: KEGE Approach Chart [Reproduced with permission of American Airlines and Jeppesen Sanderson, Inc. Not to be used for navigation.] ... 129
Figure 56: Pilot Procedure [Reproduced With Permission of American Airlines and Jeppesen Sanderson, Inc. Not to be used for navigation.]... 130
Figure 57: Speed Profiles of ANAAPs with Random Order of Speed and Thrust Reduction. .. 138
Figure 58: A B737-300 Leading a B747-400 Performing ANAAP ... 139
Figure 59: PDF of Aircraft Separation with Random Order of Pitch and Thrust Reduction ... 140
Figure 60: PDF of Aircraft Separation with Fixed Order of Pitch and Thrust Reduction... 141
List of Tables
Table 1: Minimum Maneuvering and Maximum Placard Speeds ... 37
Table 2: Speed and Altitude Constraints ... 56
Table 3: Speed and Altitude Constraints ... 72
Table 4: Gates and Recommended Flap Schedule... 72
Table 5: Speed, Altitude, and Course Constraints ... 132
Table 6: Mauchly’s Test of Sphericity... 144
Acronyms
A/T Autopilot Auto-throttleACARS Aircraft Communication Addressing and Reporting System
AGL Above Ground Level
ALT Autopilot Altitude Hold Mode
ANAAP Advanced Noise Abatement Approach Procedure ANOVA Analysis of Variance
APP Approach mode
ATC Air Traffic Control CAS Calibrated Airspeed
CDA Continuous Descent Approach CDF Cumulative Distribution Function DA(H) Decision Altitude/Height
DME Distance Measurement Equipment FAA The Federal Aviation Administration FAF Final Approach Fix
FLCH Flight Level Change Mode
FM Feedback Mechanism
FMC Flight Management System FMS Flight Management System FMS Flight Mode Annunciator FPA Flight Path Angle
FS Flap schedule
FS-0G Flap Schedule Without Gates FS-2G Flap Schedule With Two Gates FS-3G Flap Schedule With Three Gates GPS Global Positioning System HDG Autopilot Heading Mode
HI the altitude at which the thrust is reduced to idle
HTOD the altitude where the aircraft intercepts the three-degree glide slope
ILS Instrument Landing System INS Inertial Navigation Systems
IV Independent Variable
K Configuration (flap and gear) schedule LNAV Lateral Navigation Mode
LOC Autopilot Localizer-capture Mode MFS Microsoft Flight Simulator
MMS Minimum Maneuvering Speed
MPS Maximum Placard Speed
MSL Mean Sea Level
NFS-0G No Flap Schedule and No Gates
NW No Wind
PDF Probability Distribution Function
PF Pilot Flying
PM Pilot Monitoring
RA Radio Altimeter
RNAV Area Navigation
SE Standard Error
SFC Stabilized and Fully Configured SI Autopilot Speed Intervention Mode SOP Standard Operating Procedure TOD Top of Descent
TW Tailwind
V/S Autopilot Vertical Speed Hold Mode
VF Target Speed
HF Target Altitude
VNAV Vertical Navigation Mode
VOR VHF Ominidirectional Range
VTOD Speed at TOD
Acknowledgement
When I first started this research, I was not sure about my interest in systems engineering in general, or in aircraft noise abatement research in particular, but I was very sure that John-Paul (JP) Clarke would be a fabulous advisor. Not only was I right about the latter, but I also developed a strong interest in noise abatement and systems engineering research, thanks to JP. I was benefited and inspired by his enthusiasm, kindness, caring, pursuit of excellence, and willingness to try out many, actually too many =), of my research ideas. I feel fortunate to have the opportunity to work with and learn from JP as one of his “academic” children =).
I am also fortunate to have Derek Rowell, Jim Kuchar, and Chuck Oman as thesis committee members. I’d like to thank Derek for serving as committee chair, ensuring that my research stay on a focused path, giving me the opportunity to be his TA, making himself available for research and academic advice, and making things easier with his great sense of humor. Jim has always been supportive of my research and has made sure that both the intellectual contribution and impact of my thesis are significant. Jim is also a great source of advice for anything else, especially where one should go to propose to his girlfriend =). Thanks to Chuck’s expertise and infectious enthusiasm, I’ve learned to develop an appreciation for doing human factors experiments, living up to the ideals and standards of trying to truly understand the underlying reasons for an experiment’s causes and effects and having fun doing it!
In addition, I want to thank the students and staff in the International Center for Air Transportation. Captain Alan Midkiff provided many seeds for research ideas, two of which eventually materialized into the RNAV procedure at Vail and the gates experiment. Alan read my thesis and always promptly answered my mindless questions about aircraft. Coexisting with Francis Carr in the tiny cubicle space was a great joy. I’d like to thank Francis for his unpretentious, down-to-earth friendship and for all his help. I am indebted to Liling Ren and Alex Lee, who were always very helpful with anything. Thanks also go to Alf Kohler and Robin Riedel, who survived me as their “Vietnamese slave driver” =). They were instrumental in developing the gates experiment and making sure the gates were compatible with pilot capabilities. The experiment would not have been possible without their efforts. My other savvy
ICAT lab mates also enriched my experience: Terran Malconian bailed me out many times with computer problems, Tony Abad and Yiannis Anagnostakis helped out with my presentations, and the rest of ICATers provided comradeship.
I’d also like to thank the wonderful staff in the Mechanical Engineering and Aeronautics and Astronautics Department, including Leslie Regan of the ME Graduate Office for her invaluable advice and encouragement; Jennie Leith, Program Coordinator of the FAA Center of Excellence, for her friendship and help; and Sally Chapman and Mark Prendergast, ICAT Administrative Assistants, for their generous donations to all my Walk-for-Hunger walks.
In addition, I’d like to acknowledge the support of the NASA and the FAA. I’d like to thank Len Tobias for his mentorship and friendship, and for his help with funding the experiment to obtain the pilot response models. It was a lot of fun working with Monicarol Nickelson, who spent countless hours answering my statistics questions. My research also benefited from collaboration and interaction with Kevin Elmer, Kwok-on Tong, and Joe Watt of the Boeing company; Dave Williams of NASA Langley; Everett Palmer and Todd Callentine of NASA Ames; and Jim Miller and Charlie Ross of the CVSRF lab at NASA Ames who trained me to be an air traffic controller and made sure that I wore a Hawaiian shirt to work everyday =). I also appreciate the friendship of Todd Farley, John Robinson, and Ty Hoang of NASA Ames.
I am also deeply indebted to the pilots who participated in my experiments and taught me a lot about the intricacies of flying. Domenico Santisi was extremely helpful in recruiting many Alitalia pilots, including Alberto De Pasquale, Sebastiano Scalia, Alfredo Radaelli, Captain Tenchini, Moshe Bumaguin, and Adriano Bonazzoli. I’d also like to thank Ed Schmidt, Alan Midkiff, Mike Ryder, Bob Hilb, Rich Maurer, John Barbas, Andy Eppler, Jamie Crowley, and Stuart Lau. I first learned the subtleties of FMS RNAV approaches in the B767 Systems and Automation IAP course taught at MIT by Boeing’s Brian Nield and Chuck Oman, assisted by Alan Midkiff and Domenico Santisi. The B767 simulator we used became one of the research platforms used in this research.
Outside of work, I’d like to thank my friends at MIT and in the Vietnamese Student Association, especially Big Baby (aka Dinh-Yen Tran) and Tiny (aka Huy Le). Their friendship enriched my graduate student life. My friends in the MIT Toastmasters Club were a great source of inspiration. I’d like to especially thank Joe Gifun for his mentorship and friendship.
I am also indebted to my fiancée, who was always ready to lend a caring ear, chat when I worked late into the night, and serve as a buffer for me to vent my frustrations. Her gentleness and easy-going spirit help me become a better person, and I am looking forward to a life of love with her. I am blessed to have a sister who has always been intimately involved with my educational pursuits. As long as I can remember, from the day she tutored me in math when I was a first grader to the day she helped me fill out graduate school applications, she has always been a steady and resourceful wellspring of any kind of support. I am also grateful to my brother-in-law for airfare tickets in my first few years at MIT.
The greatest gratitude must go to my mom, who is a tower of strength. She not only inculcated in me the ideal of approaching life with a cheerful, optimistic spirit, but also the virtues of patience and resiliency in facing life’s adversities.
In life we can be beneficiaries or victims of circumstances. I am definitely the former, and my sister and my mom are the latter. While the social and economic conditions in Vietnam did not permit my mom and sister to pursue their academic dreams, I believe that with their formidable aptitude and determination, they, too, could have gotten Ph.D.’s. I would like to dedicate this thesis to them.
1. Introduction
1.1.
Motivation
Community concerns about aircraft noise are currently constraining the growth of aviation. Because of the increasingly active legal opposition to airport expansion by residents in impacted communities, many runway expansion projects have either been delayed or abandoned. The net effect is that fewer than five additional runways have been built at the thirty busiest airports in the U.S. within the past ten years [Mead 2000], resulting in greater delays and congestion at major airports [NRC 2001]. Since airports are the nodes of the air transportation system, capacity limitations at the busiest nodes will limit the capacity of the entire system.
A number of measures have been adopted to address the issue of aircraft noise. These measures include: phasing out noisier aircraft [Bond 2001] and introducing aircraft with quieter engine technology [Brookfield et al. 2000]; enforcing nighttime curfews on the operation of all or only certain aircraft; insulating (or purchasing and then demolishing) homes that are severely impacted by aircraft noise [US DOT 1976]; and charging landing fees [BAA 2000]. While these measures have reduced the impact of aircraft noise, they have not reduced the opposition to airport expansion as evidenced by the increase in the number of noise complaints despite the fact that the noise-exposed population remained the same after 1992 (see Figure 1 for Boston Logan International Airport as an example). Given the relatively wide implementation of the measures described above and the potential capacity crisis in the national and international airspace system, there is a critical need for new solutions.
The advent of advanced guidance and navigation systems, in particular multi-sensor Area Navigation (RNAV) systems, including, recently, the Global Positioning System (GPS), offers the opportunity to change aircraft operating procedures in order to further reduce noise. The GPS provides accurate 3-dimensional-position information globally, and RNAV allows aircraft to navigate flexible routes or trajectories created by a series of arbitrary reference points (or waypoints). These capabilities, collectively, may be used to devise thrust management strategies
that redistribute noise during departure and arrival, and enable trajectories with noise mitigation as a consideration.
Figure 1: Number of Noise Complaints and Noise Exposed Population in 65-70dB Contour Areas for Boston Logan International Airport. Source: MassPort Noise Office.
As an example, commercial aircraft using the Instrument Landing System (ILS) -- the primary means for commercial aircraft to perform landing -- are required to intercept the glide slope (often three degrees) from below (see Figure 2), and consequently spend considerable time maneuvering at low altitudes. In addition, because high lift devices such as flaps must be used when operating at low speeds, and because the recent trend in airlines is to lower the landing gear early to ensure that final approach configuration is established, the increase in drag due to flap and gear extension requires the engine thrust to be high to maintain the speed. In combination, the maneuvering’s close proximity to the ground due to the ILS guidance requirement, the high thrust needed to overcome drag, and the induced airframe noise due to early flap extension at low speeds, produce significant noise impact on those communities along the approach path.
3° runway glide slope level flight segments 3° runway glide slope idle-thrust descent
Figure 2: Standard ILS Approach Procedure (left), Advanced Noise Abatement Approach Procedure (right)
With GPS and RNAV, however, virtual descent points can be created to reduce noise impact by allowing aircraft to intercept a virtual glide slope angle at high altitudes and descend along the three-degree approach flight path with thrust set to idle (See Figure 2). Furthermore, the inherent navigational precision provided by GPS and RNAV allows aircraft to closely follow the assigned flight tracks, eliminating dispersions in noise impact that result when aircraft stray from the assigned tracks. Approach procedures that leverage these advanced technologies to reduce noise are referred in this thesis as advanced noise abatement approach procedures (ANAAP). An example of an ANAAP features an aircraft intercepting the glide slope at 7000 feet and descending along the glide slope at idle thrust. The combination of flying at higher altitudes, lower thrust for longer than current standard approach procedures, and delaying flaps and gear extension significantly reduces the noise impact. The noise benefits of ANAAPs have been demonstrated in a number of simulator studies [Clarke 1997; Erkelens 1999; Elmer 2002; Warren et al. 2002] and in a recent field experiment [Clarke et al. 2004], where, both, a reduction of 3 to 6 dB in peak A-weighted noise levels was observed.
While it is equally important to reduce the noise impact of departing aircraft, the focus of this thesis is the development of approach procedures. The rationale for this focus is threefold. First, the development of high-bypass-ratio turbofan engines has significantly reduced engine noise, but the difference in the reduction due to engines is smaller on approach than on departure because, with the way aircraft are currently flown, the engine thrust during arrival is much lower
than during departure. Additionally, a large percentage of arrival noise is contributed by airframe noise, which is the aerodynamic noise (excluding engine noise) in the boundary layers surrounding the airplane’s body during forward flight.
Second, due to the construction and operation of the navigation guidance systems, the noise impact can be more significant during an approach than a departure. Arriving aircraft have been required to intercept the three-degree glide slope from below and follow the glide slope until touchdown. This requirement results in the aircraft maneuvering for a considerable amount of time at low altitudes (typically at 3000 or 4000 ft above ground level (AGL)), and consequently generating high noise impact. On the other hand, departing aircraft are not subjective to constraints as that of arriving aircraft and are allowed to climb with maximum takeoff thrust. In the past three decades, the improvements in engine performance have enabled departing aircraft to climb quickly, and thus, the energy of the noise attenuates significantly as a result of increasing in distance between the aircraft (the source) and the ground (the receiver).
Third, the technological opportunity for reducing noise during approach is greater than during departure. As demonstrated in [Clarke 1997], advanced guidance and navigation technology allow departing aircraft to adhere to flight tracks accurately and redistribute thrust during climb by selecting altitudes for thrust cutback, as well as the amount of thrust, to distribute noise in a predefined manner. These practices are being used in current operation in procedures such as ICAO Noise Abatement Departure Procedure [Brooks 2002]. In contrast, the progress of the implementation of ANAAPs has not kept pace because of limitations in air traffic control (ATC) capabilities and aircraft performance vulnerability to system uncertainty, as will be discussed in the next section.
1.2.
Implementation Challenges
To implement ANAAPs and fully achieve their benefits at airports with high traffic, it is necessary to overcome two significant challenges. One challenge is the mitigation of the effect of system uncertainty on performance. As an aircraft descends along the glide slope to the
runway at idle thrust, its trajectory is highly dependent on its own performance characteristics, the variability in different wind conditions, and on the variable of pilot response time. The variability in wind field and in pilot response can adversely affect the trajectory of the aircraft, leading to unpredictability in the aircraft’s speed profile, errors in the predicted time of arrival, and/or missed approaches (which result in a go-around and consequently more noise impact).
Another implementation challenge is the inability of air traffic controllers to manually separate aircraft that are decelerating at different rates. The existing strategy controllers use to separate aircraft by commanding aircraft to arrive at common speeds is not applicable to ANAAPs because different aircraft decelerate at different rates. To account for the variability, controllers increase aircraft separation. This practice lowers airport throughput and limits the operation of noise abatement approach procedures to low-traffic environments.
1.3.
Overview of the Thesis
The work in this thesis addresses these challenges through the development of noise abatement procedure designs and a pilot cueing system that not only mitigate the effects of system uncertainty on performance but can also be implemented in the near-term. To provide a baseline procedure on which the work is developed, a definition of ANAAPs design parameters and the sources of uncertainties are presented in the first part of Chapter 2. The general guidelines for designing and implementing an ANAAP are presented in the second part of Chapter 2.
In Chapter 3, the design and analysis of ANAAPs is discussed in the context of treating certain parameters as strategic and tactical control variables. With this treatment, sets of feasible flap schedules were first determined based on given values of the strategic control variables, and, then, were used to study the impact of delay in pilot response and wind uncertainty. The pilot delay models used in the study were obtained in a simulator-based, human factors experiment conducted at the NASA Ames CVSRF 747-400 Level-D full motion flight simulator. Then, a numeric Monte Carlo simulation was used to 1) resolve the tradeoff between the uncertainty in pilot response and target achievement; 2) achieve robustness to variability in the wind
conditions. A number of concepts for near-term implementation of strategic and tactical control parameters in the current ATC environment are discussed. Because the tactical control parameters implementation involves the use of the vertical navigation mode (VNAV) of the flight management system (FMS), the limitations of existing FMS VNAV logic along with the proposed solutions to overcome these limitations is reviewed. The review shows that the proposed solutions are highly automated and suggests a need for a simple, non-automated pilot cueing system that can be implemented in the near term.
In Chapter 4, a new pilot cueing system is developed. In the cueing system, gates (indicating the expected speed at a series altitude check points) are used to provide pilots information that they can use to adjust the nominal flap schedule, and thus maintain the desired speed profile. Because gates are pre-computed and presented in a paper card, the cueing system does not require additional automation tools, yet, as will be shown, it provides comparable performance in terms of helping pilots manage the deceleration of the aircraft and achieve the target. To gain insights into the development of the gate cueing system for near-term implementation, an experiment is conducted to examine: 1) how and where the gates should be placed; 2) the expected performance with different number of gates with different uncertainty in the wind condition; 3) the pilot’s acceptance of the method and strategy to use the gates. The results show that gates, along with a recommended flap schedule, are most useful when placed every 1000 ft along the descent; the absolute value of the speed target error decreases approximately two knots for every additional gate; using gates the subject pilots can achieve the target within a few knots in the presence of wind uncertainty; subject pilots comment that using gates would not increase workload, and that gates are similar to altitude-distance checkpoints in non-precision approach procedures, and to altitude-speed-distance checkpoints in existing continuous descent approach procedures, and, thus, would be easy to use. These results along with the pilots’ high acceptance of the gate method suggest that gates have the potential to provide comparable performance to other automated pilot cueing systems, and are worthy of further investigation in real cockpit and traffic environments.
In Chapter 5, two main issues on the integration of ANAAPs into the ATC system are discussed with potential solutions. The first issue centers on the inability of controllers to predict future
separation of aircraft performing ANAAPs, and the second issue involves the heterogeneity in the ATC system components. In Chapter 6, a summary of the contributions and conclusions of the thesis is provided.
In the Appendix A, a design principle of using rules/procedures as a means to manage uncertainties and constrain the system behavior into desirable form by providing specific, updated target states toward which the system should be controlled is discussed. In section A.1, the concept is formulated with the design principle that rules can be designed as a mechanism that constrains behavior of a system into a desirable form by providing specific, updated target states toward which the system should be controlled. In sections A.2 and A.3, a generic example (random walk) and an aviation example (VNAV procedure at Eagle, Co) are used to illustrate the concept. In section A.4, the application of the concept to noise abatement approach procedures is demonstrated through the use of procedures to specify the order of thrust-reduction and pitch reduction at the top of descent. In Appendix B, a description of the B737-300/B747-400 simulator is provided. In Appendix C, the data from the experiment in Chapter 4 is presented. A review of considerations other than those discussed in section 2.3 is presented.
2. ANAAPs Definition and Key Drivers for Procedure Design
The definition of ANAAPs design parameters that is presented in the first section below provides a baseline procedure on which the work in the following chapters is based. The rationales for choosing the parameters and the important sources of uncertainty that affect the performance of aircraft flying ANAAPs are discussed in the second section. The general guidelines for designing and implementing an ANAAP are presented in the third section.2.1.
Definition of Procedure Parameters
The profile of a generic ANAAP is shown in Figure 3. The procedure is characterized by the following design parameters:
• W(H): wind vector as a function of altitude H,
• HTOD: the altitude where the aircraft intercepts the three-degree glide slope,
• VTOD: the speed at the top of descent (TOD),
• HI: the altitude at which the thrust is reduced to idle,
• K1: the configuration (flap and gear) schedule,
• VF and HF: the target speed and altitude at a specific distance (defined by
γ
and HF beforelanding on the runway occurs, and
• The glide slope angle
γ
2, which is nominally 3o.
1 Flaps are devices that help increase the lift coefficient of the wing at slow speeds during landing (and takeoff).
Each flap setting corresponds to an increase in the lift and drag coefficient. For instance, a Boeing 767-300 has seven flap settings: 0, 1,5,15,20,25, and 30. The higher the flap setting, the higher the lift and drag coefficients are.
2 This definition assumes the aircraft descends along the glide slope after passing the TOD, but it may be desirable
to design the vertical flight path to have several segments with different flight path angles in some cases e.g., using a vertical segment shallower than γ to provide additional drag for a aerodynamically efficient aircraft or to accommodate a strong tailwind.
As shown in Figure 3, the aircraft commences the procedure at VTOD and HTOD and maintains a
level flight segment until it reaches the top of descent. At this point, the aircraft starts descending to the runway, maintaining VTOD until altitude HI, where the thrust is reduced to idle.
From this point onward, the aircraft decelerates to VF, and if VF is reached prior to HF, thrust is
engaged to maintain VF. VF VTOD HI HF runway HTOD γ W(H) TOD
Figure 3: Procedure Definition
On the pilots’ side, as shown in Figure 4, because the autopilot and the FMS manage all the aircraft’s flight control functions (e.g., idle thrust Tidle, and control surfaces such as rudder,
aileron, and elevator Urud,ail,el) in both the lateral and vertical domains, the pilots’ primary task
(in addition to other standard tasks such as performing the tasks on their checklists and monitoring traffic or weather or others as stated in the normal final descent procedure) is to determine when to extend the flaps (e.g., speed at which flap is extended Uflap) based on their
observation of the aircraft’s parameters such as the aircraft’s position (x), altitude (h), vertical speed (hdot), velocity (v), and deceleration (vdot). The typical pilot procedure for extending the flaps is that on command, via callout of the pilot flying (PF), the pilot monitoring (PM) observes and verifies the relevant aircraft states and executes the order. For instance, upon receiving a flap extension request, the PM observes the flap speed limit and moves the flap handle to the requested position.
It should also be noted that while the speed brake can be used to manage the deceleration of the aircraft by increasing the drag, such utility undermines its usage as a compensatory device for contingency situations. Speed brake usage has been considered as a possible solution [ATF 1994] to normalize the idle descent rate differences among aircraft with different aerodynamic
efficiency. However, this solution was dismissed because the speed brake is intended to function as a compensatory device for unforeseen environmental (wind) and traffic conditions. Using speed brakes also proves to be undesirable from a human factors point of view because pilots may leave the speed brake extended when not needed. To preclude this, many airlines require the pilot flying (PF) keep a hand on the speed brake whenever it is used in flight [AA 2003]. Other reasons that make the usage of speed brakes undesirable include additional airframe noise and vibration in the cabin, which would be uncomfortable for the passengers.
pilot
autopilot
a/c
u
flapT
idle,
u
rud,ail,ela/c states
flap schedule
x,
h,
h,
v,
v,
..
.
.
.
pilot
autopilot
a/c
u
flapT
idle,
u
rud,ail,ela/c states
flap schedule
x,
h,
h,
v,
v,
..
.
.
.
pilot
autopilot
a/c
u
flapT
idle,
u
rud,ail,ela/c states
flap schedule
x,
h,
h,
v,
v,
..
.
.
.
..
.
.
.
140 160 170 190 220 240 Spd 30/G 25 20 15 5 1 Flap 140 160 170 190 220 240 Spd 30/G 25 20 15 5 1 Flappilot
autopilot
a/c
u
flapT
idle,
u
rud,ail,ela/c states
flap schedule
x,
h,
h,
v,
v,
..
.
.
.
pilot
autopilot
a/c
u
flapT
idle,
u
rud,ail,ela/c states
flap schedule
x,
h,
h,
v,
v,
..
.
.
.
pilot
autopilot
a/c
u
flapT
idle,
u
rud,ail,ela/c states
flap schedule
x,
h,
h,
v,
v,
..
.
.
.
..
.
.
.
140 160 170 190 220 240 Spd 30/G 25 20 15 5 1 Flap 140 160 170 190 220 240 Spd 30/G 25 20 15 5 1 FlapFigure 4: Pilots Control Loop During the Deceleration Segment of ANAAP
2.2.
Key drivers for procedure design
2.2.1.
Objectives of System Stakeholders
Because ANAAPs are developed to operate in the national airspace system, the design parameters are synthesized to satisfy the goals set by three main stakeholders: the residential community surrounding airports, the pilot, and the air traffic control operators. The primary goal of the residential community is to reduce the noise impact. Unlike in a standard ILS approach where the aircraft has to fly at low altitudes and low speeds for extended periods, aircraft flying
the ANAAP depicted in Figure 3 intercept the glide slope at a high altitude, typically 6000 or 7000 feet, and decelerate along the glide slope from a VTOD, typically at 210 to 250 knots, to the
approach speed at idle thrust. Because the average speed in an ANAAP is higher than in a standard ILS approach, the flaps and gear are extended later in an ANAAP than in a standard ILS approach procedure. The combination of flying at higher altitudes, lower thrust for longer than ILS approach procedures, and delaying flaps and gear extension significantly reduces the noise impact.
The objectives of the pilot include ensuring adequate safety margins, providing sufficient margins to cope with wind uncertainty, and providing operationally feasible and stable flight control. These objectives can be achieved by judiciously choosing the value of the ANAAPs parameters. The parameter HI provides a means for pilots or controllers to delay the idle thrust
reduction to compensate for higher than predicted headwind, while the parameters HTOD and
VTOD can be adapted to compensate for tailwind conditions. The parameters HTOD, VTOD, and HI
can be selected to allow aircraft to operate within their operational envelope and have a sufficient time to decelerate to the target altitude and speed. The glide slope angle can be chosen to match that of the existing facility (typically varies between 2.5 degrees and 3.1 degrees). It is also important to note that although a fixed flight path angle, such as three degrees, can be designed for both straight-in and curved approaches, the aircraft dissipates more energy in a curved approach because the banking for turning requires a higher angle of attack and produces additional induced drag. To compensate for the additional energy dissipation in a curved approach, one or a combination of these design changes is required: the top of descent must be brought in closer (than in a straight-in approach), a higher value of HI is used, and a small
non-idle thrust is required to maintain the vertical path.
The objectives of the air traffic controllers include ensuring predictability and controllability in aircraft speed, horizontal and vertical flight path, and time of arrival. As defined in Figure 3, the aircraft is assigned a target speed at a target altitude above the runway. The target altitude typically corresponds to the last point along the descent path at which the controller would issue commands to the aircraft. Prior to landing, the speed and altitude targets act as a mechanism to
ensure predictability in the aircraft trajectory in several ways. First, the speed target helps maintain separation by ensuring that the aircraft will decelerate neither so fast that it will impede the trailing aircraft nor so slowly that it will catch up with the leading aircraft. If either case occurs, the separation between aircraft may decrease below the required wake turbulence separation minimum3, forcing the aircraft to break off the approach. The target speed and altitude also ensure that the speed is reduced to a range that allows the aircraft to satisfy the requirement of being fully established and stabilized in the landing configuration by 1000 feet AGL; otherwise a go-around is mandatory. This requirement is critical because a “rushed” approach is the leading cause of approach and landing accidents, including controlled flight into terrain [Cunningham 2003]. For convenience in the analysis throughout this thesis, the target speed and altitude, HF and VF, will be assigned to the altitude and speed that satisfy the stabilized
and fully configured (SFC) criteria and will be referred to as the SFC target. In practice, commercial airline pilots conventionally aim for a window of plus or minus five knots of the SFC speed and altitude. This convention will be used throughout this thesis.
The parameters VTOD, HTOD, HI, and the configuration schedule can be integrated into different
methods that controllers use to sequence and separate aircraft. The integration highly depends on the communication, navigation, and surveillance capability of current and future ATC environments, and will be discussed in more detail in Chapter 3 and Chapter 4.
2.2.2.
Sources of System Uncertainty
To achieve the objectives of all stakeholders, the most critical design challenge remains the management of the effects of system uncertainty on the performance of aircraft flying ANAAP. One of the most important sources of uncertainty is wind prediction error, which stands out as one the largest sources of trajectory prediction error [Williams al et. 1998]. In actual operation, the wind field at the surface is known, but the wind field along the descent path is not completely known. While the magnitude and direction of the wind at the current location can be determined
3 The wake turbulence separation requirements aircraft in different weight classes and relative positions in a queue
instantaneously by onboard inertial navigation systems (INS), the wind information further along the trajectory is anywhere between zero to six hours old and only available every 3000 feet. The resulting wind prediction error would decrease the effectiveness of ANAAP. For instance, in the idle descent phase from HI to HF, a stronger than predicted headwind would result in the aircraft
slowing down to VF sooner than desired. This in turn requires a non-idle thrust level to maintain
VF, and thereby, increases the noise impact.
Another important source of uncertainty that can significantly reduce the effectiveness of ANAAPs is the variability and latent delay in pilot response. This uncertainty results from the unconventional techniques and operation paradigms of ANAAPs that would not have otherwise been associated with standard approaches. An example is the pilot’s usage of flaps and gears. In a standard ILS approach, the flaps and gear are used primarily to transition the aircraft speed from one range to another. Many airlines’ operating manuals such as that of American Airlines [AA 2003] state that “Flaps provide for operation at lower speeds and should not be used as a drag device to reduce speed” and that “Speed reduction should be made using speed brakes in lieu of flaps.” The Boeing Company, a major aircraft manufacturer, suggests, “Avoid using the landing gear for increased drag. This minimizes passenger discomfort and increases gear door life” [Boeing 2003]. Consistent with these technique guidelines, pilots generally do not use flaps and gear as the primary means of slowing down the aircraft. In contrast, the performance of aircraft flying ANAAPs depend critically on the ability of pilots to extend the flaps and gear at the right moments in order to slow the aircraft to a target while decelerating at idle thrust.
Pilot conforming to ATC commands is another example. In the existing operation paradigm, pilots have the discretion, although within a reasonable limit, of determining the instant when to execute the command. For instance, during an approach, upon receiving an ATC command to descend to a lower altitude and maintain the current speed, the pilot may not initiate the descent immediately because generally the command is not time critical in nature. In contrast, pilots performing an ANAAP need to promptly initiate the descent in order to ensure a stable control flight along the descent path and fully achieve the benefits of the procedure.
Finally, another important source of uncertainty is the variability in the aerodynamic and engine performance of aircraft of identical type. For example, two B767-300s may have different deceleration performance for a number of reasons. One reason is that the aircraft may have different weights due to factors such as the number of the passengers on the aircraft, the weight of the cargo, the weight of the fuel, and the aircraft’s zero-fuel weight. For a given aircraft type operating at a particular airport, it is possible to quantify the distribution of the weight, and, thus, incorporate it in the design. Other reasons are that the aircraft’s engines are different due to the fact that different manufacturers produced them, or that the aircraft’s airframe shapes are not the same because of dissimilar assembly or manufacturing processes.
2.3.
Guidelines for Designing an ANAAP for a Specific Airport and
Aircraft
In this section, the guidelines for designing an ANAAP are discussed in two levels. The first level, discussed in section 2.3.1, describes the energy equation governing the basic flight mechanics of an aircraft decelerating; and how the equation can be utilized, without extensive simulation or flight test verification, to determine a preliminary set of the procedure’s parameters. In the second level, more general recommendations are described in Section 2. The recommendations are for refining the preliminary parameters in a research project by conducting further analysis with simulation tools of different levels of sophistication; and eventually using the result of this analysis to synthesize a baseline procedure for actual flight tests for a specific airport and aircraft.
2.3.1.
Preliminary Design Using Energy Equation
To understand the aircraft’s flight dynamics during the deceleration, it is instructive to first review the energy equation, which shows the physical forces that cause the deceleration and the aircraft performance characteristics that determine it. For an aircraft decelerating and descending along a vertical flight path, the rate of change in its total energy (i.e., the sum of the
potential and kinetic energy) is equal to its velocity times the sum of the forces (i.e., drag and thrust). Assuming that the aircraft is modeled as a point mass, then the energy balance equation for the aircraft is
W h + ½ (W/g) Vg2 = ∫(T-D)*Vg dt, (1)
where W is the weight, h is the altitude, g is the gravitational constant, Vg is the ground speed, T
is the thrust, D is the drag, and t is time. Taking the time derivative and assuming that W stays constant with time give
dh/dt + (Vg/g)*dVg/dt = (T-D)*Vg/W (2)
The assumption of constant W is valid because the fuel burnt during the approach is typically a very small fraction of the total aircraft’s weight. Furthermore, assuming that the lift, L, is approximately equal to W, and then the above equation can be rewritten as
sin(Γ) + (1/g)*dVg/dt = (T/W) – Cd/Cl, (3)
where Γ is the flight path angle, and Cd and Cl are the drag and lift coefficients, respectively.
The effect of winds is captured in the ground velocity, Vg, which is the sum of the indicated
airspeed and the speed of the wind. The above equation shows the fundamental relationship of the deceleration, dVg/dt, as a function of the flight path angle, the ratio of the thrust and weight,
and the ratio of the drag and lift coefficients. In order to use the above equation to estimate the parameters of an ANAAP, it is important note that because VNAV can hold a specified flight path angle and the thrust is reduced to near idle or idle when the aircraft is decelerating, the deceleration at each point along the approach can be determined by examining how the ratio of the drag and lift coefficients for each flap setting changes as the aircraft decelerates and using this to compute an average deceleration for each flap setting. Based on this computation, for a given wind condition and an initial condition at the top of descent or any other arbitrary point, different flap schedules can be synthesized to meet the target speed by choosing the range of speed (or time duration or distance) that each flap setting should remained extended.
While the procedure’s parameters obtained by using the energy-based method are only preliminary estimates, they are useful in helping the designer understand the tradeoff among the competing objectives.
2.3.2.
Procedure Design in a Research Project
Given that estimates of the procedure’s parameters had been obtained, the designer’s next step is to choose whether to run a simple computer simulation based on aircraft performance characteristics to refine the parameters and explore the effect of winds; run a complex Monte Carlo Simulation taking into account for other factors such as flap extension time (each flap takes some time to mechanically extend to its full extended position), uncertainty in pilot response, and uncertainty in wind predictions; use a level D simulator to determine the FMS parameters; and validate the procedure with a flight test. The general descriptions of these steps are described below.
1. Verify and refine the procedure’s parameters with fast-time computer simulation: Create a point-mass dynamic model of the aircraft (see Appendix B for an example) and build a fast-time computer simulation based on the aircraft performance data. Use the simulation to refine the procedure’s parameters by obtaining profiles of the aircraft states (e.g., attitudes, speed, thrust, and altitude); exploring the effect of different wind conditions; and ensuring that the procedure meets the basic requirements (e.g., the flap schedule doesn’t violate the placard and minimum maneuvering speeds, and the adequate deceleration is provided for achieving the target)
2. Establish the performance tradeoff and initial separation required between aircraft: Conduct fast time simulation, as outlined in section 3.2, to study a) the performance tradeoff between noise reduction and target achievement; b) the feasible operating envelope for the aircraft for certain levels of uncertainty in the wind prediction and pilot response time. Conduct Monte Carlo simulation studies, as discussed in Appendix A.4, to determine the initial required separation between aircraft and to ensure that the aircraft maintain required separation standards throughout the approach.
3. Determine the FMS parameters of the baseline procedure: Establish the speed and altitude constraints for the profile. Over the range of the expected landing weight, simulate the procedure in a level-D certified simulator and reiterate the parameters based on the tradeoff among flight time, noise reduction in specific areas, potential thrust transients or level flight segments, and adequate deceleration for aircraft to slow down. The reader is referred to section 3.4 for FMS and auto-throttle considerations in designing the procedure.
4. Determine a pilot procedure and cueing system: Develop a pilot procedure based on the established FMS parameters and fast time simulation results. The pilot procedure should include adequate details of the decision-making process and steps for executing the procedure. Depending on how the altitude and speed constraints are placed on the profile, incorporating a cueing system (see section 3.4.3 and chapter 4) to prevent thrust transients, excessive or inadequate deceleration.
5. Evaluate the robustness to winds with level-D simulators: Obtain several wind profiles that would be representative of the actual wind conditions and determine the mean and 2-sigma wind profiles. Simulate the procedure in these wind conditions and determine the deviation from the designed procedure. If the deviation is unacceptable, reiterate the procedure design. 6. Flight test: With real aircraft, perform a flight test, collect data, and reevaluate the feasibility
of the procedure. Solicit controllers and pilots for their feedback, especially on workload. For a review of other considerations, the reader is referred to Appendix D.
3. Managing Uncertainty Through Strategic and Tactical Control
The ANAAP parameters defined in Chapter 2 provide a baseline procedure for design and analysis. In this chapter, the design and analysis is discussed in the context of treating certain ANAAP parameters as tactical and strategic control variables4. In section 3.1, it is shown that certain parameters produce behavior similar to that of strategic control variables, and thereby, can be treated as strategic control variables in the procedure design. Similarly, the parameters that have “fine-tuning” characteristics are designated as tactical control variables. The utility of strategic control variables to design ANAAPs that are robust to variability in pilot response and wind prediction errors are explored in section 3.2. In section 3.3, two concepts for implementing strategic control variables in the current ATC system are proposed. The concepts center on allocating control authority between controllers and pilots, and, in addition, suggest that the FMS is an enabling factor for the near term implementation of tactical control. A summary of well-known issues in the application of the FMS in the terminal area is presented in the first part of section 3.4. In the second part of section 3.4, some potential solutions that are subjects of current research are presented. While these solutions are viable, they are long-term oriented because they require new automation systems in the cockpit, and thus, provide motivations for the development of new, pilot cueing systems that can be implemented in the near term.
3.1.
Tactical and Strategic Control Formulation
The ability of an aircraft to decelerate to achieve the target depends on the aircraft’s drag in each flap setting. However, the range of speeds over which the aircraft may be operated in a given flap setting is limited(each flap setting has an upper speed limit, called the Maximum Placard
4 As defined in this thesis, in a control system consists of strategic and tactical control variables, the strategic control
variable purports to move the system’s states to the desired values within a gross range or resolution, so that the tactical control variable can then drive the states to the desired values within the required, often smaller, range or resolution. For example, on the beams of a physician mechanical scale, the strategic control variable is the 50-lb (strategic) graduation, whereas the tactical control variable is the .2 lb (finer) graduation. To measure a person’s weight, the V-shaped bearing on the 50-lb graduation scale is first adjusted to obtain the weight within 50 lbs of the actual weight, the bearing on the .2-lb graduation is then adjusted to determine the weight in .2-lb resolution.
Speed, and a lower speed limit, called the Minimum Maneuver Speed. The upper limit prevents structural damage, while the lower prevents stall). Thus, for a given wind condition and a HTOD,
the design problem centers on choosing a feasible set of ANAAP parameters (see Figure 3 for reference), consisting of HI, VTOD, and K, that enable the aircraft to achieve the target. Because
one of these three parameters can be determined if the other two are specified, there are three ways to express the relationship among them as shown in Figure 6:
1. K = f(VTOD, HI), where K is determined by fixing VTOD and HI, which means that for a
given choice of VTOD and HI, different flap schedules can be used to achieve the target;
2. VTOD = f(HI, K), where VTOD is determined by fixing HI and K, which means that for a
given choice of HI and K, different VTOD’s can be designed to achieve the target;
3. HI = f(VTOD,K), where HI is defined by fixing VTOD and K, which means that for a given
choice of VTODs and K, different HI’s can be designed to achieve the target.
While all three relationships may be used in the procedure design, it makes sense to use the first relationship because the parameters VTOD and HI can only be selected once prior to the point the
thrust is reduced to idle, after which they cannot be adjusted to account for any perturbations that may occur during the descent. On the other hand, the flap schedule can be adjusted more than once because it has up to six states (flap settings), and thus, can be used to account for uncertainty in the wind and in pilot response. Moreover, in their radio voice communications to pilots, controllers issue commands with even numbers, typically in multiples of 1000 feet for altitude commands and in multiples of 10 knots for speed commands. In this sense, VTOD and HI
can be treated as strategic control variables and the flap schedule can be treated as a tactical control variable.
Based on these observations, the goal of the design is to determine the envelope (or set) of HI
and VTOD that will guarantee a feasible flap schedule. To demonstrate how this can be done, an
example using a generic B757 is examined. The envelope for a B757 weighing 180,000 lbs and operating in no wind is shown in Figure 5. The target is 170 knots at 2350 ft. The Maximum Placard Speed (MPS) and Minimum Maneuvering Speed (MMS) for each flap setting are shown in Table 1 below. As shown in Figure 5, the parameter space of HI and VTOD, where feasible flap
schedules exist, is inside the area bounded by the MMS and MPS lines. VTOD is capped at 240
HI and VTOD inside this area, except along the MMS and MPS lines, there exists an infinite
number of flap schedules since mathematically K = f(VTOD, HI) and K is not unique for a given
pair of VTOD and HI.
Figure 5: Envelope of HI and VTOD that Provides Feasible Flap Schedules.
(V
F,H
F)
H
IV
TODDifferent flap schedules
Different V
TOD’SDifferent H
I’S(V
F,H
F)
H
IV
TODDifferent flap schedules
Different V
TOD’SDifferent H
I’SFlap MMS MPS 0 205 1 185 240 5 165 220 15 145 210 20 145 195 25 130 190 30 130 162
Table 1: Minimum Maneuvering and Maximum Placard Speeds
It is also interesting to note in Figure 5 the general trend of increasing VTOD with increasing HI.
This occurs because increasing HI lengthens the decelerating distance from HI to HF, thereby
requiring the aircraft to start out at a higher initial speed VTOD so that it has adequate speed
differential to decelerate to the target. In other words, if HI is high and VTOD is small, then the
aircraft will decelerate to the target speed prior to reaching the target altitude. Conversely, if HI
is small and VTOD is large then the aircraft will reach the target altitude at a speed higher than the
target speed.
Another separate, important consideration in choosing VTOD is the aerodynamic performance of
the aircraft. For many aerodynamically efficient aircraft, if the flap is not extended to the first or second position prior to the aircraft commencing the idle descent to the runway, the aircraft may accelerate due to insufficient drag. For instance, the B757 at clean configuration (flap zero) would accelerate at HI if VTOD were above 210 knots. Therefore, the flap one position must be
extended prior to reaching HI, but this is done at the expense of increasing the airframe noise.
Although treating HI and VTOD as strategic control parameters allows the pilot make
adjustments to the flap schedule to cope with unforeseen changes in the wind or uncertainty in pilot response, the result demonstrated in Figure 5 indicates that the parameter space that the designer of ANAAPs has to work with is much smaller than that of conventional approaches,
where the aircraft can be initialized anywhere and still achieve the target speed because pilots have the discretion of using the speed brake or the thrust to slow down or speed up the aircraft as often as needed. This implies that in the presence of uncertainty in the wind or in pilot response, achieving the target requires not only an understanding of how the feasible space changes but also development of cueing systems that help pilots perform tactical control, as it is not viable to task pilots to come up with and make adjustment to a flap schedule. These issues will be addressed in section 3.2.2 and Chapter 4 of the thesis.
3.2.
Strategic Control Design for Robustness to Pilot Uncertainty and
Wind Prediction Error
3.2.1.
Robustness to Pilot Uncertainty
3.2.1.1. Modeling Pilot Response Time
The variability in pilot response affects aircraft performance. The pilot can be early or late in initiating the procedure at the TOD, in reducing the thrust to idle at HI, and in extending the gear
and flaps throughout the descent. As demonstrated in Figure 7, when the pilot is early, the aircraft reaches the target speed prior to the target altitude, the thrust must be increased from idle to maintain speed, and, consequently, the non-idle thrust level increases the noise impact. On the other hand, when the pilot is late, the aircraft reaches the target speed after the target altitude, the aircraft may be too fast to land, or not be in fully stabilized and configured position, which, in either case, may lead to a missed approach. Thus, it is important to understand the impact of the variability in the pilot response has on the aircraft and develop strategies to mitigate adverse impact.
Speed Alt
Slow down early: early thrust engagement increases noise impact
Slow down late: undesirable (e.g. unstabilized or missed approach) On target
Target
To investigate and build a model of pilot response time, an experimental study was conducted in the NASA Ames Research Center Crew-Vehicle Simulation Research Facility (CVSRF) B747-400 level-D full motion flight simulator. Complete experimental setup and protocol are reported in [Ho 2001; Elmer 2001]. One of the objectives of this experiment was to measure the pilot response time in initiating the procedure at TOD, reducing thrust to idle, and changing gear and flaps. The eight subjects were airline captains and first officers. They used the autopilot to manage the flight control functions and flew a continuous descent approach (similar to the one in Figure 3) to London Heathrow Airport using a predetermined speed flap-gear schedule. The pilot delay time, defined as the difference of the time when the pilots extended the scheduled flaps minus the scheduled time, was recorded for each run. With this definition, a negative delay time indicates that the pilot is early.
The histogram and the curve-fitted probabilistic distributions (solid lines) of the pilot delay time are shown in Figure 8-Figure 10 for three cases: 1) the pilot flying (PF) provides the cue for the pilot monitoring (PM) to extend the flaps/gear; 2) the PF provides the cue for the PM to extend the flaps/gear with 25% rate of turbulence5; 3) the PF extends the flaps/gear himself. Without turbulence, the variance of the pilot response time is smaller when the PF makes the flaps/gear changes without cues from the PM. This makes sense because the PF does not have to cue (via callout) the PM to move the flap and gear handles. The presence of turbulence increases the variance of the pilot response time as expected because the pilots have to cope with the random variations in speed and altitude caused by turbulence.
5 The magnitude of the wind speed is 25% of the maximum turbulent speed. The components of the maximum
turbulent speed are: u = .742 m/s, v = 43.54 m/s, w = 9.038m/s, yaw = 0 rad/sec, roll = .0027 rad/sec. The method of generating turbulence is proprietary to CAE.
Figure 8: Histogram and Fitted CDF (Cumulative Distribution Function) of Pilot Delay Time (PF Cues PM to Extend Flaps/Gear)
Figure 9: Histogram and Fitted CDF of Pilot Delay Time (PF Cues PM to Extend Flaps/Gear) in 25% Turbulence