HAL Id: hal-00125008
https://hal.archives-ouvertes.fr/hal-00125008
Submitted on 28 Oct 2020
HAL is a multi-disciplinary open access
archive for the deposit and dissemination of
sci-entific research documents, whether they are
pub-lished or not. The documents may come from
teaching and research institutions in France or
abroad, or from public or private research centers.
L’archive ouverte pluridisciplinaire HAL, est
destinée au dépôt et à la diffusion de documents
scientifiques de niveau recherche, publiés ou non,
émanant des établissements d’enseignement et de
recherche français ou étrangers, des laboratoires
publics ou privés.
Interannual Variability of Equatorial Pacific CO2 Fluxes
Estimated from Temperature and Salinity Data
Harilaos Loukos, Frédéric Vivier, P. P. Murphy, D. E. Harrison, Corinne Le
Quéré
To cite this version:
Harilaos Loukos, Frédéric Vivier, P. P. Murphy, D. E. Harrison, Corinne Le Quéré.
Inter-annual Variability of Equatorial Pacific CO2 Fluxes Estimated from Temperature and Salinity
Data. Geophysical Research Letters, American Geophysical Union, 2000, 27 (12), pp.1735-1738.
�10.1029/1999GL011013�. �hal-00125008�
GEOPHYSICAL RESEARCH LETTERS, VOL. 27, NO. 12, PAGES 1735-1738, JUNE 15, 2000
Interannual Variability of Equatorial Pacific
Fluxes
Estimated from Temperature and Salinity Data
H. Loukos
1'2, F. Vivier
3, P. P. Murphy
4, D. E. Harrison
5 and C. Le
6
Abstract. Based on atmospheric data and models, the
tropical CO2 source
anomaly reaches
up to 2 GtC yr -x,
but the respective contributions of the terrestrial biosphere and the oceans to this flux are difficult to quantify. Here we present a new method for estimating CO2 fluxes from oceanic observations based on the surprisingly good predic- tive skill of temperature and salinity for surface dissolved inorganic carbon. Using historical temperature and salin- ity data, we reconstruct the basin scale CO• flux to the atmosphere in the equatorial Pacific from 1982 to 1993.
We find that interannual anomalies do not exceed 0.4 4-0.2
GtC yr -x which suggests
that up to 80% of the tropical
CO• source anomaly is due to the terrestrial biosphere.
Introduction
The largest natural source of CO• to the atmosphere is
the tropical ocean [Takahashi
et at., 1997]. Upwelling of
subsurface
waters rich in dissolved
inorganic carbon (DIC)
maintains a higher partial pressure
of CO• (pCO2) in the
surface ocean than in the overlying atmosphere, which re- sults in a CO• outgassing from the ocean. As the largest tropical ocean and the main scene of upwelling variability
forced by E1 Nifio-Southern
Oscillation
events (ENSO), the
equatorial Pacific is a major contributor to the global inter-
annual fluctuations
of oceanic
CO• evasion
rates [Lee et at.,
1998; Le Qu&i et at., 1999].
The most direct approach to determine the mean regional value of pCO• and its interannual variability is from in situ measurements. In the equatorial Pacific, pCO• has been measured regularly on five longitudinal sections since 1992
[Feety et at., 1999]. Despite increasingly
better data cov-
erage, basin scale estimates are still affected by the need
of significant interpolation. An alternative approach is
to infer pCO2 from other water properties (mainly tem-
perature) for which more data is available. Lee et at.
[1998] use a SST-pCO• relationship
for seasonal
to inter-
annual estimates in the equatorial Pacific. However, be-
cause
of the coarse
resolution
of their method (4 ø x5ø), the
1Laboratoire d'Oc6anographie Dynamique et de Climatologie,
Institut Pierre Simon Laplace, Paris, France
2Formerly at the Joint Institute for the Study of the Atmo-
sphere and Ocean, University of Washington
SApplied Physics Laboratory, University of Washington 4National Oceanographic Data Center, NOAA, Silver Spring,
Maryland
5Pacific Marine Environmental Laboratory, NOAA, Seattle,
Washington
6Laboratoire des Sciences du Climat et de l'Environnement,
Institut Pierre Simon Laplace, Gif sur Yvette, France Copyright 2000 by the American Geophysical Union. Paper number 1999GL011013.
0094-8276/00/1999GL011013505.00
spatial structure of pCO• within its high-gradient region is
weakly captured, particularly at the edge of the warm waters
of the western
pacific (the Warm Pool). Boutin et al. [1999]
propose to modulate the CO• flux by the zonal displacement of the Warm Pool, but this method is only valid between the equator and 5 ø South.
Here we propose to estimate pCO2 from both SST and
sea surface salinity (SSS) observations. In the equatorial
Pacific, surface variability of nutrients and DIC is primarily controlled by the physical structure of the upper water col-
umn because biological activity closely follows the variability
of dynamical processes that supply surface waters with the
essential nutrients [Archer et al., 1996; Carside and Car-
side, 1995]. Because
SST and SSS variability reflect those
physical changes, they can be used to estimate the surface concentrations of DIC, from which pCO• can be calculated. We show that a single SST-SSS-DIC relationship can be used in the equatorial Pacific for both ENSO and non-ENSO con-
ditions. This allows us to estimate CO• evasion rates at the
spatial and temporal coverage of the SST and SSS observa-
tions.
Method
We calculate a polynomial approximation of DIC by lin-
ear least square fitting to surface
data (< 20m depth) from
six surveys between 10øN-10øS and 170øW-96øW covering both ENSO and non-ENSO conditions of the early 1990's
(WOCE sections
P17C, P17S/P16S, P16C of 1991, EQPAC
cruises
of 1992, and WOCE section P18 of 1994). We limit
our study to DIC measurements made using similar meth-
ods and calibrated against standard reference
materials
1 . A
fourth order polynomial is selected, since increasing order
does not significantly decrease quadratic error.
dic -
0.4665 - 0.7004t-[- 0.6352s - 0.1841t
•
-[-0.1021ts
- 0.4304s
• - 0.0349t
a -[- 0.0757t•s
-]-0.0899ts
2 _ 0.1831s
a -]- 0.0181t
4 - 0.0341t•s
+0.0884t2s
2 + O.0211ts
a -- 0.0220s
4
(1)
where dic = (DIC-2000)/50, t = (SST-25)/3, and s = (SSS-
35)/0.5. •r=4. 9 /•mol kg -•, with 435 samples.
This fit is
remarkable given the range of SST and SSS and the seasonal-
to-interannual variability encountered during those cruises
(17-30øC and 33.7-35.9). The SSS dependency
accounts
mainly for the south-north gradient of DIC, while upwelled
waters with high DIC content have SST-SSS characteristics
much more scattered with increasing temperature. Data •Reported standard deviations for DIC measurements from each cruise are 4- 2 •mol kg -•. Certified reference material for
DIC developed by A. Dickson (UNESCO Report 60, 1990) were
used to control the quality of the measurements. In consequence,
the between-cruise bias was estimated to be < 4 •mol kg -•
1736 LOUKOS ET AL' EQUATORIAL PACIFIC CO2 EVASION RATES 2060 2O40 1980
t 960
t
940
.'
19•0 190o 1880 1860 South -8 -4 0 4 8 North b 430 4•0390
'"'
'r
;170--- 350• 250
--•
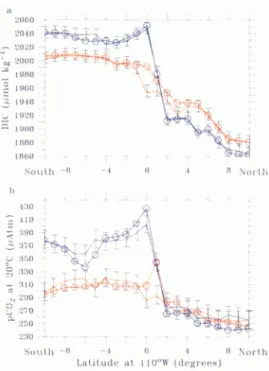
230 South-• -t 0 4 •t Norih Latitude at 110øW (degrees)Figure 1. DIC and pCO2 at 20 ø C at 110 ø W. Data (circles) and estimates (line) for ENSO (Spring of 1992) in red and non ENSO conditions (Fall of 1992) in blue.
from the same cruises show that pCO2 and (SST, SSS) cou-
ples have no one-to-one relationship. Thus, pCO2 is calcu-
lated from the estimated DIC and alkalinity (TA) using a
thermodynamic model for the carbonate system in sea-water
[Murphy, 1996] where TA is also expressed
as a function of
SST and SSS according
to Millero et al., [1998]. Figure 1
illustrates the satisfactory agreement between measured and estimated surface DIC and pCO2.
To evaluate the potential of this method, we estimate the bulk pCO2 difference between the ocean and the atmo-
sphere (ApCO2) on a 1.5øxl.5øgrid (140øE- 95øW and
5øN- 10øS, Figure 2a) from surface DIC and TA inferred
from basin scale monthly SST [Reynolds
and Smith, 1994]
and SSS [Delcroix,
1998]. However,
like DIC, the estimated
pCO2 does not include changes induced by anthropogenic
CO2 emissions
(• 5 pmol kg-•yr -• or 1.25 patm yr-•).
Therefore, to estimate ApCO2 we assume a similar anthro- pogenic CO2 increase in the ocean and in the atmosphere,
which agrees
with the observed
trend [Feely et al., 1999].
The CO2 flux to the atmosphere (Pc) is estimated from
ApCO2 as Pc -- GEC x ApC02 where GEC is the gas exchange coefficient which depends primarily on the wind
speed [Wanninkhof,
1992] (Figure 2b). We use monthly
values from the wind speed reanalysis (1979-1993) by the
European Centre for Medium Range Weather Forecasts, a consistent product that assimilates wind speed data mea- sured by the TAO array. The beginning of our study period is set by the SST field and the end by the wind product.
The flux estimates (Figure 2c) are subject to errors from
(1) DIC (c=-F9 pmol
kg
-•) and TA (c=-F5 pmol
kg-•); (2)
uncertainties
in the SST (-F0.5øC)
and SSS (+0.1) fields; (3)
accuracy of the pCO2 calculation (-t-5/•atm); (4) uncertain- ties in the wind dependency of GEC and wind forcing (250-/0); and (5) the ocean skin temperature effect (-F0.3øC). Only (1) and (3) are specific to this study. The DIC fit will be
improved as more data become available, especially for La Nifia events, in order to include large SST-DIC anomalies. Considering all the above errors and after comparison with field data, we estimate a 50% uncertainty on the CO2 fluxes.
Results and discussion
High ApCO2 (high DIC) values occur in the cool-salty central and eastern equatorial Pacific, and low ApCO2 (low DIC) cover the warm-fresh western Pacific (Figure 2a). Dur-
ing ENSO events, the eastward advection of western waters is reflected in the appearance of low ApCO2 along the equa- tor. The most dramatic change for the 1982-93 period oc- curs during the 1982-1983 E1 Nifio. Moreover, periods of low ApCO2 coincide with low GEE' since reduced upwelling
is associated with a relaxation of the Trade Winds. Those
two parameters act together to modulate Pc.
The evasion rate (Rc, the basin integral of Pc, Figure 3) is in agreement with field estimates (Table 1). Indeed, our
estimate of Pc falls within the uncertainties of the observa-
tions. The only substantial discrepancy is for the 1982-83
E1 Nifio: we estimate
a minimum
evasion
rate of 0.3 Gt yr- •
while in situ data suggest no-flux conditions. Because the field estimate did not include observations south of the equa- tor, where recent data indicate relatively higher pCO2, we
find no cause for concern over the difference in flux estimate.
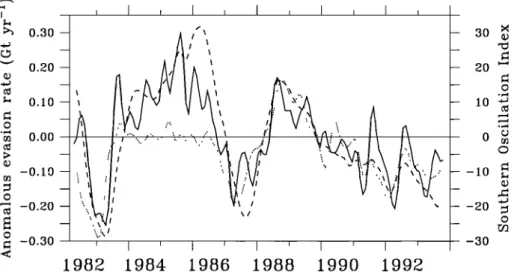
Negative anomalies of Rc follow the Southern Oscillation
Index (SO1) with several
months lag (3-4 months like SST).
They occur during 1982-83, 1986-87 and almost continu-
a) ApCO 2 _ __
Sep93
Mar93 -Sep92
Mar92 Sep91 Mar91 Sep90-Mar90
Sep89
!
Mar89 Sep88Mar88
Sep87
Mar87 Sep86 - , Mar86 - Sep85 Mar85 Sep84- Mar84 Sep83 , Mar83 Sep82 - Longitude c) F c , b),GEC , , I•OE 160W 110W 150E 160W 110W Longitude Longitude 0 20 40 60 80 50 100 150 200 0 2 4 6Figure 2. (a) ApC02' air-sea CO2 gradient (ttatm), (b) GEC:
gas exchange coefficient (moles m -2 day -• atm-•), and (c) Fc: CO2 evasion rate (moles m -2 day -•) averaged between 5øN -
LOUKOS ET AL' EQUATORIAL PACIFIC CO2 EVASION RATES 1737 0.30 0.20 0.10 0.00 -0.10 -0.20 -0.30
.
^,/It,
',,
l'Vlll
...
_
•
'
A•
..V-•A
-
I
•
I
__
:.. • I ..•;; ... ...
.... , ...
.... ,
?..
• ; I "'..'
... :" :v"
•....
...j
• .."•
• /I • /' ': -- .• • • ß • : ß .... • • i I •*• :* • •*' '**'* •• • •••
'"•
/ ' _
30 • 20 • 10 -• 0 • -- -10 • -- -20 • o 3O 1982 1984 1986 1988 1990 1992Figure 3. Anomaly of the CO2 evasion rate between 140øE-90øW and 5øN-10øS (thick line). The estimate from Le Qu•r• et al.
(dashed line) and the Southern Oscillation Index (dotted line) are plotted for comparison. Errors are 4-50% (see text). All data is
smoothed with 3-month Hanning filter.
ously after 1989. Positive anomalies do not always correlate with the SOI. Even though Rc was high during the 1988-
89 La Nifia (highest SOI of the period), its highest values
occurred between the 1982-83 and 1986-87 ENSO events, when the SOI did not record anomalous conditions. During the cold event of 1988-89, estimated DIC reached a maxi- mum, but the potential increase in ApCO2 was reduced by a
SSS-driven
TA maximum centered
in 1988-89 (not shown).
The variability of Rc inferred from this study and from the model simulation of Le Quiri et al. are in excellent
agreement (Figure 3). These authors use the same wind
product to evaluate the GEC for the model predicted pCO2. Therefore differences are mostly related to pCO2 estimates. Our results also support those of Lee et al., 1998 and Boutin et al., 1999 that suggest a relatively small interannual vari- ability of Rc in the equatorial Pacific. Such a satisfac- tory agreement between four inherently different approaches
Table 1. Comparison of ApCO2 and CO2 evasion rates
Region Year Field This estimate study
(patm/OtC y-i)
Non-ENSO conditions 10øS-10øN, 80øW-135øE 10øS-10øN, 80øW-120øE 10øS-10øN, 80øW-135øE 5.5øS-5.5øN, 80.5øW-134.5øE 1984 1984 1989 1989 60/0.6 (1) 60/0.8 (2) 50/0.4 (3) 79/1.0 (4) ENSO conditions 10øS-10øN, 80øW-135øE 10øS-10øN, 80øW-135øE 5.5øS-5.5øN, 80.5øW-135.5øE 10øS-10øN, 80øW-135øE 50/0.7 5fo.8 44/0.7 53/0.5 1983 2/0.02 (1) 24/0.3 1987 5/0.09(3) 30/0.4 1987 31/0.4 (4) 31/0.2 1992 27/0.3 (5) 32/0.4ApCO2 estimates are directly comparable while part of the discrepancies in CO2 fluxes can be attributted to differences in formulations and wind forcing. Sources: 1, [Feely et al., 1987]; 2,
[Yolk et al., 19891; 3, [Wong et al., 19931; 4, [Inoue and $igimura,
1992]; 5, [Feely et al., 1995].
(in situ data, SST-SSS-DIC relationship, SST-pCO2 rela- tionship, model study) strongly sugests that ENSO-related
--1 anomalies of CO2 evasion rates do not exceed 4- 0.4 Gt yr in the equatorial Pacific.
Another way to evaluate the oceanic contribution to in- terannual CO2 variations is from inverse methods using the
zac ratio of atmospheric
CO2. These methods
allow to dis-
tinguish between oceanic and terrestrial contributions to at-
mospheric
CO2 variability (e.g. [Francey et al., 1995; Keel-
ing et al., 1995]).
On a global
scale,
•ac inversions
attribute
a much greater role to the ocean than is infered from oceanic
studies [Lee et al., 1998; Le Qu•r• et al., 1999]. This remains
true for the tropics. A recent study by [Raynet et al., 1999]
estimates the ENSO-related tropical CO2 source anomaly
as 1-2 Gt yr -• from which 1 Gt yr -• is attributed to the
ocean. Our flux estimate
is 0.5 4-0.3 GtC yr -• with anoma-
lies of 0.4 4-0.2 GtC yr- • (we increase
Rc by 20% to roughly
estimate the contribution of the tropical Atlantic and Indian
oceans [Takahashi
et al., 1997]).
Do oceanic/atmospheric based estimates under/over-esti-
mate oceanic uptake variability? The answer is certainly not straightforward, but we would argue in favour of a greater role played by the terrestrial biosphere, compared to that of the ocean as to ENSO-related changes of tropical sources of CO2. Although we recognize that ocean-based methods may underestimate the variability on ENSO timescales due for in- stance to unsufficient spatio-temporal coverage in the data, or underestimation of interannual variability by geochemical models, recent improvements of atmospheric-based methods
either by reducing
uncertainties
in the •aC method
[Fung
et
al., 1997]
or by inversions
that do not use •aC data but only
the spatial distribution of C02[Bousquet
et al., 1999], show
better agreement with ocean-based estimates such as the one presented here.
The use of SST and SSS data to reconstruct spatial and temporal variability of ocean pCO2 is shown to be reason- able in the equatorial Pacific. The developing ability to re-
motely sense
SSS [Lagerloef,
1999] and of pCO2 algorithms
similar to that presented here could provide useful tools for global mapping of time dependent pCO2 in the equatorial Pacific and possibly elsewhere.
1738
LOUKOS ET AL.: EQUATORIAL PACIFIC CO2 EVASION RATES
Acknowledgments. We are grateful to T. Delcroix for
providing the SSS data, to all the carbon PIs for collecting the data and to CDIAC for distributing the data. HL and FV thank S. Hankin and K. Kelly for their support. This publication was supported by JISAO under NOAA Cooperative Agreement NA67RJO155, contribution 747.
References
Archer, D. E., et al., Daily, seasonal, and interannual variability of sea surface carbon and nutrient concentration in the equatorial Pacific Ocean, Deep Sea Res. Part II, 43, 779-808, 1996. Bousquet, P., P. Peylin and P. Ciais, Interannual changes in CO2
sources and sinks from 1980 to 1998: results of an inversion of CO2 atmospheric data and comparison with ocean and land ecosystems models, paper presented at AGU 1999 Fall Meet- ing, S. Francisco, Dec. 13-17, 1999.
Boutin, J., et al., Satellite sea surface temperature: a powerfull tool for interpreting in situ pCO2 measurements in the equa- torial Pacific Ocean, Tellus, 51B, 490-508, 1999.
Delcroix, T., Observed surface ocean and atmospheric variability in the tropical Pacific at seasonal and ENSO timescales: A tentative overview, J. Geophys. Res., 103, 18,611-18,633, 1998. Feely, R. A., et al., Distributions of chemicals tracers in the eastern tropical Pacific during and after the 1982-1983 E1
Nilo/Southern Oscillation event, J. Geophys. Res., 92, 6645-
6558, 1987.
Feely, R. A., et al., CO2 distributions in the equatorial Pacific during the 1992-91 ENSO event, Deep Sea Res. Part II, 42, 365-386, 1995.
Feely, R. A., R. Wanninkhof, T. Takahashi and P. Tans, Influ- ence of E1 Nifio on the equatorial Pacific contribution to atmo- spheric CO2 accumulation, Nature, 398, 597-601, 1999. Francey, R. J., et al., Changes in oceanic and terrestrial carbon
uptake since 1982, Nature 373, 326-330, 1995.
Fung, I., et al., Carbon 13 exchanges between the atmosphere and biosphere, Global Biogeochem. Cycles, 11, 507-533, 1997. Garside, C., and J.C. Garside, Euphotic zone nutrient algorithms for the NABE and EqPac study sites, Deep Sea Res. Part II, 42, 335-347, 1995.
Keeling, C. D., T.P. Whorl, M. Wahlen and J. van der Plicht, Interannual extremes in the rate of rise of atmospheric carbon dioxide since 1980, Nature, 375, 666-670, 1995.
Inoue, H. and Y. Sugimura, Variations and distribution of CO2 in and over the equatorial Pacific during the period from the
1986/88 E1 Nifio to the 1988/89 La Nifia event, Tellus, JJB,
1-22, 1992.
Lagerloef, Progress toward salinity remote sensing satellite mis- sions, Second Workshop of the Salinity Sea Ice Working Group, NASA Goddard Space Flight Center, Grennbelt MD, USA, 19-21 April 1999.
Lee, K., et al., Low interannual variability in recent uptake of atmospheric carbon dioxide, Nature, 396, 155-159, 1998. Le Qu•r•, C, et al., Interannual variability of the oceanic sink of
CO• from 1979 to 1997, Global Geochem. Cycles, in press. Millero, F.J., K. Lee and M. Roche, Distribution of alkalinity
in the surface waters of the major oceans, Mar. Chem., 60, 111-130, 1998.
Murphy, P.P., The carbonate system in seawater, laboratory and field studies, Ph.D. Dissertation, 297 pp., Univ. of Washington,
1996.
Rayner, P.J., R.M. Law, R. Dargaville, The relationship between tropical CO• fluxes and the E1 Nifio-Southern Oscillation, Geo- phys. Res. Lett., 26, 493, 1999.
Reynolds, R.W., and T.M. Smith, Improved global sea surface temperature analysis using optimum interpolation, J. Clim.,
7, 929-948, 1994.
Takahashi, T., et al., Global air-sea flux of CO2: An estimate based on sea-air pCO2 differences, Proc. Natl. Acad. $ci., 94, 8292-8299, 1997.
Volk, T., Effect of the equatorial Pacific upwelling on atmospheric CO2 during the 1982-83 E1 Nifio. Global Geochem. Cycles, $, 267-279, 1989.
Wanninkhof, R., Relationship between wind speed and gas ex- change over the ocean, J. Geophys. Res., 97, 7373-7382, 1992. Wong, C. S., et al., Changes in equatorial CO2 flux and new production estimated from CO2 and nutrients levels in Pacific surface waters during the 1986-87 E1 Nifio. Tellus, 45B, 64-79,
1993.
H. Loukos, Laboratoire d'Oc•anographie Dynamique et de Cli- matologie, UPMC Boite 100, 4 Place Jussieu, Paris 75252 Cedex
05, France. (e-math 1oukos•ipsl.jussieu.fr)
F. Vivier, Applied Physics Laboratory, University of
Washington,
1013 NE 40thSt, Seattle, WA 98105. (e-math
fvi@apl.washington.edu)
P.P. Murphy, National Oceanographic Data Center, NOAA,
1315 East-West Highway Silver Spring, MD 20910. (e-mail: pmur- phy@nodc.noaa.gov)
D.E. Harrison, Pacific Marine Environmental Laboratory,
NOAA, 7600 Sand Point Way N.E., Seattle, WA 98115. (e-math harrison@pmel.noaa.gov)
C. Le Qu•r•, Laboratoire des Sciences du Climat et de
l'Environnement, CEA Saclay, 91191 Gif sur Yvette, France. (e- mail: lequere@lsce'saclay'cea'fr)
(Received August 26, 1999; revised December 23, 1999; accepted February 24, 2000.)