Sequence stratigraphy and bedding rhythms of an outer ramp
limestone succession (Late Kimmeridgian, Northeast Spain)
B. Ba´denas
a,*, M. Aurell
a, F.J. Rodrı´guez-Tovar
b, E. Pardo-Igu´zquiza
c aDepartamento de Ciencias de la Tierra, Universidad de Zaragoza, 50.009 Saragossa, Spain b
Departamento de Estratigrafı´a y Paleontologı´a, Universidad de Granada, 18.002 Granada, Spain c
Department of Mining and Mineral Engineering, University of Leeds, Leeds LS2 9JT, UK Received 16 July 2002; accepted 19 February 2003
Abstract
Facies, stratal and spectral analyses of an outer ramp lime mudstone succession (Aguilo´n, north Iberian Ranges, Spain) are presented in this work. The studied succession is Late Kimmeridgian (eudoxus and beckeri zones) in age and comprises the transgressive and highstand deposits of a third-order depositional sequence. A number of higher-order sequences (bundles and sets of bundles) have been identified based on the comparative analysis of the bedding planes. The bundles and sets of bundles show a well-defined stratal pattern. Spectral analysis has provided further independent confirmation of the cyclical nature of the bundles and sets of bundles defined from field analysis.
The bundles have variable thickness (from 1 to 2 m) and are formed by up to 10 micritic beds. They have been related to sea-level changes controlled by the orbital precession cycle, affecting the shallow productivity area. A significant amount of the lime mudstones accumulated in outer ramp settings were derived from resedimentation of the shallow carbonate production areas. Many of the bundles show a lower interval with a thinning and fining-up trend, indicating a progressive decrease of the carbonate production (and carbonate export) during periods of high-frequency sea-level rise.
The late transgressive and highstand deposits show sets of bundles (groups of five bundles, from 5 to 8 m) probably related to sea-level changes controlled by the short eccentricity cycle. The overall thickness and the stacking pattern observed in the sets of bundles are controlled by the long-term sea-level variation. The sets of bundles located in the late transgressive deposits show thinner micritic beds in their lower or middle part. The sets of bundles found in the highstand deposits are thinner and show a thickening-up and thinning-up trend. On the studied carbonate ramp, during periods of long-term sea-level rise, the overall carbonate production (and carbonate export) is high, although the superposition of the high-frequency sea-level rises may result in episodic flooding and drowning of the shallow ramp areas. During periods of long-term, early highstand of sea level, the overall carbonate production (and carbonate export) is more reduced, but it has maximum peaks during the transgressive (and early highstand) intervals of the high-frequency level cycles. Sedimentation during the long-term sea-level fall (late highstand) was scarce and discontinuous in the outer ramp area, and resulted in the overall thickness reduction of the sets of bundles.
D 2003 Elsevier Science B.V. All rights reserved.
Keywords: Kimmeridgian; Iberia; Carbonate ramp; Sequence stratigraphy; Cyclostratigraphy; Spectral analysis
0037-0738/03/$ - see front matterD 2003 Elsevier Science B.V. All rights reserved. doi:10.1016/S0037-0738(03)00099-X
* Corresponding author. Fax: +34-976-761087.
E-mail addresses: [email protected] (B. Ba´denas), [email protected] (M. Aurell), [email protected] (F.J. Rodrı´guez-Tovar).
1. Introduction
A large carbonate ramp opened to the Tethys Sea towards the east occupied the northeastern part of the Iberian Plate during the Kimmeridgian (Salas, 1989; Aurell et al., 1994, 2002; Ba´denas and Aurell, 2001a). During the Late Kimmeridgian – earliest Tithonian, three depositional domains were clearly defined on the ramp (Fig. 1A), giving rise to a flat-topped morphology(Aurell et al., 1995). Coralgal reefs and oolitic shoals were developed in the inner and prox-imal mid-ramp areas, which corresponded to the shallow morphological segment of the platform. The silicilastic supply affecting these areas was very scarce. The distal mid-ramp area represented the inclined morphological segment and was character-ised by the deposition of lime mudstones and coarse-grained tempestites. Grains mainly derived from the shallow oolitic shoals and reefs compose these storm deposits (Ba´denas and Aurell, 2001b). The erosion and resedimentation by storm-generated density cur-rents from the shallow ramp areas were favoured by the windward orientation of the Iberian basin margin. Offshore, the outer ramp area corresponds to the deep morphological segment, where well-bedded lime mudstones and marls were deposited. The origin of these lime muds was attributed to a combination of inshore-derived muds and pelagic muds. However, ascribing relative proportions of both processes remains problematic and was evaluated by combined petrographic and computer modelling analysis(Aurell et al., 1998; Boylan et al., 2002).
Sea-level fluctuations at different frequencies have great influence of the carbonate production in shallow platform areas (Strasser et al., 1999). In the Iberian basin, high-order sea-level fluctuations controlling the episodic stages of reef growth were reported in some shallow ramp areas of the Kimmeridgian ramp. For instance, in the Jabaloyas area (see Fig. 1 for loca-tion),Aurell and Ba´denas (1997)have described high-order sequences that involve the partial drowning of the ramp and the rapid growing of coralgal pinnacle reefs during stages of sea-level rise. The increase of carbonate production during the highstand episodes results in the rapid progradation of the shallower facies. Alonso et al. (1986) and Alonso and Mas (1990)also reported on high-order sea-level fluctua-tions controlling the episodic growing of successive
reefs during the Early Kimmeridgian in the north-western Iberian basin. The causal link between the carbonate produced in shallow ramp areas and the outer ramp lime mudstones established in the Iberian Kimmeridgian ramp(Aurell et al., 1995, 1998; Ba´de-nas and Aurell, 2001b) provides the opportunity to examine the possible imprint of sea-level fluctuations at different frequencies in the facies and thickness variations of these outer ramp muds.
In this work we present a facies, stratal and spectral analysis of the Kimmeridgian outer ramp lime mud-stones exposed in the Aguilo´n section, located south of Zaragoza in the Northeast Spain (Fig. 1). The results of the facies and sequential analysis of the Aguilo´n succession are presented in several steps. After the description of the vertical facies distribution, we interpret the studied succession in terms of long-term relative sea-level variation. The bed-by-bed analysis performed on the Aguilo´n succession allows us to study in detail its stratal pattern. A number of high-order sequences (bundles and sets of bundles) are defined based on the analysis of the bedding planes. A spectral analysis using the bed-thickness data of the succession has also been carried out. The spectral analysis has provided further independent confirmation of the cyclical nature of high-order sequences preliminarily defined from field observa-tion. Considering all this information, the possible relationship of the high-order sequences to the orbital cycles of precession and eccentricity is discussed.
2. Studied section and stratigraphic setting The studied section is located along the road side north to the Aguilo´n village, in the southern limb of an east – west trending anticline. This tectonic struc-ture involves Lower Jurassic (Toarcian) to Lower Cretaceous (Barremian) units (Corte´s et al., 1999). The Kimmeridgian – Tithonian of Aguilo´n consists of three lithostratigraphic units: Sot de Chera, Loriguilla and Higueruelas formations(Fig. 2). The Sot de Chera Formation (uppermost Oxfordian, upper planula Zone, to middle – Lower Kimmeridgian) is formed by 55 m of marls with occasional marly – limestones beds intercalation. The Loriguilla Formation extends up to the Kimmeridgian – Tithonian boundary. The lower part of the unit consists of a 50-m-thick
rhyth-mic alternation of silty lime mudstones and marls. The upper part is formed by 63 m of well-bedded lime mudstones, with occasional marly interbeddings. The
Higueruelas Formation (Tithonian) is a 50-m-thick unit of shallow platform limestones mainly formed by grain-supported oolitic, oncolitic and reefal facies.
Fig. 1. (A) Facies distribution of the Upper Kimmeridgian in the Iberian basin. Reference localities mentioned in the text are indicated. (B) Synthetic cross section showing facies and systems tracts distribution from shallow areas (Ricla) to outer ramp domains (Aguilo´n). Modified fromBa´denas and Aurell (2001a).
The succession studied in this work corresponds to the upper part of the Loriguilla Formation. This unit forms a depositional sequence, bounded by regional sedimentary discontinuities (Ba´denas and Aurell, 2001a). In outcrops corresponding to shal-lower settings (Ricla, see Fig. 1B), the lower sequence boundary is indicated by a significant backstepping of mid-ramp carbonate facies (coralgal reefs, lime mudstones with oolitic and bioclastic tempestites). These transgressive facies overlie the inner ramp cross-bedded oolitic limestones and sand-stones, which characterise the late highstand of the previous sequence. In Aguilo´n, the transgressive event at the onset of the studied sequence is
indi-cated by a sharp decrease of the terrigenous silty grains (quartz, micas) and marly intervals, recognised between the mixed carbonate – siliciclastic muds of the lower Loriguilla Formation and the pure carbo-nate muds of the upper Loriguilla Formation. This discontinuity is located around the acanthicum – eudoxus zones boundary (Ba´denas and Aurell, 2001b), and is likely to correspond to the Kim 4 boundary reported by Hardenbol et al. (1998) in the Tethyan domain.
The age assignment of the upper Loriguilla Forma-tion in Aguilo´n (Upper Kimmeridgian, eudoxus and beckeri zones) is based on the presence of ammonites and larger benthic foraminifera. Alveosepta jaccardi is present in the uppermost part of the Aguilo´n section (i.e., up to bed 222, see Fig. 3). This foraminifera extends up to the Kimmeridgian – Tithonian boundary (e.g.,Hardenbol et al., 1998). The occasional presence of Upper Kimmeridgian ammonites (Aspidoceras longispinum apeninicum (SOWERBY), Progeronia sp.) is coherent with this age assignment but does not provide a precise date to locate the boundaries of the eudoxus and beckeri zones.
The upper boundary of the studied sequence is marked, in the marginal areas of the Iberian basin, by the rapid onset of middle and inner ramp facies of the Higueruelas Formation (Aurell et al., 2002). This boundary was related to an important long-term, relative sea-level fall, which involved a basinward shift of the coastline by 30 – 60 km around the Kimmeridgian – Tithonian boundary (see dotted line inFig. 1A;Aurell et al., 1994, 2002). In Aguilo´n, the upper sequence boundary is included in a 1-m-thick interval of irregular and highly burrowed beds (see sequence boundary zone, SBZ, inFig. 6). This boun-dary is located in the uppermost part of the beckeri Zone and may be equivalent to the Kim 5 boundary reported by Hardenbol et al. (1998) in the Tethyan domain.
3. Facies analysis
The graphic log of the Aguilo´n section is shown in
Fig. 3. The vertical distribution of different key components is presented bed by bed. The total thick-ness of the succession is 63 m and consists of 231 lime mudstone beds, from 0.07 to 1.1 m thick. Mean
Fig. 2. Stratigraphy of the Upper Jurassic in the Aguilo´n area. The depositional sequence studied in this work is indicated in grey. The most probable equivalents sequence boundaries of theHardenbol et al. (1989)chart has been indicated (Kim 4 and Kim 5).
thickness of the single beds is 0.27 m. The succession includes only nine marly levels: the thickest one (1.5-m-thick bed of argillaceous-limestones) is located at the bottom of the succession; the others are interbeds never thicker than 0.1 m. The bedding planes gen-erally consist of planar to slightly irregular surfaces. The upper 4.5 m of the succession displays highly irregular bedding planes.
Main components of the limestone beds are skel-etal grains. The proportion of terrigenous grains (micas and quartz silt) is very low, and only reaches a significant value (5 – 10% of volume) upwards from bed 201. According to the proportion of the skeletal components, three categories of lime mudstones are differentiated: poor (less than 3% of skeletal nents), medium (from 3% to 7% of skeletal compo-nents) and rich mudstones (from 7% to 10% of skeletal components). The most abundant skeletal grains are bivalves. In some levels, the bivalves are found as whole specimens, occasionally in life posi-tion. In the studied area, most of the specimens identified represent epifaunal genera (Grammatodon, Cingentolium, Entolium, Plagiostoma), with lower proportion of semi-infaunal (Inoperma) and infaunal genera (Unicardium, Pholadomya)(Delvene, 2001).
Other relatively abundant skeletal grains are echi-noderms, serpulids (occasionally forming small col-onies), sponge spicules, gastropods and solitary corals. Minor skeletal grains include brachiopods and benthic foraminifera (lituolids). Accumulations of bivalve bioclasts, without grain-supported texture, are found in some beds, forming either pseudocircu-lar concentrations (small patches up to 5 cm in diameter) or poorly graded discontinuous levels (few centimetres thick) parallel to the stratification surface. The most abundant trace fossil in the lime mudstone beds is small-size (diameter from 1 to 2 mm) Chondrites, with the only occasional presence of Planolites. The Chondrites traces are noncom-pacted or only slighly deformed. Its relative abun-dance is indicated inFig. 3.
3.1. Description
The variation in the abundance of some of the fossil groups (whole bivalves, gastropods, serpulids, solitary corals and lituolids) along with the vertical variation of the relative proportion of Chondrites
allows the differentiation of five facies. The main features of these facies are as follows:
Facies 1: Variable lime mudstones with abundant Chondrites and benthic fossils (beds 1 – 65, 21 m thick). This facies begins above the discontinuity surface corresponding to the sequence boundary
(Ba´denas and Aurell, 2001a). It consists of poor lime mudstones, with some medium and rich lime mudstones. Chondrites traces generally are present. Bivalves are abundant. Other skeletal grains (serpulids, gastropods) and the bioclastic accumu-lations are frequent.
Facies 2: Poor lime mudstones with scarce Chondrites and benthic fossils (beds 66 – 120, 13.3 m thick). The lower boundary is sharp and is marked by a textural change (dominance of poor mudstones), a sharp decrease of Chondrites traces and by the absence of bioclastic levels. The bivalves are still frequent, whereas gastropods and corals are found in lower proportion.
Facies 3: Poor lime mudstones with scarce Chondrites and very scarce benthic fossils (beds 121 – 154, 9.8 m thick). The boundary between facies 2 and 3 is gradual. However, facies 3 is defined by a significant decrease of the skeletal grains, which are only represented by very scarce bivalves and gastropods. Solitary corals and serpul-ids are absent.
Facies 4: Medium and rich lime mudstones with abundant and diverse benthic fossils (beds 156 – 202, 13.54 m thick). The boundary between facies 3 and 4 is sharp and is marked by a significant textural change. Medium and rich lime mudstones are dominant, and they result from the relative high abundance of bivalves and gastropods, as well as solitary corals and serpulids. The presence of Chondrites is variable but abundant in the middle part of this facies. Bioclastic patches and levels are relatively frequent.
Facies 5: Variable micaceous lime mudstones with abundant benthic fossils (beds 203 – 224, 5.4 m thick). They consist of poor mudstones, followed in the upper half of the facies by medium lime mudstones. Upward from bed 205, the limestones show important bioturbation and are bounded by highly irregular bedding planes. Chondrites traces are absent. Similar to the previous facies, bivalves
Fig. 3. Detailed log of the studied succession of Aguilo´n. TD: transgressive deposit; HD: highstand deposit; MFZ: maximum-flooding zone; SBZ: sequence-boundary zone.
and gastropods are abundant, although solitary corals and serpulids are absent. Moreover, this facies display up to 10% of micas and quartz silt and benthic foraminifera (generally ferruginized and fragmented lituolids: A. jaccardi, Everticyclammina sp., Nautiloculina oolithica, Rectocyclammina sp.). 3.2. Interpretation: depositional environment
The lime mudstone succession of the Aguilo´n out-crop was originated from deposition in an outer ramp setting (seeFig. 1;Ba´denas and Aurell, 2001a,b). In the Iberian Kimmeridgian ramp, the storm-wave base, which defines the boundary between mid- and outer ramp zones (see Burchette and Wright, 1992), was assumed to be located at a depth of around 40 – 60 m (see discussion byAurell et al., 1995). In the studied succession, the poorly graded bioclastic levels occa-sionally found may correspond to distal, diluted tem-pestites, typical of outer ramp environments(Aigner, 1985; Burchette and Wright, 1992). The bioclastic patches may also be interpreted as distal tempestites, later disrupted by the effects of bioturbation.Ba´denas and Aurell (2001b)have described proximal tempest-ites in mid-ramp settings (Ricla outcrops, seeFig. 1). The tempestite levels are concentrated in facies 1, 4 and 5. This implies a lower hydrodynamic energy during the deposition of facies 2 and 3, where the tempestite levels are absent.
The most abundant presence of benthic fossils and Chondrites is in facies 1 and 4. In contrast, facies 2 and 3 display a much lower proportion of benthic fossils and Chondrites traces. Low-bottom-water oxygenation can limit the diversity of benthic life (Allison et al., 1995). The Chondrites traces alone were considered as diagnostic of dysaerobic environments (e.g.,Bromley and Ekdale, 1984; Savrda and Bottjer, 1986). These traces are developed in cohesive substrates. In the Aguilo´n section, the Chondrites traces are noncom-pacted or only slightly deformed, indicating that they were produced after the first stage of compaction. The common presence of solitary corals and serpulids in the facies where Chondrites is abundant (i.e., facies 1 and 4) gives additional support to the presence of cohesive substrates. On the other hand, most of the identified bivalves correspond to epifaunal genera. It is possible that the presence of cohesive substrates may have deterred later colonisation by infaunal bivalves.
3.3. Sedimentary evolution: transgressive and high-stand deposists
The studied succession corresponds to a deposi-tional sequence, bounded by regional sedimentary discontinuities (Ba´denas and Aurell, 2001a). In shal-lower areas, this sequence consists of a TST and a HST (Ricla, seeFig. 1B). The TST is characterised by an agradational growth of coralgal reefs that grade offshore into lime mudstones with proximal tempest-ites. The HST corresponds to the progradation of inner ramp silty lime mudstones and skeletal packstones
(Ba´denas and Aurell, 2001b). The presence of the trangressive and highstand deposits of the studied depositional sequence in the outer ramp succession of Aguilo´n can be tested from the obtained facies data. The sharp decrease of the benthic fossils and Chondrites between facies 1 and facies 2 – 3 and the absence of distal tempestites in facies 2 – 3 were originated by lower circulation of bottom waters and reduction of bottom-water oxygen values due to an increase of depositional depth during the long-term transgression. The increase of the benthic fossils and Chondrites traces from facies 3 to 4 indicates in turn a shallowing event. The presence of micas, quartz silt and resedimented lituolids and the increase of bio-turbation in facies 5 reflect further shallowing and the setting of a higher-energy environment. The absence of Chondrites in facies 5 may be related to the existence of a soft substrate, as indicated by the absence of solitary corals and serpulids.
Accordingly, the studied succession is interpreted as a transgressive – regressive depositional sequence, with a maximum-flooding zone located around the boundary between facies 3 and 4 (MFZ inFig. 3; see
Montan˜ez and Osleger, 1993; Pasquier and Strasser, 1997 for definition). Early and late transgressive deposits correspond to facies 1 and facies 2 – 3, respectively. Facies 4 and 5 represent the early and late highstand deposits, respectively.
4. Stratal analysis
4.1. Description: bundles and sets of bundles The definition of high-order sequences in Meso-zoic pelagic and hemipelagic successions is usually
based in the relative thickness between the marly and limestones intervals (e.g.,Fischer, 1991; Giraud et al., 1995; Pittet et al., 2000). The studied hemipelagic (outer ramp) succession does not allow this approach, because it only shows scattered marly interbeddings. In this succession, the definition of high-order sequen-ces is based on the comparative study of the character of the bedding planes. Following the terminology of
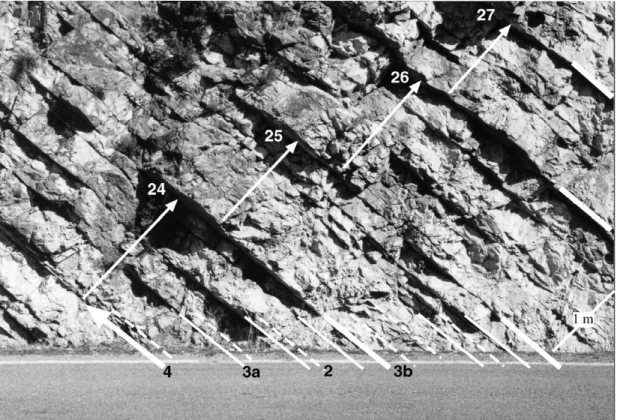
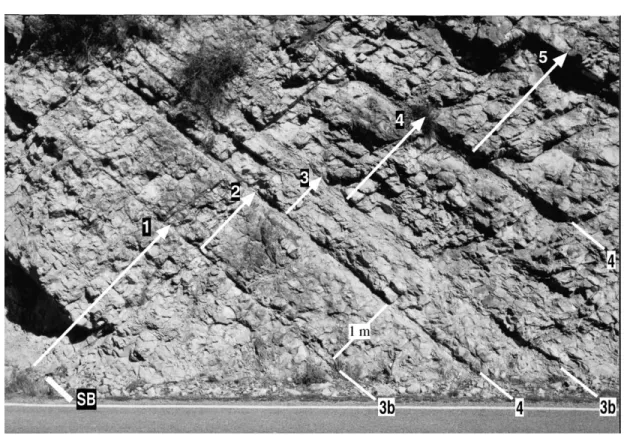
Schwarzacher and Fischer (1982), with some modifi-cations, four types of bedding planes have been differentiated: types 1, 2 and 4 bedding planes of these authors and two categories of type 3 bedding planes. The assignment of any of these types of surfaces to the bedding planes of the studied succes-sion is evident from field observation. The field aspect of these surfaces is illustrated inFigs. 4 – 6.
Type 1 bedding plane is a planar or irregular weak surface, developed only locally (i.e., in dm domain). These surfaces have been locally recognised in some of the beds but have not been indicated inFig. 3. Type 2 surface is a weakly developed bedding plane, which
is discontinuous at outcrop scale. Schwarzacher and Fischer (1982) define a type 3 surface as a strong bedding plane, continuous through outcrop that may show a visible thin film of clay. We have differ-entiated type 3a, a definite bedding surface, and type 3b, a stronger planar bedding surface. Type 4 (master bedding plane) is a sharp bedding plane, which commonly displays a morphological expression in the outcrop surface. The type 3 and type 4 bedding planes can be followed over several hundreds of metres at the outcrop scale.
The studied trangressive – regressive depositional sequence shows a distinct grouping of beds into packets or ‘‘bundles’’ and sets of bundles. A total of 45 bundles have been identified (Fig. 3). They corre-spond to strata sets bounded by type 3b or type 4 bedding planes. They have a mean thickness of 1.4 m, and are formed by 1 – 11 limestone beds (bounded by type 2 or type 3a bedding planes). In 20 of the bundles, there is a clearly defined stacking pattern in the limestones beds, forming either thinning-up or
symmetric (thinning to thickening-up) sequences. Nearly half of the bundles show a clear textural evolution, commonly fining-up, from medium-rich mudstones to poor mudstones.
Major changes in the character of stratification along with the presence of type 4 bedding planes allows to differentiate sets of bundles. These sets are clearly recognised in the upper part of the succession (from bundle 19), which corresponds to the late transgressive deposits and to the whole highstand deposits (Fig. 3). They consist of groups of five bundles (except the uppermost set, which includes only two bundles) with no apparent stratal pattern in the thickness distribution of the included bundles. The lower part of the succession (early transgressive deposits), with no significant changes in the character of stratification and abundant and randomly distrib-uted type 4 bedding planes(Fig. 5), does not allow a clear definition of sets of bundles.
In the late transgressive deposits, two sets of bundles can be differentiated. Set 19 – 23 (8.35 m
thick) is bounded by sharp type 4 bedding planes that have an evident morphological expression. Set 24 – 28 (7.72 m thick) is characterised by the pres-ence of highly tabular beds (Fig. 4). In set 19 – 23, the thinner beds are located in their middle part, whereas set 24 – 28 presents a general thickening-up trend of beds.
Set 29 – 33 (5.63 m thick) shows tabular to irregular stratification surfaces, with a less marked morpholog-ical expression. Thick beds of poor mudstones are found in its lower part, whereas the upper part is dominated by thinner beds with mid- and high mud-stone textures. The maximum-flooding zone of the long-term depositional sequence (located around the boundary between facies 3 and 4, see Fig. 3) is included in this set.
In the highstand deposits, three sets of bundles are defined. Set 34 – 38 (5.41 m thick) is characterised by irregular to tabular beds with poorly marked morpho-logical expression. The thicker beds and coarser mud-stones are located in the middle part of this set. Set
39 – 43 (5.06 m thick) is characterised by tabular strata with a well-defined morphological expression. The set shows an increase of bed thickness in its upper part. Set 44 – 45 (4.61 m thick) is characterised by highly irregular bedding planes (Fig. 6) and displays a general coarsening-up trend.
4.2. Origin of bundles
Einsele and Ricken (1991) discussed the mecha-nisms forming the limestones – marls alternations found in outer shelf or deep carbonate ramp environ-ments. According to the dominant lime mudstone lithology of the studied succession, its depositional environment (in the outer ramp, at the lower end of storm action) and the proximity to the shallow pro-ductivity areas (ca. 30 km), only two of the proposed mechanisms can be considered to explain the observed stratal pattern: fluctuations of pelagic supply and fluctuations in the in-shore derived sediment.
Periodic fluctuations of pelagic carbonate supply (productivity cycles) are important for carbonate cycles with an entirely pelagic carbonate fraction
(Einsele and Ricken, 1991). In the Iberian Kimmer-idgian ramp, only a small proportion of recognisable coccoliths was found and the relative proportion of pelagic muds in the outer ramp lime mudstones remains uncertain (Aurell et al., 1998). A significant part of the lime mud was derived from shallow ramp areas (Ba´denas and Aurell, 2001a,b). The proportion of the in-shore-derived mud varies from more than 1:2 to 1:3 in the different computer simulations of the Iberian carbonate ramp(Aurell et al., 1998; Boylan et al., 2002).
Periodic fluctuations of sediment supply with ter-rigenous sediment is thought to be a major process for calcareous depositional environments with a minor but oscillating terrigenous input such as the outer shelf or epicontinental sea(Einsele and Ricken, 1991). Due to the very low proportion of silicilastic grains and
Fig. 6. Field view of bundles 42 – 45. The different types of bedding planes (boundaries of bundles) are indicated. The sequence-boundary zone (SBZ) consists of irregular and burrowed beds located between the top of bundles 45 and the massive oncolitic and peloidal limestones of the Higueruelas Formation.
marly intervals in the studied succession, variations of terrigenous input were not significant. However, tak-ing into account the causal link between the shallow productivity areas and the carbonate accumulated in deep ramp areas (see alsoMilliman et al., 1993 and
Pittet and Strasser, 1998), periodic fluctuations of the in-shore-derived muds may explain the observed stratal pattern.
High-order sea-level fluctuations largely affect the shallow platform domain and its direct influence in the deeper areas of the basin is more limited. In the Iberian Kimmeridgian ramp, high-order sea-level fluc-tuations controlled the episodic stages of reef growth in the shallow ramp areas. The boundaries of these high-frequency sequences are defined by subaerial exposure surfaces of variable extent, followed by a condensed transgressive deposit(Alonso et al., 1986; Aurell and Ba´denas, 1997). In the studied hemipelagic succession, limestone deposition was interrupted by events, which produced bedding planes (Schwar-zacher and Fischer, 1982). A direct relationship between the intensity of the bedding plane and the duration of the interruption event is assumed. The omission events that caused the type 3b and type 4 bedding planes (boundaries of the bundles) occurred in a cyclic pattern. They represent the longer periods of no-sedimentation recorded in the succession and can be related to periods of no-sedimentation in shallow platform areas.
Based on the analysis of several Oxfordian – Ber-riasian shallow platform sections, Strasser et al. (1999)have related the stacking pattern of depositio-nal sequences to accommodation changes. In the shallow carbonate platform domain, a thinning-up trend can be explained either by a rapid deepening that reduces the activity of the carbonate-producing ecosystem, or by a loss in accommodation if, at the same time, facies indicates a shallowing trend. A thickening-up trend can be explained by a general increase of accommodation. The thickest beds indi-cate maximum gain in accommodation if carbonate productivity is high enough to fill the available space. Considering the relationship between the shallow productivity areas and the outer ramp accumulation sites established in the Iberian Kimmeridgian ramp, the models developed byStrasser et al. (1999)can be applied to a certain extend to the studied hemipelagic succession. The high-order sea-level fluctuations
affecting the shallow ramp areas induced variations of carbonate productivity and, consequently, change of carbonate export into the deeper areas. Many of the studied bundles show a decrease in the thickness of the beds (thinning-up trends), and some of them show also a progressive reduction in the amount of coarse skeletal grains included in the micritic matrix (fining-up trends). This trend would be indicative of a progressive reduction of the carbonate exported to outer ramp areas induced by a rapid deepening in the shallow productivity areas. The thickening-up upper interval present in the symmetric bundles is indicative of a progressive increase of the exported lime mud. A shallowing process (i.e., loss in accommodation) may allow the recovery of the activity of the carbonate-producing ecosystem, the increase of the carbonate production, and also its export.
4.3. Origin of sets of bundles
The stacking pattern and vertical facies evolution of the sets of bundles are also interpreted in terms of cyclic variations of the carbonate exported from the shallow productivity area. There are significant differences in the stacking pattern between the sets developed in the third-order transgressive and high-stand deposits. The superposition and interaction of sea-level cycles of different frequencies affecting the shallow productivity areas may explain these differences.
In the early transgressive deposit, the larger omis-sion surfaces (type 4 bedding planes) are abundant and there is no distinctive evidence for the definition of sets of bundles. The repeated presence of type 4 bedding planes can be related to the superposition of sea-level rise events of different frequencies, resulting in the episodic loss of the carbonate productivity (i.e., drowning) in shallow ramp areas and in the correlative loss of carbonate export.
The sets of bundles recorded in the late trans-gressive deposits (sets 19 – 23 and 24 – 28) show the thinner beds located in their lower or middle parts
(Fig. 3). The observed thinning-up and thickening-up trend is thought to be coeval with episodes of decrease – increase of carbonate production in the shallow productivity areas (and carbonate export), induced by the high-order sea-level fluctuations, which were documented on the shallow reefal facies
by Aurell and Ba´denas (1997). These sets are the thicker sets of the studied succession. These larger overall sedimentary rates would correlate to the peri-ods of long-term sea-level rise, when the shallow areas of the ramp were flooded and the high carbonate production resulted in the vertical aggradation of the reefs (seeFig. 1B;Ba´denas and Aurell, 2001b).
The set 29 – 33, located in the transition zone between the transgressive and highstand deposits (i.e., maximum-flooding zone), shows an overall decrease of thickness of beds, with a coeval increase of skeletal grains. The presence of serpulids and corals in the upper part of the set indicates the development of cohesive substrates during stages of low-sedimen-tary rates. This fact reflects an overall decrease of carbonate production (and carbonate export) related to a widespread deepening of the shallow platform areas during the maximum-flooding zone development.
Three sets of bundles have been defined in the highstand deposits. The lower two sets (sets 34 – 38 and 39 – 43) show a thickening-up and thinning-up trend. According to the models proposed byStrasser et al. (1999), they could reflect an increase – decrease of accommodation, with the maximum gain in accom-modation indicated by the thickest beds. This partic-ular arrangement is explained by their location in the early highstand deposits of the long-term sequence. In this case, the high-frequency sea-level rises did not involved the flooding of the shallow platform, and the high carbonate productivity resulted in a larger car-bonate export (see Kendall and Schlager, 1981; Schlager et al.,1994). The thinning-up evolution found in the upper part of the sets can be related to the progressive loss of accommodation (and carbonate productivity) during the late highstand phases of the high-frequency sea-level cycles.
Bundles 44 and 45 are located below the long-term sequence boundary zone(Fig. 6). In this case, there is an important loss of accommodation on the platform, and high-order cycles can be condensed, eroded, or have never been deposited(Strasser et al., 1999). Low and discontinuous sedimentation in bundles 44 and 45 is outlined by intense bioturbation. However, these two bundles are unusually thick and have a much larger number of beds than the other bundles devel-oped in the highstand deposit(Fig. 3). A reasonable explanation is that bundles 44 and 45 correspond to two sets of bundles (bounded by type 4 bedding
planes) in which the individual bundles are condensed (poorly defined) or some of them even absent.
In the highstand deposits, the bundles and sets of bundles are thinner than in the transgressive deposits
(Fig. 3), indicating a progressive loss of the overall carbonate productivity during the long-term sea-level highstand and fall at the upper part of the third-order depositional sequence.
5. Spectral analysis of the limestone thickness sequence
Two types of higher-order sequences (bundles and sets of bundles) have been identified based on the comparative analysis of the bedding planes. The bundles and sets of bundles are formed by a variable number of beds that show diverse stratal patterns, including thinning-up successions, symmetrical sequences (thinning-up to thickening-up) or an appa-rent random distribution of beds of diffeappa-rent thickness. In order to corroborate the results of the field analysis by an independent tool, a spectral analysis of the limestone thickness sequence was conducted in the Aguilo´n succession.
5.1. Methodology
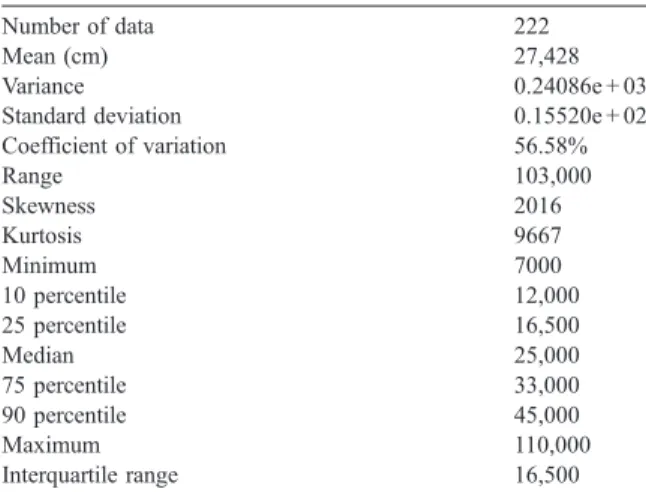
The bed-by-bed analysis performed on the Aguilo´n succession allows to study in detail its stratal pattern. This research was conducted using the bed-thickness data of the succession. The succession is composed by a total of 231 beds, 222 of them corresponding to micritic limestones. The nine marly interbeds ( < 4% of the total number of beds) are very different in thickness to the rest of the succession. Therefore, their thickness data were eliminated before the mathemat-ical treatment. Thus, the analysis was focused on the 222 limestone beds (a total of 60.9 m thick). Some of the basic statistics of the bed-thickness data are shown inTable 1.
In order to perform a classical spectral analysis on such a series of data, it is necessary to sample the succession with a constant sampling interval. There is not a general consensus for choosing the most adequate sampling interval. While for some authors an interval smaller than the thinnest beds encountered with some frequency makes no sense (Schwarzacher
and Fischer, 1982), in other papers, a sampling interval equal to or less than the thickness bed present is recommended (Weedon, 1991). According to the bed-thickness data registered in the Aguilo´n section (see Table 1), with a 7-cm-thinnest bed, an interval length of 5 cm (slightly less than the 7 cm) has been chosen. The new sequence with constant sampling interval has 1218 samples. The second step that is routinely done in spectral analysis is the subtraction of
the experimental mean in order to have a zero mean series with the sampling interval, which is then adequate for processing with the most widely used spectral estimators. The zero-mean sequence with a constant sampling interval is shown in Fig. 7.
A review of the power-spectrum estimators most frequently used in cyclostratigraphy may be found in
Schwarzacher (1975, 1993). A computer program implementation of estimators like the periodogram, smoothed periodogram, Blackman – Tuckey approach, maximum entropy, autoregressive spectral estimator, Thomson multitaper, and Walsh spectrum estimator is given in Pardo-Igu´zquiza et al. (1994, 2000). In general, all spectral estimators tend to give similar results if they have a statistically sound foundation. However, some estimators may be more efficient for dealing with short sequences, others with long sequences. A general strategy recommended for spec-tral analysis in cyclostratigraphy is to use several methodologies. Following this strategy, the smoothed periodogram, the maximum entropy approach, and the Blackman – Tuckey power-spectrum estimator have been used in this work(Figs. 8 and 9).
The nonsmoothed periodogram of the thickness sequence is shown in Fig. 8A. The periodogram is useful in order to locate the frequency of spectral
Fig. 7. Evolution of the zero-mean sequence with constant sampling interval in the Aguilo´n section. Table 1
Basic statistics of the bed-thickness data (cm) analysed
Number of data 222
Mean (cm) 27,428
Variance 0.24086e + 03
Standard deviation 0.15520e + 02
Coefficient of variation 56.58% Range 103,000 Skewness 2016 Kurtosis 9667 Minimum 7000 10 percentile 12,000 25 percentile 16,500 Median 25,000 75 percentile 33,000 90 percentile 45,000 Maximum 110,000 Interquartile range 16,500
peaks, although many of them are spurious. Even a random sequence with any cyclic component will have a periodogram with peaks. Nevertheless, the main drawback of the periodogram, from a statistical
point of view, is that it is not a consistent estimator, i.e., the variance of the estimator does not decrease as the number of data (series length) increases. In order to have a consistent estimator, the periodogram must
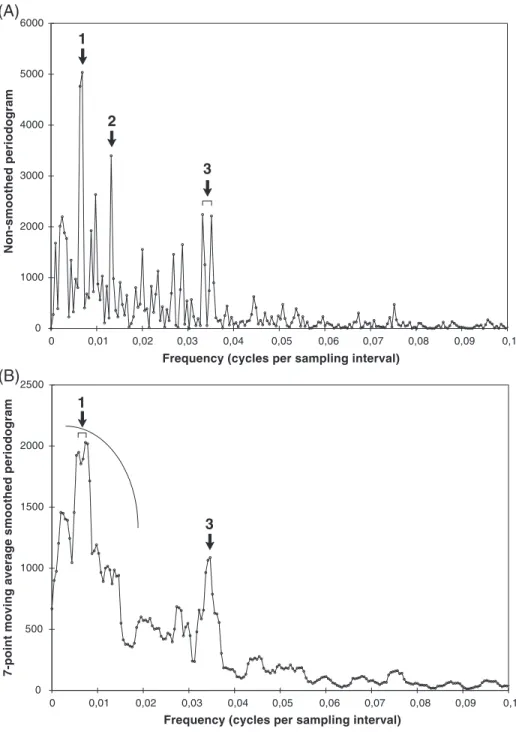
Fig. 8. (A) Nonsmoothed periodogram of the thickness sequence in the Aguilo´n section. Black arrows for the most prominent peaks. (B) Seven-point moving average smoothing performed on the periodogram shown in (A). Black arrows for the most prominent peaks.
Fig. 9. (A) Maximum entropy power spectrum for M = 200 (discontinuous line) and M = 100 (continuous line) terms. White and black arrows for the most prominent peaks with M = 200 and M = 100, respectively. (B) Blackman – Tuckey power-spectrum estimator using 400 terms for the covariance function and using the Tuckey window for side-lobe effect reduction. Background of red-noise spectrum has been drawn together with the 90%, 95% and 99% confidence intervals. Black arrows for the most prominent peaks.
be smoothed. The more smoothing it is done, the more statistically significant are the remaining peaks. A seven-point moving average smoothing has been performed on the periodogram shown in Fig. 8A, and the result is shown in Fig. 8B. In Fig. 9A, the maximum entropy power-spectrum estimate have been represented for M = 200 and M = 100 terms. Finally, the Blackman – Tuckey power-spectrum esti-mator using 400 terms for the covariance function and using the Tuckey window for side-lobe effect reduc-tion has been applied (Fig. 9B). In the last case, a background of red-noise spectrum has been added, together with the 90%, 95% and 99% confidence intervals.
5.2. Results
A detailed examination of the different spectral analyses (Figs. 8 and 9) allows recognising several peaks of different significances. These peaks are recorded, whatever the methodology applied, at sim-ilar frequency values (cycles per sampling interval) and the corresponding wavelengths (thickness)
(Table 2).
In the nonsmoothed periodogram, three spectral peaks have been identified as the most prominent (arrows in Fig. 8A). Peak 1 at a frequency of 0.006836 (731.4 cm), peak 2 at 0.01318 (379.3 cm), and peak 3 (two close peaks) at frequencies of 0.03320 (150.6 cm) and 0.03516 (142.2 cm). How-ever, in the smoothed periodogram(Fig. 8B), the most distinctive peak (peak 3) remains at a frequency of 0.03418 (146.3 cm), while in the low frequency range, there is a very broad broken peak, which is character-istic of the presence of red noise (arc inFig. 8B). This
broken peak shows two prominent sub-peaks (labelled as peak 1 inFig. 8B) at frequencies of 0.007324 and 0.007812, corresponding to 682.7 and 640.0 cm, respectively (Table 2).
The maximum entropy power-spectrum estimate have been represented for M = 200 and M = 100 terms
(Fig. 9A). With M = 200, three prominent spectral peaks (white arrows in Fig. 9A) are seen at frequen-cies of 0.007389 (676.7 cm) for peak 1, 0.01314 (380.6 cm) for peak 2, and 0.03448 (145.0 cm) for peak 3(Table 2). However, when only M = 100 terms are used, it is possible to realise how: (a) the spectral peak at frequency around 0.013 has completely dis-appeared, (b) the peak at the lowest frequency (peak 1) has shifted its frequency (0.006568, corresponding to 761.2 cm), and (c) the peak (peak 3) at the highest frequency remains unmistakably in the same position (0.03366, corresponding to 148.5 cm) (Table 2).
Finally, the Blackman – Tuckey power spectrum shows two prominent peaks (Fig. 9B). From those, the peak 3 at a frequency around 0.035 (0.03448, corresponding to 145.0 cm) is over the 99% confi-dence limit, while peak 1 at low frequencies (0.006568, corresponding to 761.2 cm) is recorded around the 90% confidence band.
From the above, the most immediate interpretation is the existence of a relevant cyclicity in the stratal pattern of the Aguilo´n succession when the thickness data of the limestone beds are analysed. Moreover, focusing on the several peaks recorded, some signifi-cant features are revealed:
1. Peaks 1 and 3 (Figs. 8 and 9and Table 2) can be considered of primary origin. They are recorded as prominent peaks in all spectral analyses performed.
Table 2
Frequencies and corresponding wavelengths (thickness in cm) of the selected peaks recognised in the spectral analysis performed
Spectral analysis Peak
1 2 3
Frequency Thickness Frequency Thickness Frequency Thickness
Nonsmoothed periodogram 0.006836 731.4 0.01318 379.3 0.03320 150.6 0.03516 142.2 Smoothed periodogram 0.007324 682.7 0.03418 146.3 0.007812 640.0 Maximum entropy (M = 200) 0.007389 676.7 0.01314 380.6 0.03448 145.0 Maximum entropy (M = 100) 0.006568 761.2 0.03366 148.5 Blackman – Tuckey 0.006568 761.2 0.03448 145.0
2. From these two peaks of primary origin, the spectral analyses show one of them as statistically significant (over the 99% confidence band). This peak (peak 3 in Figs. 8 and 9 and Table 2) is recorded in a frequency range between 0.03320 and 0.03516 (depending of the methodology), corresponding to 142.2 – 150.6 cm; the most frequent value is 0.03448 (145.0 cm). The second peak, less significant, is located in the lower frequency band (peak 1 inFigs. 8 and 9andTable 2). This peak shows at frequencies between 0.007812 and 0.006568, corresponding to 640.0 and 761.2 cm, the latter being the most frequent value.
3. According to the most frequent values of these two peaks, the ratio between their frequencies is around 5:1 (0.034480:006568 = 5.2).
4. Peak 2, with a frequency around 0.013 (380 cm), is only recorded occasionally and disappears with increasing smoothing. Considering that its fre-quency is twice that of the peak 3, it can be interpreted as a harmonic of peak 3.
6. Possible imprint of orbital cycles in the Aguilo´n succession
There is a satisfactory match between the results obtained from field and facies analyses, and those reached from the spectral analysis. The mean thick-ness of the bundles (1.4 m) and the sets of bundles (6.4 m) are in the lower thickness range of spectral peaks 3 (1.4 – 1.5 m) and 1 (6.4 – 7.6 m), respectively. In addition, each set of bundles includes five individ-ual bundles, and therefore there is a similar ratio as the one observed between the two spectral peaks.
The interpretation of the possible origin of the two high-order sequences defined from field analysis (equivalent to the two peaks considered as primaries in the spectral analysis) may be approached following the two most usual ways: analysing the ratios between their corresponding frequencies, and estimating their temporal duration.
The ratio between the bundles and the sets of bundles can be compared with the established ratios between the most usual cycles recorded in Pre – Pleis-tocene sediments within the Milankovitch frequency band. The estimated ratios between the frequencies of
Milankovitch cycles during the Upper Jurassic (around 150 My BP) are 1:1.20:2.07:2.66:5.21:6.77:22.69 for the orbital periods of precession (P1– P2, 18,200 –
21,900 years), obliquity (O1– O2, 37,700 – 48,500
years) and eccentricity (E1– E2– E3, 94.9 – 123.3 ky
for short-term and 412.9 ky for long-term)(Berger et al., 1989, 1992). According to this, the ratio calculated in our example is similar to that between the orbital periods of precession and short eccentricity.
The frequency ratio may therefore be used to interpret and evaluate a possible Milankovitch origin for the cyclicity in the stratal pattern of the Aguilo´n limestone succession. The most prominent cycle (bundles) can be interpreted as having formed in tune with the orbital cycle of precession, and the less significant (one set of bundles), in relation with the short eccentricity cycle. This interpretation is consistent with previous analyses on the imprint of orbital forcing on the stratal pattern of Kimmerid-gian sediments performed in other areas of the Iberian Peninsula or in other Tethyan basins. For instance, in hemipelagic successions belonging to the Platynota Zone (Lower Kimmeridgian) in the Betic Cordillera (southern Spain), the orbital imprint of precession and eccentricity cycles was demon-strated (Olo´riz et al., 1992; Olo´riz and Rodrı´guez-Tovar, 1998).Colombie´ (2002) reports the existence of precession and eccentricity cycles in the Kimmer-idgian successions of the Vocontian Basin and in the Central Jura.
The temporal calibration of the recorded cycles requires a frame of time duration for the interval under consideration. The studied succession corresponds to the Upper Kimmeridgian eudoxus and beckeri zones. There are significant variations in the attribution of geological ages and duration for the studied interval (e.g., Harland et al., 1990; Gradstein et al., 1994).
Hardenbol et al. (1998) present a sequence chrono-stratigraphic framework of European basins using the
Gradstein et al. (1994)time-scale. These authors give a precise time calibration of the Upper Kimmeridgian biozones and the third order sequence boundaries. If we assume that the proposed ages are more or less correct, an independent test of the origin of the registered cycles could be approached.
The lower boundary of the studied depositional sequence is located around the acanthicum – eudoxus zones boundary, and is likely to correspond to the
Kim 4 boundary reported byHardenbol et al. (1998)
in the Tethyan domain. The upper sequence boundary located below the Kimmeridgian – Tithonian boundary may correspond to the Kim 5 boundary(Fig. 10). Age equivalent sequence boundaries have been reported in other European basins, such as the Jura Mountains
(Gygi et al., 1998; Colombie´, 2002), the Vocontian Basin(Colombie´, 2002), the Lusitanian Basin (Lein-felder, 1993) or southern England (Taylor et al., 2001). The duration between Kim 4 and Kim 5 is 1.15 my. If we consider that bundles 1 – 43 correspond to the precession cycle (with a mean duration of 20 ky), and that bundles 44 and 45 represent eccentricity cycles (with a mean duration of 100 ky), the duration would be around the 1.06 my. Thus, there is a small mismatch with the time duration of the studied suc-cession and that proposed byHardenbol et al. (1998).
Colombie´ (2002) has reported on the existence of 12 – 14 small-scale sequences (related to the short eccentricity cycle) in the Jura platform between the Kim 4 and Kim 5 sequence boundaries. Six small-scale sequences were defined in the transgressive deposits of the Jura platform(Fig. 10). In the Aguilo´n section, 30 bundles have been defined up to the middle part of the maximum-flooding zone(Fig. 3). Assuming the relationship 1:5 for bundles and set of bundles, the transgressive deposits of the Aguilo´n section also consists of six sets of bundles. The discrepancy between the number of small-scale
sequences defined in the third-order highstand depos-its in the Jura platform and the equivalent sets of bundles (Aguilo´n, Iberian basin) can be related to a regional tectonic event affecting the Jura platform
(Colombie´, 2002). In addition, the observed mismatch can be explained considering that the uppermost Kimmeridgian recorded in the Aguilo´n succession is condensed or absent close to the upper sequence-boundary zone.
7. Conclusion
Detailed analyses of facies and stacking pattern of an outer ramp succession allow the definition of depositional sequences of different orders. The trans-gressive and highstand deposits of the studied third-order Upper Kimmeridgian depositional sequence have been differentiated. High-frequency sea-level changes, most probably controlled by orbital cycles in the Milankovitch frequency band (i.e., precession and short eccentricity), were superimposed on the long-term sea-level cycle. As a result, a hierarchical stacking of depositional sequences is observed in the studied section.
The smaller-scale depositional sequences differen-tiated in this work consist of bundles of variable thickness (from 1 to 2 m), formed by 1 to 10 micritic beds. The origin of the bundles has been related to
Fig. 10. Comparison between theHardenbol et al. (1998)chart, and the number of high-order sequences (in tune with the short eccentricity cycle) recorded in the Iberian basin and in the Jura platform(Colombie´, 2002), below and above the middle part of the maximum-flooding zone.
high-frequency sea-level changes controlled by the precession cycle, affecting the carbonate production in the shallow ramp areas. The bundles are bounded by significant omission surfaces that have been related to periods of noncarbonate production in the shallow ramp domains (i.e., emersion of the carbonate-pro-ducing area during periods of high-frequency sea-level fall). Many of the bundles show a lower thin-ning-up interval, indicating a progressive decrease of carbonate exported from the shallow to the deeper ramp areas. The reduction of the exported carbonate may be caused by a decrease of carbonate production on the shallow ramp during periods of high-frequency sea-level rise (drowning).
The most usual expression of the precession cycle in hemipelagic carbonate environments of similar age is the marl – limestone couplet (e.g., Dromart, 1989; Colombie´, 2002). The studied succession consists of well-bedded lime mudstones with occasional marly – limestone interbeddings. This is due to its relative proximity to the shallow carbonate productivity areas (located some 30 km away) and to the limited terri-genous input to the almost pure carbonate sedimentary system. The number of micritic beds in the individual bundles is variable. Abundant coarse-grained tempest-ites are found in age-equivalent micritic beds in the nearby Ricla outcrops (mid-ramp areas,Ba´denas and Aurell, 2001b). The detailed analysis of the distribu-tion of the tempestites in this succession and its correlation with the Aguilo´n succession may give further information about the relationship between storm activity and thickness and number of micritic beds recorded in the individual bundles of the outer-ramp environments.
As a general rule, the thicker bundles are recorded in the long-term transgressive deposits, whereas the long-term highstand deposits show an overall decrease in the thickness of the bundles. The studied succession gives support to the models presented in
Ba´denas and Aurell (2001b)for the Upper Kimmer-idgian carbonate ramp. The larger overall sedimentary rates in the outer ramp settings would correlate to periods of long-term sea-level rise, when the shallow areas of the ramp were flooded and an overall vertical aggradation of reefs took place.
Other depositional sequences recognised in the upper half of the Aguilo´n succession consist of groups of five bundles (sets of bundles). These probably
originated from high-frequency sea-level changes controlled by the short eccentricity cycle. The overall thickness and the stacking pattern observed in the individual sets of bundles are controlled by the long-term sea-level variation:
1. The thicker sets of bundles (5.6 – 8.3 m) are those located at the late transgressive deposits. They show the thinner micritic beds located in their lower or middle parts, indicating a progressive loss in the carbonate exported to outer ramp areas, followed by a stage of larger export of the carbonate produced in shallow areas. The overall carbonate production was high, although the superposition of the high-frequency sea-level rise resulted in the episodic flooding and drowning of the shallow ramp areas.
2. The thinner sets of bundles (2.3 – 5.4 m) are found in highstand deposits. They show a thickening-up and thinning-up trend, indicating that the larger carbonate export took place during the stages of maximum gain in accommodation at the shallow ramp. The overall carbonate production was lower, but increased during the sea-level rises of the high-frequency sea-level cycles.
Acknowledgements
Financial support was provided by DGICYT, Spain (Projects PB98-1260 and PB97-0803) and the EMMI Group (RNM-178, Junta de Andalucı´a). We acknowl-edge the critical reading of the former version of the manuscript by A. Strasser. We are grateful to the two reviewers, T. Aigner and W. Schlager, for their constructive comments.
References
Alonso, A., Mas, J.R., 1990. El Jura´sico superior en el sector Demanda-Cameros (La Rioja-Soria). Cuad. Geol. Ibe´r. 14, 173 – 198.
Alonso, A., Mas, J.R., Mele´ndez, N., 1986. Los arrecifes coralinos del Malm en la Sierra de Cameros (La Rioja, Espan˜a). Acta Geol. Hisp. 21 – 22, 293 – 306.
Allison, P.A., Wignall, P.B., Brett, C.E., 1995. Paleo-oxygenation: effects and recognition. In: Bosence, D., Allison, P.A. (Eds.), Marine Palaeoenvironmental Analysis from Fossils. Geological Society of London, Special Publication, vol. 83, pp. 97 – 112.
Aigner, T., 1985. Storm depositional systems. Dynamic stratigraphy in modern and ancient shallow-marine sequences. Lecture Notes in Earth Sciences. Springer-Verlag, Berlin. 174 pp.
Aurell, M., Ba´denas, B., 1997. The pinnacle reefs of Jabaloyas (Late Kimmeridgian, NE Spain): vertical zonation and associated fa-cies related to sea level changes. Cuad. Geol. Ibe´r. 22, 37 – 64. Aurell, M., Mas, R., Mele´ndez, A., Salas, R., 1994. El tra´nsito
Jura´sico – Creta´cico en la Cordillera Ibe´rica: relacio´n tecto´nica-sedimentacio´n y evolucio´n paleogeogra´fica. Cuad. Geol. Ibe´r. 18, 369 – 396.
Aurell, M., Bosence, D.W.J., Waltham, D.A., 1995. Carbonate ramp depositional systems from a late Jurassic epeiric platform (Iber-ian basin, Spain): a combined computer modelling and outcrop analysis. Sedimentology 42, 75 – 94.
Aurell, M., Ba´denas, B., Bosence, D.W.J., Waltham, D.A., 1998. Carbonate production and offshore transport on a Late Jurassic carbonate ramp (Kimmeridgian, Iberian basin, NE Spain): evi-dence from outcrops and computer modelling. In: Wright, V.P., Burchette, T.P. (Eds.), Carbonate Ramps. Geological Society of London, Special Publication, vol. 149, pp. 137 – 161. Aurell, M., Mele´ndez, G., Olo´riz, F., Ba´denas, B., Caracuel, J.,
Garcı´a-Ramos, J.C., Goy, A., Linares, A., Quesada, S., Robles, S., Rodrı´guez-Tovar, F.J., Rosales, I., Sandoval, J., Sua´rez de Centi, C., Tavera, J.M., Valenzuela, M., 2002. Jurassic. In: Gib-bons, W., Moreno, T. (Eds.), The Geology of Spain. Geological Society, London, pp. 213 – 254.
Ba´denas, B., Aurell, M., 2001a. Kimmeridgian palaeogeography and basin evolution of northeastern Iberia. Palaeogeogr. Palae-oclimatol. Palaeoecol. 168, 291 – 310.
Ba´denas, B., Aurell, M., 2001b. Proximal – distal facies relationship and sedimentary processes in a storm dominated carbonate ramp (Kimmeridgian, northwest of the Iberian Ranges, Spain). Sedi-ment. Geol. 139, 319 – 342.
Berger, A., Loutre, M.F., Dehant, V., 1989. Milankovitch frequen-cies for pre-Quaternary. Nature 342, 133.
Berger, A., Loutre, M.F., Laskar, J., 1992. Stability of the astro-nomical frequencies over the Earth’s history for paleoclimate studies. Science 255, 560 – 566.
Boylan, A., Waltham, D.A., Bosence, D.W.J., Ba´denas, B., Aurell, M., 2002. Digital rocks: linking forward modelling to carbonate facies. Basin Res. 14, 401 – 415.
Bromley, R.G., Ekdale, A.A., 1984. Chondrites: a trace fossil indicator of anoxia environments in sediments. Science 244, 872 – 874.
Burchette, T.P., Wright, V.P., 1992. Carbonate ramp depositional systems. Sediment. Geol. 79, 3 – 57.
Colombie´, C., 2002. Se´dimentologie, stratigraphie se´quentielle et cyclostratigraphie du Kimme´ridgien du Jura suisse et du Bassin vocontien (France): relations plate-forme-bassin et facteurs de´-terminants. PhD Thesis. Univ. de Fribourg. 201 pp.
Corte´s, A.L., Liesa, C.L., Soria, A.R., Mele´ndez, A., 1999. Role of extensional structures on the location of folds and thrusts during tectonic inversion (northern Iberian Chain, Spain). Geodin. Acta 12, 113 – 132.
Delvene, G., 2001. Los bivalvos del Jura´sico medio y superior de la Cordillera Ibe´rica (Espan˜a): sistematica y paleoecologia. PhD Thesis. University of Zaragoza, 199 pp.
Dromart, G., 1989. Deposition of upper Jurassic fine-grained lime-stones in the western subalpine basin, France. Palaeogeogr. Pa-laeoclimatol. Palaeoecol. 69, 23 – 43.
Einsele, G., Ricken, W., 1991. Limestone – marl alternation—an overview. In: Einsele, G., Ricken, W., Seilacher, A. (Eds.), Cycles and Events in Stratigraphy. Springer-Verlag, Berlin, pp. 23 – 47.
Fischer, A.G., 1991. Orbital cyclicity in Mesozoic strata. In: Ein-sele, G., Ricken, W., Seilacher, A. (Eds.), Cycles and Events in Stratigraphy. Springer-Verlag, Berlin, pp. 48 – 62.
Giraud, F., Beaufort, L., Cotillon, P., 1995. Controˆle astronomi-que de la se´dimentation carbonate´e dans le Cre´tace´ infe´rieur du Basin vocontien (SE France). Bull. Soc. Geol. Fr. 166, 409 – 421.
Gradstein, F.M., Agterberg, F.P., Ogg, J.G., Hardenbol, J., van Veen, P., Thierry, J., Huang, Z., 1994. A Mesozoic time scale. J. Geophys. Res. 99, 24.051 – 24.074.
Gygi, R.A., Coe, A.L., Vail, P.R., 1998. Sequence stratigraphy of the Oxfordian and Kimmeridgian stages (Late Jurassic) in north-ern Switzerland. In: De Gracianski, P.C., Hardenbol, J., Jacquin, T., Vail, P.R. (Eds.), Mesozoic and Cenozoic Sequence Stratig-raphy of European Basins. SEPM (Society for Sedimentary Geology) Special Publication, vol. 60, pp. 527 – 544. Hardenbol, J., Thierry, J., Farley, M.B., Jacquin, T., De Gracianski,
P.C., Vail, P.R., 1998. Mesozoic and Cenozoic sequence chro-nostratigraphic framework of European basins. In: De Gracian-ski, P.C., Hardenbol, J., Jacquin, T., Vail, P.R. (Eds.), Mesozoic and Cenozoic Sequence Stratigraphy of European Basins. SEPM (Society for Sedimentary Geology) Special Publication, vol. 60. Charts 1 – 8.
Harland, W.B., Armstrong, R.L., Cox, A.V., Craig, L.E., Smith, A.G., Smith, D.G., 1990. A Geologic Time Scale 1989. Cam-bridge Univ. Press, CamCam-bridge. 265 pp.
Kendall, C.G., Schlager, W., 1981. Carbonates and relative changes in sea level. Mar. Geol. 44, 181 – 212.
Leinfelder, R.R., 1993. A sequence stratigraphic approach of the Upper Jurassic mixed carbonate – siliciclastic succession of the central Lusitanian Basin, Portugal. Profil 5, 119 – 140. Milliman, J.D., Freile, D., Steinen, R.P., Wilber, R.J., 1993. Great
Bahama Bank aragonitic muds: mostly inorganically precipi-tated, mostly exported. J. Sediment. Petrol. 63, 589 – 595. Montan˜ez, I.A., Osleger, D.A., 1993. Parasequence stacking
pat-terns, third-order accommodation events, and sequence stratig-raphy of Middle to Upper Cambrian platform carbonates, Bonanza King Formation, Southern Great Basin. In: Loucks, R.G., Sarg, J.F. (Eds.), Carbonate Sequence Stratigraphy—Re-cent Developments and Applications. Am. Assoc. Petrol. Geol. Memoir, vol. 57, pp. 305 – 326.
Olo´riz, F., Rodrı´guez-Tovar, F.J., 1998. Multifactorial control on deposition of epicontinental hemi-pelagic carbonates during the earliest Kimmeridgian (Prebetic Zone, southern Spain). Sediment. Geol. 119, 123 – 139.
Olo´riz, F., Rodrı´guez-Tovar, F.J., Chica-Olmo, M., Pardo, E., 1992. The marl – limestone rhythmites from the Lower Kimmeridgian (Platynota Zone) of the central Prebetic and their relationship with variations in orbital parameters. Earth Planet. Sci. Lett. 111, 407 – 424.
Pardo-Igu´zquiza, E., Chica-Olmo, M., Rodrı´guez-Tovar, F.J., 1994. CYSTRATI: a computer program for spectral analysis of strati-graphic successions. Comput. Geosci. 20, 511 – 584.
Pardo-Igu´zquiza, E., Schwarzacher, W., Rodrı´guez-Tovar, F.J., 2000. A library of computer programs for assisting teaching and research in cyclostratigraphic analysis. Comput. Geosci. 26, 723 – 740.
Pasquier, J.B., Strasser, A., 1997. Platform-to-basin correlation by high-resolution sequence stratigraphy and cyclostratigraphy (Berriasian, Switzerland and France). Sedimentology 44, 1071 – 1092.
Pittet, B., Strasser, A., 1998. Depositional sequences in deep-shelf environments formed through carbonate mud import from shal-low platform (Late Oxfordian, German Swavian Alb and eastern Swiss Jura). Eclogae Geol. Helv. 91, 149 – 169.
Pittet, B., Strasser, A., Mattioli, E., 2000. Depositional sequences in deep-shelf environments: a response to sea-level changes and shallow-platform carbonate productivity (Oxfordian, Germany and Spain). J. Sediment. Res. 70, 392 – 407.
Salas, R., 1989. Evolucio´n estratigra´fica secuencial y tipos de pla-taformas de carbonatos del intervalo Oxfordiense – Berriasiense en las Cordilleras Ibe´rica Oriental y Costero Catalana Meridion-al. Cuad. Geol. Ibe´r. 13, 121 – 157.
Savrda, C.E., Bottjer, D.J., 1986. Trace fossil model for reconstruc-tion of paleo-oxygenareconstruc-tion in bottom waters. Geology 14, 3 – 6.
Schlager, W., Reijmer, J.J.G., Droxler, A., 1994. Highstand shed-ding on carbonate platforms. J. Sediment. Petrol. 64, 270 – 281. Schwarzacher, W., 1975. Sedimentation models and Quantitative Stratigraphy. Developments in Sedimentology, vol. 19. Elsevier, Amsterdam. 382 pp.
Schwarzacher, W., 1993. Cyclostratigraphy and the Milankovitch theory. Developments in Sedimentology, vol. 52. Elsevier, Amsterdam. 225 pp.
Schwarzacher, W., Fischer, A.G., 1982. Limestone – shale bedding and perturbations of the Earth’s orbit. In: Einsele, G., Seilacher, A. (Eds.), Cyclic and Event Stratification. Springer-Verlag, Ber-lin, pp. 72 – 95.
Strasser, A., Pittet, B., Hillga¨rtner, H., Pasquier, J.B., 1999. Depo-sitional sequences in shallow carbonate-dominated sedimentary systems: concepts for a high-resolution analysis. Sediment. Geol. 128, 201 – 221.
Taylor, S.P., Sellwood, B.W., Gallois, R.W., Chambers, M.H., 2001. A sequence stratigraphy of the Kimmeridgian and Bolonian stages (Late Jurassic): Wessex – Weald Basin, southern England. J. Geol. Soc. (Lond.) 158, 179 – 192.
Weedon, G.P., 1991. The spectral analysis of stratigraphic time ser-ies. In: Einsele, G., Ricken, W., Seilacher, A. (Eds.), Cycles and Events in Stratigraphy. Springer-Verlag, Berlin, pp. 840 – 854.