Publisher’s version / Version de l'éditeur:
Review of Scientific Instruments, 63, 12, pp. 5556-5564, 1992
READ THESE TERMS AND CONDITIONS CAREFULLY BEFORE USING THIS WEBSITE. https://nrc-publications.canada.ca/eng/copyright
Vous avez des questions? Nous pouvons vous aider. Pour communiquer directement avec un auteur, consultez la première page de la revue dans laquelle son article a été publié afin de trouver ses coordonnées. Si vous n’arrivez pas à les repérer, communiquez avec nous à PublicationsArchive-ArchivesPublications@nrc-cnrc.gc.ca.
Questions? Contact the NRC Publications Archive team at
PublicationsArchive-ArchivesPublications@nrc-cnrc.gc.ca. If you wish to email the authors directly, please see the first page of the publication for their contact information.
NRC Publications Archive
Archives des publications du CNRC
This publication could be one of several versions: author’s original, accepted manuscript or the publisher’s version. / La version de cette publication peut être l’une des suivantes : la version prépublication de l’auteur, la version acceptée du manuscrit ou la version de l’éditeur.
Access and use of this website and the material on it are subject to the Terms and Conditions set forth at
An improved CARS spectgrometer for single-shot measurements in
turbulent combustion
Snelling, D. R.; Sawchuk, R. A.; Smallwood, G. J.; Parameswaran, T.
https://publications-cnrc.canada.ca/fra/droits
L’accès à ce site Web et l’utilisation de son contenu sont assujettis aux conditions présentées dans le site LISEZ CES CONDITIONS ATTENTIVEMENT AVANT D’UTILISER CE SITE WEB.
NRC Publications Record / Notice d'Archives des publications de CNRC:
https://nrc-publications.canada.ca/eng/view/object/?id=324574fd-6bbd-49bd-81fc-36e8e85d9b02 https://publications-cnrc.canada.ca/fra/voir/objet/?id=324574fd-6bbd-49bd-81fc-36e8e85d9b02An improved CARS spectrometer
for single-shot measurements
in turbulent combustion
D. I?. Snelling, R. A. Sawchuk, and G. J. Smallwood
National Research Council of Canada, institute of Mechanical Engineering, Ottawa, Ontario KIA OR6, Canada
T. Parameswaran
Atlantis Scientific, 1827 Woodward Drive, Ottawa, Ontario K2C OP9, Canada
(Received 14 May 1992; accepted for publication 23 July 1992)
A broadband coherent anti-Stokes Raman spectroscopy (CARS) system optimized for single shot measurements in turbulent flames is described. The CARS spectrometer incorporates an intensified photodiode array (IPDA) with a P46-phosphor based intensifier that is shown to have an order of magnitude less image persistence than P20-phosphor based IPDAs, and thus largely eliminates the temperature errors that can result from this image persistence. The low and high signal nonlinearity of IPDAs incorporating both P20 and P46 phosphor based intensifiers is described. The CARS signal is dispersed with a single element concave holographic diffraction grating, which is fiber-optically coupled. To provide the necessary dynamic range
(approximately 1OOO:l) to handle CARS spectra whose temperatures can vary from 300 K to adiabatic flame temperatures a fiber-optic splitter was employed and the nonlinearity of the IPDA detectors was characterized. A method of determining the nonlinearity was developed that was convenient and the fiber-optic link was shown to provide a stable calibration of this nonlinearity. The problem of dye laser spectral drift, which is particularly severe in a long duration experiment, was addressed by constructing a compact high resolution spectrometer to continuously monitor the dye laser. The dye laser center frequency was maintained constant by manually adjusting an intracavity tuning filter. The accuracy of this technique and its effect on CARS derived temperatures was evaluated. The standard method of determining the instrument function by fitting to ,295 K air spectra was compared to other methods and its use was shown to result in an uncertainty of less than 0.5% in CARS derived temperatures. The operation of this CARS instrument was demonstrated in a turbulent diffusion flame. The varying composition in these flames was accounted for by fitting C, the ratio of the nitrogen mole fraction to the total third order nonlinear susceptibility.
1. INTRODUCTION
Coherent anti-Stokes Raman scattering (CARS) has emergedim as a powerful technique for measuring temper- ature and major species concentrations in reactive media. Temperature measurements in air-fed combustion are most commonly performed using CARS spectra of N,, which is present in large concentrations.
In turbulent combustion media the single-shot capabil- ity of broadband CARS4 must be employed to avoid the biasing that would result from using averaged CARS spec- tra. These averaged spectra would be heavily weighted to- wards the high-density low-temperature fluctuations be- cause of the, approximately, square dependence of the CARS intensity on species number density. In sampling a turbulent flame with single-shot broadband CARS it is es- sential that no biasing be induced due to selective recording of CARS spectra based on intensity. Since, in constant pressure combustion, the peak CARS signal can decrease by approximately 1000 as the temperature increases from room temperature to adiabatic flame temperatures this places great demands on the dynamic range of the detector. This problem is compounded by the nonlinearities that have been found5-lo in the intensified photodiode array (IPDA) detectors.
To increase the dynamic range of an IPDA Goss et al.’ employed a beam-splitter arrangement to image four dif- ferent CARS beams representing different fractions of the CARS signal. Eckbreth” describes a single-component op- tical splitter that was incorporated into the spectrograph directly before the IPDA. This approach is simpler than the external beam splitters used by Goss et al. but suffers from somewhat degraded image quality in the multiply reflected secondary beam. In this paper we describe a fiber- optic splitter that is convenient to use and allows us to maintain a more stable calibration of IPDA detector non- linearity than was possible using a CARS beam directly coupled into a spectrometer.
IPDA detectors incorporating P-20 phosphor based in- tensifiers have been showr?’ to exhibit marked image per- sistence (lag). For a typical 10 Hz CARS experiment the image persistence is 0.5%-4% of the average signal, the bulk of which results from laser pulses prior to the preced- ing one. This image persistence results in a CARS spec- trum that contains contributions from many previous pulses. In turbulent combustion the contributions wilI be much larger from the cooler, more intense, spectra, This can result in large negative temperature errors in fitting the
5556 Rev. Sci. Instrum. 63 (IZ), December 1992 00346746/92/125556-09$02.00 6556
resultant CARS spectra’ although strategies have been de- veloped to minimize the effect.12
Dye laser spectral drift during an experiment is a com- mon problem in CARS N2 thermometry. The resonant N2 CARS spectra are divided by a nonresonant reference spec- trum that calibrates the CARS spectrometer for the spec- tral profile of the dye laser, and other instrumental vari- ables. It is frequently experimentally difficult to substitute a nonresonant cell for the combustion source, thus nonres- onant reference spectra are typically recorded at the begin- ning and end of an experiment. A shift in the dye laser spectrum, which during a long experiment is quite com- mon, results in an uncertain calibration with consequent errors in temperature. In our experiments, the dye laser output is continuously monitored and its center frequency is maintained constant by manually tuning an intracavity filter in the dye laser oscillator.
In diffusion flames the varying compositions encoun- tered influence the shape of the N2 CARS spectrum and, hence, the temperatures derived from them. Two ap- proaches have been taken to solving this problem. Hall and Boedeker13 evolved a method of using the quantity C, de- fined as the ratio of the mole fraction of N2 to the total nonresonant susceptibility, as a fit parameter. This can largely correct for the effect of varying composition and uncertainties in the nonresonant susceptibility. Altema- tively, the background contribution from the nonresonant susceptibility can be canceled out by proper selection of the polarization orientation of the laser beams and the CARS signal optics.” This background suppression (see, for ex- ample, Ref. 15 for a discussion) is attained only with a factor of 16 reduction in the CARS signal and a conse- quent approximately fourfold reduction in spatial resolu- tion (to maintain the same CARS signal). We have elected to analyze CARS spectra that include the nonresonant contribution by fitting C. However, it remains to be dem- onstrated that this approach will give unique solutions when performing multiparameter fits on noisy single-shot CARS spectra as opposed to fitting the relatively noise-free multipulse averaged CARS spectra.
A potential source of error in CARS N, thermometry is the population of higher vibrational levels of N, by stim- ulated Raman pumping. Even with a broadband CARS system, with its lower spectral intensity, these saturation effects can create problems.9~‘0*‘6~17 The strength of the u
= 1 - v = 2 band in CARS spectra of room temperature N, (where the population of the N, (v= 1) level results from stimulated Raman pumping) can be used as semiquantita- tive guide to error-free laser energy levels.’
In this paper we describe a CARS spectrometer, and its operation to record and analyze N2 CARS spectra, that has been optimized to study turbulent flames. Various im- provements to the CARS system such as: a fiber-optic split- ter to increase the dynamic range, an echelle grating spec- trometer to continuously monitor the dye laser, and a fast- phosphor intensified photodiode array detector (IPDA) are described.
5557 Rev. Scl. Instrum., Vol. 63, No. 12, December 1992
II. CARS THEORY AND DATA REDUCTION
The accuracy of CARS-derived temperatures is ulti- mately determined by the synthetic theoretical spectra used for the analysis of the data. The theoretical models and the computer program used to calculate the synthetic CARS spectra and fit experimental CARS spectra have been described in some detai19*‘* and will be briefly sum- marized here.
The CARS theory code includes the cross-coherence effect due to a finite pump laser bandwidth’9’20 and colli- sional narrowing resulting from the overlap of the Lorent- zian profiles of the Raman lines at higher pressure.21 At higher temperatures, where Doppler broadening is more significant, a Voigt profile describes the lineshape more accurately. At atmospheric pressure and for temperatures above 1500 K Doppler broadening may play a more im- portant role than collisional narrowing.’ A Voigt profile, using the complex error function approximation, can be used to calculate theoretical CARS spectra for these con- ditions. In the Doppler broadened and the pressure broad- ened regimes cross coherence effects can be accounted for.18 In our CARS work we have employed each of the two models separately according to the medium condi- tions.
The instrument spectral response is described by an approximate asymmetric, Voigt function22 to which terms that decay as the reciprocal of the frequency displacement were added. The instrument function has a maximum of six parameters, which can be optionally simplified by as- suming a symmetric Voigt, or by ignoring the reciprocal frequency terms. The library of theoretical CARS spectra is then convolved with this instrument function.
To fit experiment to theory a nonlinear-least-mean- squares-fitting program was used that was based on the Gauss-Newton algorithm as adapted by Kim.23 To ensure convergence, the Marquardt modification24 was incorpo- rated into the program as a fitting option.
In an experiment CARS spectra for the background (dye laser blocked), room temperature N2, nonresonant reference, and flame were recorded. The resonant N2 CARS spectra had the background subtracted (to remove the effect of fixed pattern signal in the detector) and were then divided by the nonresonant reference spectrum. The instrument function was routinely determined by fitting the 295 K N2 spectra using the Voigt instrument function de- scribed above. The accuracy of this technique was verified by comparing this instrument function to those obtained from hot spectra or from the 472.7 nm Ar-ion laser line. These results are described in Sec. III C.
Ill. EXPERIMENTAL TECHNIQUE AND PERFORMANCE A. Experimental summary
The layout of the CARS spectrometer is shown in Fig. 1. The pump laser is a frequency-doubled Nd:YAG (Quanta Ray DCR 2A) operating at 10 Hz with the elec- tronic line narrowing (ELN) option. With the ELN option disabled, the laser bandwidth was 0.67*0.10 cm-’ [full width at half-maximum (FWHM)] without the etalon in
FIG. 1. Schematic of CARS system. Abbreviations are as follows: 2 XXTL, frequency doubling crystals; BS, beam splitter; CFL & CCL, CARS focusing and collimating lenses; CHG, concave holographic dif- fraction grating; D, beam dump; DB, dichroic beam splitter; DC, dye cell; E, echelle grating; FS, fiber optic splitter; GT, Gallilean telescope; HWP, half-wave plate; IPDA, intensified photodiode array detector; L, lens; M, mirror; OF, optical fiber; Pl, prism; PDA, photodiode array detector; PM, photomultiplier; TF, tuning filter; TR, total reflector.
the cavity, and 0.22 *0.04 cm-’ with the etalon. The bandwidths were measured by fitting a Gaussian profile to the fringe pattern recorded from a Fabry-Perot etalon.25
The broadband Stokes radiation is generated by a dye laser oscillator with a single amplifier. Both the oscillator and amplifier sections use a common dye cell that is en- closed by two quartz windows and is installed at the Brew- ster angle. The windows are 9.5 mm thick and their inside surfaces are 9.5 mm apart. The dye oscillator is iongitudi- nally pumped (pump axis is inclined 7” relative to the dye oscillator lasing axis) by -20 mJ of 532 nm radiation, which is focused into the dye cell with a 750 mm focal length lens. The dye cell is approximately 550 mm from the focus resulting in a pump beam size of - 1.5 mm. The laser cavity is made up of a total reflector and partial reflector
( -20% reflectivity) that is coated on one half of the hy- potenuse face of a right angle prism. The other half of this face has a broadband antireflection coat and the prism serves to turn the oscillator beam through 180” and return it to the dye cell where it is amplified by pumping with 50 mJ of 532 nm radiation with essentially the same geometry as the oscillator section. The total output of the dye laser is 20 mJ.
Originally the dye center wavelength was tuned by varying the dye concentration. The concentration was typ- ically 2.6X lop4 M rhodamine 640 perchlorate. A more convenient method of tuning was to insert a bandpass filter in the dye cavity. The filter, which was centered at 610 nm and had a width of 9.5 nm (FWHM), was typically set at 15” off normal to obtain a dye laser center wavelength of 606 nm. The center frequency could be varied by angle tuning the filter.
A small fraction of the dye laser output was sent to a dye laser spectrometer, The collimated dye laser beam was incident on an echelle grating that had a groove spacing of 0.0127 mm and a blaze angle of 75”. The dispersed spec- trum was focused on to a 1024 element unintensified silicon
5558 Rev. Sci. Instrum., Vol. 63, No. 12, December 1992
photodiode array (Princeton Instruments model PDA 1024, array length 25.4 mm) with a lens of 400 mm focal length. The dye laser spectrometer was calibrated using the all-lines output of an Ar-ion laser. At 607 nm the spec- trometer operated in the 39th order of the grating with a measured dispersion of 0.19 cm-*/diode and a resolution of 1.3 cm-’ ( q e uivalent full width). The resolution and dispersion values were approximately 2/3 those of the CARS spectrometer.
Gallilean telescopes were incorporated into the pump and Stokes beams to control the beam diameter and focal spot location. The pump and Stokes laser
telescopes pro-
vided magnifications of 0.9 and 2.5, respectively.
To generate the CARS beam a folded BOXCARS26 phase matching geometry is used with a lens focal length of 300 mm and a total pump laser energy of 50 mJ. The BOXCARS half-angle is 1.6”. Part of the recollimated CARS beam was split off and focused into a 100 pm core fused silica fiber. The output intensity of the fiber was mon- itored by a Hammamatsu R1477 photomultiplier con- nected to a boxcar integrator. This provided a stable ref- erence signal that could be used in aligning the system. The remaining CARS radiation was focused into a fluorine doped fused silica step index fiber with diameters of 80 pm (core) and 125 (Irn (cladding), and a numeric
aperture
(NA) of 0.12 (Superguide, manufactured by Fiberguide). The output end of the fiber was the source for a
spectrom-
eter employing a concave holographic diffraction grating (American Holographics) , which imaged a dispersed CARS spectrum. This primary spectrum was imaged at 2: 1 magnification onto an IPDA detector using a 50 mm focal length f/l. 1 Nikon lens. The 20-cm-diam grating had a groove density of 2000 grooves/mm and a focal length of 800 mm. The fiber optic was terminated with a splitter that provided for dual fiber input to the grating. The various splitters employed are described in Sec. III C.
The grating reflected about a third of the input radia- tion into the zero order. This radiation was focused onto a Hammamatsu R1477 photomultiplier whose amplified out- put was monitored by a sample-and-hold circuit. The out- put of the sample-and-hold was digitized [64 k analog-to- digital converter (ADC) counts] by the IPDA
controller
and stored as the 1025th element. This provided a monitor of the total undispersed CARS signal.
B. intensified photodiode array (IPDA) detector image persistence and low-signal Bevel nonlinearity
The IPDA detectors employing P20-phosphor-based intensifiers that have been used in CARS spectroscopy ex- hibit marked image persistence. The image persistence is measured by interrupting a pulsed laser exposure and mea- suring the remaining signal in the period immediately fol- lowing the cessation of lasing. This image persistence is expressed as a percentage of the average signal level before interruption of the laser. The image persistence for two P-20 phosphor based IPDAs (from Ref. 8) is shown in Fig. 2. This image persistence was minimized by optimiz- ing the scan pattern of the detector, which is also shown in Fig. 2. Each detector scan is represented by a square wave
CARS spectrometer 5558
iEan
Read z!=” t=O ins t t-2 ms I Laser tt4 00 Ins P”h 1 ti s E t? 2 co iif 01 .E . a9 0.01 0 1 2 3 4 5 6 7 8 9 10 Read Cycles (100 ms periods) Following Last ExposureFIG. 2. Image persistence for two PZO-phosphor-based IPDAs (a Tracer Northern model TN-6132 and a Princeton Instruments model PI-1024- YI) and a P46-phosphor-based IPDA specifically developed to have re- duced image persistence (a model PI-1024-YI manufactured by Princeton Instruments). The image persistence is that observed following an inter- rupted IO Hz exposure. The detector scan pattern, which is shown, was optimised for minimum image persistence in the read scan.
pulse where only the read scan was digitized and stored. For the detector clean scans the accumulated signal was removed from the detector but it was not digitized. The read scan was initiated 5 to 6 ms after the laser pulse so that the exposure period of an individual diode (following the last clean scan) was 11-12 ms.
The bulk of the image persistence for the P20 IPDAs was shown’ to result from laser pulses other than the pre- ceding one. The image persistence is an increasing fraction of signal as the signal level decreases.8*12 This image per- sistence results in a CARS spectrum that contains contri- butions from many previous laser pulses. In turbulent com- bustion these image persistence contributions will be much larger from the cooler, more intense spectra, resulting in potentially large negative temperature errors in fitting the resultant CARS spectra.97’2 An algorithm to correct CARS spectra for the image persistence effects of the previous laser pulse was reported by Boyack et al. l2 However, be- cause of the slow decay of the image persistence, this only represents an approximate solution.
With the assistance of one of the IPDA manufacturers a detector with a much lower image persistence that is more suitable for single-shot CARS spectroscopy was de- veloped. The image persistence of this detector, which has a P46 phosphor, is shown in Fig. 2. For this detector the image persistence in the first detector scan period following interruption of the signal is ten times less than the best PZO-phosphor-based detector. Furthermore, the subse-
0 PI-1 024-YI P20 Phosphor W TN-61 32 P20 Phosphor + PI-1 024-YI P46 Phosphor
1 .l h as 1.0 C % c/Y 8 0.9 ii 5 n 0.8 2 ..?! TN-81 32 P20 PHOSPHOR PI-, 024-YI P20 PHOSPHOR + PI-, 02GYI ~46 PHOSPHOR 0.64 j “““’ ’ a ‘s”“’ ’ * “““’ ’ ’ l’“”
10 100 1000 1 01
Detector Output ADC Counts IO
FIG. 3. Relative sensitivity of two P20-phosphor-based IPDAs (a Tracer Northern model TN-6132 and a Princeton Instruments model PI-1024- YI) exhibiting low-signal nonlinearity and a P46 phosphor based IPDA
(a model PI-1024-YI manufactured by Princeton Instruments) showing its low-signal linearity.
quent decay of the signal is much faster. The P46 detector sensitivity [with the noise set to 1 count root mean square
(rms)] was 4.5 photons/count at 500 nm. This value is comparable to the P20 detectors we have measured (4.9, 3.4, 3.9, 3.5 photons equivalent rms noise). Thus a reduc- tion in image persistence of at least a factor of 10 has been realized with no reduction in detector sensitivity.
An additional advantage is that the P46-phosphor- based detectors exhibit none of the low-signal nonlinearity associated with the P20 phosphor IPDAs.~~‘~~~~ Figure 3 shows the relative sensitivity (detector output in counts divided by relative light level normalized to 1.0 at high signal levels) of two P20-phosphor detectors and the P46- phosphor detector. (The data for the TN-6132 detector was taken from Ref. 8.) Within experimental error the PI-1024-YI-P46 detector shows no falloff in sensitivity at low signal levels, as is exhibited by P20 phosphor based detectors. The low-signal nonlinearity of the P20-based IPDAs, which have almost universally been used in CARS spectroscopy, has gone unrecognized in much of the earlier CARS work. Applying a correction for detector low-signal nonlinearity results in best-fit CARS temperatures that are 50-100 K hotter in the range of 1500-2000 K.9*‘o
C. CARS spectrometer and fiber optic splitter
The imaging of the concave holographic grating spec- trometer was evaluated using an Ar-ion laser. The Ar-ion laser beam was focused into a 50 ,um core optical fiber and the output tip of the fiber, imaged at a 5:l reduction, pro- vided an input to the spectrometer. The spatial dependence of the input and the dispersed image were evaluated using a scanning knife edge. The input focal spot size corre- sponding to the central 80% of the intensity was 24 pm.
The image width (in the dispersion plane) and image height are shown in Fig. 4 for the primary image, i.e., 5559 Rev. Sci. instrum., Vol. 63, No. 12, December 1992 CARS spectrometer 5559
5.0 4.5 4.0 t z 3.5 E - 3.0 2 .P a, 2.5 I g) 2.0 ca + 1.5 1 .o 0.5 0.0 ;
9 Image Height (central 50%) Image Height (central 30%) 0
4 Image Width (central 50%) Image Width (central 30%)
10
0
-470 480 490 500
Wavelength (nm)
FIG. 4. Spectral dependence of the imaging characteristics of an f/4.5 holographic concave diffraction grating. The diffraction grating, which was manufactured by American Holographics, was designed to efficiently couple light from a fiber-optic input. Spectral positions of CARS signals (for a 532 nm pump beam) are also indicated for some combustion species.
without the 2:l expansion provided by the lens in the CARS spectrometer. It can be seen that the grating has excellent imaging characteristics at the design wavelength of 488 nm. However, the grating is highly chromatic, and as a result the image height exceeds that of the IPDA detector pixel as little as 15-20 nm from the design wave- length. With the 2:l image expansion employed in CARS spectrometer the useful spectral range of the grating is further reduced because of loss in signal due to overfilling of the pixel. At the Nz CARS wavelength (473 nm) the expanded image largely fills the 2.5 mm pixel height.
The grating is suitable for CARS spectra of N, (473.3 nm), CO (477.5 nm), or O2 (4,91.3 nm) and, perhaps with some losses, for COz (496.7 nm) . For H,O CARS spectra (445.5 nm) the losses due to overfilling the detector would be unacceptable. The image widths in Fig. 4 show that the resolution of the grating image ( -20 ,um) is better than that of the IPDA (approximately 2 pixels or 50 pm). For that reason it was decided to incorporate the 2:l image expansion lens shown in Fig. 1 to provide a better match between the grating resolution and the IPDA resolution.
To increase the dynamic range of our CARS spectrom- eter we evaluated several fiber-optic splitters that provided a dual input to the spectrometer. All these splitters were made from the same generic Superguide fibers described in the experimental section. The first splitters were made from 80 pm core/125 pm cladding fiber. Both fused (fixed splitting ratio) and evanescent wave (variable splitting ra- tio) devices were fabricated that consisted of an input length of 20-30 m followed by a splitter with a nominal 1O:l splitting ratio, with output arms of - 1 m. The ad-
5560 Rev. Sci. Instrum., Vol. 63, No. 12, December 1992
1 / 1, I, 3 I I I I $ s I, I I +
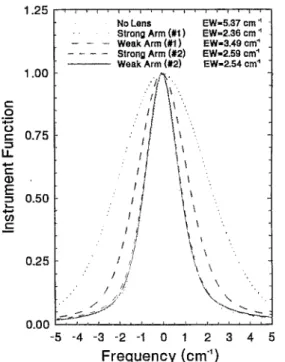
No Lens EW-5.37 cm * Strong Arm (#I) EW-2.36 cm ’ --- Weak Arm (#‘I ) EW=3.49 cm’ ---- Strong Arm (X2) EW-2.59 cm’ - Weak Arm (X2) EW-2.54 cm' 1.25 1 .oo s ‘;: 2 0.75 12 E !i d50 I . z 5 0.25 0.00 -5 -4 -3 -2 -1 0 1 2 3 4 5 Frequency (cm.‘)
FIG. 5. The observed instument function (the spectral response of the CARS spectrometer to a monochromatic input) for both the weak and strong arm inputs of two fiber optic splitters with a 2X image expansion lens incorporated in the spectrometer. The dotted curve represents the instrument function observed in a spectrometer with an identical grating and fiber-optic input but no expansion lens. The equivalent width (EW) is the width of a rectangle having the same peak height and area as the instrument function.
vantage of variable splitting ratio from the evanescent wave coupler was offset by its greater fragility and susceptibility to damage. Furthermore, this splitter was fabricated from an early sample of Superguide fiber that had losses of 3%/ m (at 488 nm) rather than <1%/m typical of later batches. The evanescent wave coupler itself had a loss (in addition to loss in the fiber) of approximately 15%. The best of the fused splitters, which were manufactured by Canstar, had a throughput (after correcting for reflection losses) of 74.4% and 6.1% in the two arms (ail transmis- sions are given at 488 nm unless otherwise stated). Ab- sorption in the fiber and losses in the splitter account for the remaining 20%.
The performance of the spectrometer was evaluated by recording 295 K air spectra and fitting them to obtain the instrument functions, which are shown in Fig. 5. The equivalent width (EW) of these instrument functions (the width of a rectangle having the same peak height and total area), which is also given, provides a convenient measure of the resolution. An instrument function obtained from a spectrometer with an 80 pm core fiber input but no 2:i image expansion lens’* is also shown in Fig. 5.
Two conclusions can be drawn from an examination of Fig. 5. First, the weak arm of fiber splitter No. 1 has mark- edly poorer resolution than the strong arm (attempts to improve the resolution by systematically varying the posi- tion of the fiber tip failed). Second, the resolution of the strong arm of splitter No. 1 (2.36 cm-‘) was markedly superior to that of the spectrometer with no image expan-
CARS spectrometer 5560
sion (5.37 cm-‘). Thus, it is clear that a 2:l image expan- sion provides a significant improvement in performance.
A visual examination of the output of the weak arm using an Ar-ion laser showed that there was a tendency of the intensity profile to be annular. It was initially con- cluded that this resulted from excitation of cladding modes, i.e., light coupled into the cladding whose trans- mission is supported by the cladding-buffer interface. How- ever, the index of refraction of the silicone buffer is such that it does not support cladding modes. An alternative explanation is that the splitter may act to couple the higher order modes into the weak arm, and these modes have the annular intensity profile observed.
Loss of resolution in the weak arm of the splitter is particularly serious, since it is this signal that must be used to analyze the low-temperature high-intensity CARS spec- tra. The lack of a hot band in these spectra means that the temperature must be deduced from the width of the v= 1
-0 band, thus requiring high resolution. It was decided to manufacture a second group of fused splitters where the weak arm would be made of 50 pm core/125 ,um cladding fiber while the rest of the splitter was made of larger di- ameter fiber (both 80/125 and 100/140 pm fibers were used). The transmission at 488 nm of this second group of splitters was equal to or better than those made from a single size of fiber. Correcting for reflection losses the total transmission (splitter plus approximately 20 m of input fiber) of the splitters made from 80 to 50 pm core fibers was 74% to 78% with a nominal 1O:l splitting ratio. The transmission of the splitters made with 100 and 50 pm core fibers was slightly better (80%-86%) with a range (6: 1 to
17:l) of splitting ratios.
One of the 80 pm core splitters (splitter No. 2 in Fig. 5) was installed in the spectrometer and the instrument function evaluated. The equivalent width of the strong arm of this splitter was 2.59 cm-‘, or - 10% greater than split- ter No. 1. However, the equivalent width of the weak arm of splitter No. 2 (2.54 cm-‘) was 27% less than splitter No. 1 (see Fig. 5 for instrument functions) indicating the improvement in performance resulting from the use of the smaller core fiber in the weak arm. This fiber splitter is now permanently incorporated into the CARS spectrometer.
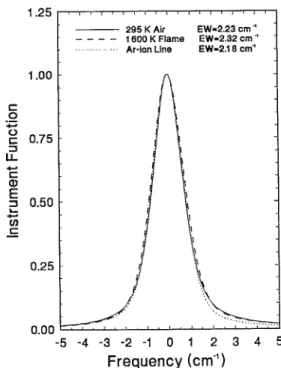
Three methods for obtaining the instrument function were compared using the strong arm of splitter No. 1. In addition to the standard technique of fitting a 295 K air spectrum, an Ar-ion line at 472.7 nm was focused into the fiber and the resulting spectrum fitted to the modified Voigt instrument function. A N, CARS spectrum recorded in a flat-flame burner, whose temperature was approxi- mately 1600 K, was also used where temperature as well as the instrument function parameters were determined using the least-mean-squares fitting routine. For all the least- mean-squares fits the use of an asymmetric Voigt did little to decrease the variance. Since a frequency shift between experiment and theory and a scaling factor are two param- eters that are always determined, fitting a six parameter modified Voigt and temperature in a flame spectrum ne- cessitated fitting nine variables. It was found that the in- teraction between the frequency shift and the asymmetry of 5561 Rev. Sci. Instrum., Vol. 63, No. 12, December 1992
1.25
Ar-,o”
Line
1 .oo
s
.-
z
lz 0.75 I? E 5 L 050 . ‘j S 0.25 0.00 -5 -4 -3 -2 -1 0 1 2 3 4 5 Frequency (cm’)FIG. 6. A comparison of the instrument functions obtained from fitting a 295 K CARS air spectrum, a 1600 K flame CARS spectrum, and an Ar-ion laser line at 472.7 nm.
the Voigt parameters was such that, even with the Mar- quardt modification to the fitting procedure, the fits would not reliably converge. We therefore elected to use a sym- metric Voigt with asymmetric reciprocal frequency terms (four parameter instrument function) that produced no convergence problems.
The resultant instrument functions, which are shown in Fig. 6, are all very similar with the instrument function derived from a flame spectrum being somewhat broader and the Ar-ion derived instrument function somewhat nar- rower than that derived from a 295 K air spectrum. TO assess their effect on CARS derived temperatures each in- strument function was used to convolve a CARS theory library that was then used to fit an approximately 1600 K flame spectrum. The resultant best-fit temperatures were 1600 K (Ar ion), 1610 (295 K air), and 1615 K (flame spectrum). Thus, the maximum spread is Q l%, and the uncertainty associated with using the 295 K air instrument function is -0.5%. We conclude that the standard method of deriving an instrument function is satisfactory.
The instrument functions shown in Fig. 6, which are for the strong arm of splitter No. 1, are slightly narrower than that for the same fiber input in Fig. 5. This difference, which resulted from a small, -0.5 mm, adjustment to the fiber-to-grating spacing, illustrates the sensitivity of the in- strument function to the CARS focal position. We have found that the instrument function is more variable with a direct light coupled spectrometer than when a fiber tip is acting as the spectrometer input. It is very difficult to maintain the focal spot position to this precision when us- ing wide spectrometer entrance slits. Narrow slits, which can attenuate the CARS input focal spot size, are likely to result in variable instrument functions.
D. High-signal IPDA nonlinearity
To improve the dynamic range a study was made of the IPDA nonlinearity at high signal levels. Goss5 was the first to point out the effect of IPDA saturation on CARS derived temperatures. Subsequent investigations6’7 demon- strated that the effect was associated with saturation in the output of the microchannel plate intensifier. The saturation is dependent on pulse duration and radiation density. With the older IPDA detectors, which had a rms noise level of
1-2 counts and a maximum output of 4096 counts, it was possible to avoid the nonlinea.rity by ensuring that the full height of the IPDA pixel was more uniformly illumi- nated.6s7”0 This was accomplished using a cylindrical lens7,” or by relying on the astigmatism of the spectrom- eter6 to defocus the CARS image in the desired direction. With the potentially larger dynamic range available from current IPDA detectors with 64 k A to D converters, this strategy is no longer sufficient.
To extend the useful range of these detectors we se- lected to characterize the nonlinearity and correct the CARS spectra for it in software. A look-up table (LUT) consisting of entries for the observed and corrected IPDA output was constructed and used to correct the observed CARS intensities. For values between entries in the LUT a linear interpolation was used. To determine experimentally the entries in the LUT we used CARS spectra of ambient air recorded at varying intensities and the corresponding undispersed (zero order) signal recorded by the photomul- tiplier in the spectrometer. This approach was chosen since it closely duplicated the conditions encountered in prac- tice, i.e., the same energy density, pulse duration and diode range.
The use of the photomultiplier signal to determine the nonlinearity rather than neutral density filters has the ad- vantage that it corrects, on a pulse-by-pulse basis, for the variation in the CARS signal. This variation (typical stan- dard deviation 30%-35%) results from variation in the temporal structure of the CARS pulse and exhibits almost no correlation with the pump and Stokes beam energies.
Neutral density filters, and the more stable signal from scattered 532 nm Nd:YAG input, were used to determine the linear range of the photomultiplier. To extend the lin- ear range for these short duration pulses, peaking capaci- tors were installed in the last five stages of the photomul- tiplier biasing circuit. A tapered resistor divider was used where the standard resistence (R) was increased to 2R and
3R across the final two stages. The photomultiplier was operated at relatively low voltage (700 V) to minimize anode saturation. With this arrangement the photomulti- plier saturated at 40 to 50 mA peak anode current; the peak signal employed was limited to < l/IO of this value to ensure linearity.
As expected the dispersed IPDA CARS signals showed increasing nonlinearity with respect to the photo- multiplier as the CARS intensity increased. In comparing the two intensities dispersed CARS spectra were corrected for nonlinearity and then summed spectrally to obtain the total signal. The Gauss Newton algorithm with the Mar- quardt modification was again employed to determine the 5562 Rev. Sci. Instrum., Vol. 63, No. 12, December 1992
--- Calibration, rplitler 0. lmags centered on array - Belt tit to caltb,.tions. splitter & o(I-celltw
BeIt tn to caltbmlonr, sp,,ttor A. o,t-co” tst -
a 5 0.8 c i! $ 5 0.6 zi z 0 ij 0.4 t? 0.2 0.0
Detector Signal (ADC counts x 1 03)
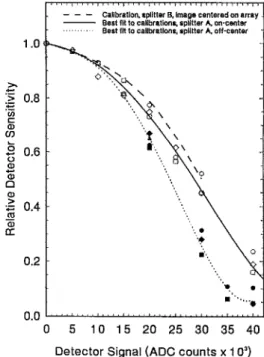
FIG. 7. The relative sensitivity of a P46-based-phosphor IPDA (Prince- ton Instruments model PI-1024-YI) showing the high-signal nonlinearity.
entries in the LUT required to predict a linear
relationship
between the corrected dispersed signal and the
photomul-
tiplier signal. As a further check the corrected CARS
sig-
nals were used to calculate the splitting ratio
between the
two dispersed CARS signals. With uncorrected CARS
sig-
nals the ratio
of the strong to
the weak signal decreased with increasing CARS intensity (as a result of increasing nonlinearity in the strong arm). With corrected signalsthis
ratio was found to be constant providing independent
ver-
ification of the LUT values. The LUT coefficients plotted as relative IPDA detector sensitivity (i.e., observed/ corrected counts) and best-fit curves are shown in Fig. 7.
The solid and dotted curves in Fig. 7 describe two distinct arrangements. The position of the dual fiber input was initially adjusted so that the dispersed CARS image was vertically centered (i.e., at right angles to the disper- sion plane)
on
the IPDA pixels and the resultant calibra- tion is represented by the open symbols and solid line in Fig. 7. As a result of damage to the epoxy cement support- ing one of the fibers in its holder it was necessary to read- just the position so that the strong arm was nolonger
centered on the pixel. The resultant calibration is shown by the dotted curve and solid symbols in Fig. 7. The increas- ing nonlinearity of this calibration is caused by higher m- diation densities (for the same output signal) resulting from off-center placement of the CARS image on the IPDA pixels.
The open and solid symbols each represent different calibrations performed over a span of several months. It can be seen that the calibration remained quite stable, un- less the fiber position was adjusted. Subsequently, a new fiber splitter was installed, and the CARS spectrometer image was again centered. The resuIting calibration, which
CARS spectrometer 5562
is shown by the dashed line in Fig. 7, is now very similar to the initial calibrations.
Several conclusions can be made from the data in Fig. 7. First, the fiber input to the spectrometer provides a sta- ble calibration. This is in contrast to a directly coupled spectrometer where we observed that the nonlinearity var- ied with the position of the CARS image on the entrance slit (and thus presumably on the detector). Second, the nonlinearity is severe and, even if we select a falloff of 10% in sensitivity as acceptable, this would limit uncorrected output signals to - 10 000 counts. Third, the calibration for IPDA nonlinearity appears reproducible over a range of 0.5-l .O in relative sensitivity. We have typically used the strong arm of the fiber provided the uncorrected peak counts were (25 00&30 000 counts. This represents a cor- rected signal of 40 OOQ-60 000 counts and greatly extends the useful dynamic range of the detector.
E. CARS temperature measurements
To demonstrate the application of the CARS system, temperature measurements were performed in a turbulent diffusion flame. Dual CARS N2 spectra were recorded us- ing fiber-splitter No. 2 and the more intense of the two spectra was analyzed provided the peak counts are
< 30 000. A correction for IPDA nonlinearity was made using the dashed curve in Fig. 7.
The burner generated axi-symmetric flows through an arrangement of concentric tubes. Air in the center tube [diameter 15 mm and a flow rate of 106 standard liters per minute (SLPM)] was surrounded by an annular flow of propane (21.2 SLPM). An outer sheath air flow of 100 SLPM was also provided. The Reynolds number, based on the inner tube diameter, was 13 000.
To fit accurately experimental CARS spectra taken in this burner it was necessary to vary the nonresonant con- tribution, particularly near the burner exit and in the fuel rich regions of the flame. To accomplish this13 the theoret- ical spectra were stored in two parts, so that individual CARS spectra can be reconstructed for any value of C, where C is the ratio of the N, mole fraction to the third order nonresonant susceptibility (in units of lo-l5 cm3/ erg). For pure nitrogen C was set to 120 (its maximum value), while for air C=93. In stoichiometric combustion of propane/air C is 59 for the reactants and 70 for the products.
An 800 pulse temperature histogram that illustrates the range of temperatures encountered in this burner is shown in Fig. 8. Temperatures from ambient (300 K) to the adiabatic propane/air flame temperature ( -2300 K) were observed. The peak intensities of the 2300 K CARS spectra were 500-600 counts and the peak intensities of the 300 K spectra were 22 000-24 000 counts. When this latter intensity is corrected for nonlinearity and the 12:l splitting ratio this corresponds to 400 000 counts. Thus recording dual CARS spectra with an intensity ratio of 12:l and correcting for detector nonlinearity can accommodate the full range of intensities encountered in turbulent combus- tion where the temperature can vary from 300 to 2300 K. A detailed description of temperature measurements in this 5563 Rev. Sci. Instrum., Vol. 63, No. 12, December 1992
l-
I
Reynolds Number = 13,000 Position: Axial 140 mm Radial 26 mmI
I 19001
a
230; Temperature (K)FIG. 8. 800 pulse temperature histogram measured in a turbulent diffu- sion flame burner.
burner and the possible effects of spatial averaging will be described in a future publication.
F. Temperature uncertainty due to dye laser shift The sensitivity of the best-fit temperatures to dye laser spectral shift was found to be minimized when the spectral maximum of the nonresonant reference was outside the fitting range (2273-2343 cm-‘). To examine the sensitiv- ity of the best-fit temperatures to dye laser shift, we se- lected an experiment with the center frequency at the larg- est Raman shift we have employed. For the data in Fig. 8 the dye laser center frequency was adjusted so that the peak of the nonresonant reference spectrum was at 2285 cm-’ (Raman shift), corresponding to the start of the N, hot (u=2-1) band.
To assess this error we modified the ‘fit program to allow for specific frequency shifts in the nonresonant ref- erence spectrum. The effect of these shifts on best-fit tem- perature for two 800 pulse files recorded in the turbulent diffusion flame are shown in Fig. 9. The open and closed symbols represent the two experiments, and the data was averaged in 20 equal temperature intervals. The spectral shifts employed ( *2 cm-‘) correspond to the maximum estimated error in adjusting the dye laser center frequency. This error was estimated from a series of trials in which the dye laser center frequency was deliberately varied, then reset to the initial position. We concluded that the error was l*l cm-‘. From Fig. 9 it can be seen that in the range 600 K < T < 2300 K the maximum error is l%-
1.7%, being larger for a +2 cm-’ shift i.e., shifting the peak of the nonresonant spectrum towards the Nz v= 1-O band. For temperatures below 600 K the percentage tem- perature changes become larger and more erratic ap- proaching 3% at 300 K. The uncertainty in temperature resulting from an average error of f 1 cm- ’ in dye laser position is estimated to be ~0.8% for T> 600 K.
40 & 20 E 6 & m” -I 2 0 :: 5 c .C b %I -20 -40 . g- -2.0 cm ’ shift .O +2.0 cm ” shift 300 800 1300 1800 2300 Temperature T of Unshifted Spectrum (K)
FIG. 9. The effect of uncertainty in the dye laser center frequency on the best-fit temperatures obtained from fitting single-pulse CARS data from the turbulent diffusion flame. The circles and squares represent the data for two separate 800 pulse files, which were averaged into 20 groups each containing an average of 40 individual measurements.
ACKNOWLEDGMENTS
This work was supported by the Department of Na- tional Defence of the Canadian Government with Dr. G. Verville serving as project monitor. We thank Dr. I. Camp- bell who designed the turbulent diffusion burner and I. Diduch and D. Gareau who designed and built the elec- tronic control circuits, the gated integrators and the sample-and-hold circuits. Dr. T. Parameswaran acknowl- edges the support of the CANMET Laboratory, Energy, Mines and Resources Canada in the development of the CARS software with P. I-Iugh.es acting as contract moni- tor.
5564 Rev. Sci. Instrum., Vol. 63, No. 12, December 1992 CARS spectrometer 5664 ‘S. A. J. Druet and J. P. E. Taran, Prog. Quantum Electron. 7, 1 ( 1981). ‘R. J. Hall and A. C. Eckbreth, in Laser Applications, edited by J. F.
Ready and R. K. Erf (Academic, New York, 1984), Vol. 5. 3 D. A. Greenhalgh, in Advances in Non-linear Spectroscopy, edited by R.
J. H. Clark and R. E. Hester (Wiley, New York, 1988).
4W. B. Roh, P. W. Schreiber, and J. P. E. Taran, Appl. Phys. Lett. 29,
174 (1976).
5L. P. Goss, D. D. Trump, B. G. Macdonald, and G. L. Switzer, Rev, Sci. Instrum. 54, 563 ( 1983).
6D. R. Snelling, R. A. Sawchuk, and G. J. Smallwood, Appl. Opt. 23, 4083 (1984).
‘R. B. Antcliff, M. E. Hillard, and 0. Jarrett, Jr., Appl. Opt. 23, 2369 (1984).
‘D. R. Snelling, G. J, Smallwood, and R. A. Sawchuk, Appl. Opt. 28, 3226 ( 1989).
9D. R. Snelling, G. J. Smallwood, and T. Parameswaran, Appl. Opt. 28, 3233 (1989).
%. Kroll, M. Alden., P. E. Bengtsson, and C. Lofstrom, J. Appl. Phys. B 49, 349 (1989).
“A. C. Eckbreth, Appt. Opt. 22, 2118 (1983).
“K. W. Boyack and P. 0. Hedman, 23rd Symposium (International) on Combustion, The Combustion Institute, Pittsburgh, PA, 1883 ( 1991). 13R. J. Hall and L. R. Boedeker, Appl. Opt. 23, 1340 ( 1984).
“L. A. Rahn, L. J. Zych, and P. L. Mattern, Opt. Commun. 30, 249 (1979).
‘*B. Attal, M. Pealat, and J. P. E. Taran, J. Energy 4, 135 (1980). “A. Gierulski, M. Noda, T. Yamanoto, G. Marrusky, and A. Slenczky,
Opt. Lett. 12, 608 (1987).
17M. Pealat, M. Lefebvre, J. P. E. Taran, and P. L. Kelley, Phys. Rev. A 38, 1948 (1988).
‘sT. Parameswaran and D. R. Snelling, NRC Technical Report No. TR- GD-013 1989.
19H. Kataoka, S. Maeda, and C. Hirose, Appl. Spectrosc. 36, 565 (1982). *OR. E. Teets, Opt. Lett. 9, 226 (1984).
2’ R. J. Hall, J. F. Verdieck, and A. C. Eckbreth, Opt. Commun. 35, 69 (1980).
‘*E. E. Whiting. J. Quant. Spectrosc. Radiat. Transfer 8, 1379 ( 1968). 23 H. Kim, J. Chem. Ed. 47, 120 (1970).
24D. J. Marquardt, J. Sot. Indust. Appl. Math. 11, 43 (1963).
“D. R. Snelling, R. A. Sawchuk, and R. E. Mueller, Appl. Opt. 24, 2772 (1985).
26A. C. Eckbreth, Appl. Phys. Lett. 32, 421 (1978). 27M. Woyde and W. Stricker, Appl. Phys. B 50, 519 ( 1990).
2sP M Hughes, CANMET . . Laboratory, Energy, Mines and Resources Canada (private communication).