Université libre de Bruxelles
Ecole de Santé Publique
Should health systems in developing countries
focus on regularity of service delivery
to improve their performances ?
Travail présenté pour l’obtention du DEA en Sciences de la Santé (Orientation Santé Publique)
Denis Porignon
Directeur : Prof. M. Dramaix
Summary
One of the key elements developed in the Alma-Ata Conference was the scientific soudness of Primary Health Care. First consideration would convince the observer that health services delivered on a regular basis would automatically achieved better performance. Nevertheless, careful attention allows researcher to doubt this assumption. The present study was performed by computing health centres monthly data available in Rwanda for the year 1999. By using indicators collected through routine HIS, this paper attempts to argue or even provide evidence that regularity of service delivery tested on BCG immunisation coverage indicator could be considered as a key pointer for better global performance at health centre level.
In order to categorise health centres that are regularly performant or not, vaccination against tuberculosis (BCG) was choosen as reference activity. The monthly regularity of this activity has been measured for each health centre. The health centres were grouped into group I (n=255) and group II (n=68). Performances were then scrutinized for 4 other indicators. In order to validate the first results obtained on the basis of an a priori classification, cluster analysis was also performed (n=254).
The results showed that those health centres that have the better performance for BCG immunisation (Group II) are also those that systematically have better performance for all other selected indicators. The results showed also good similarity between cluster and grouping analyses, especially for well performing health centres.
BCG vaccine coverage is linked to other indicators as a “predictor” for good performance. The argumentation provides medical authorities with relevant elements for influencing strategic policy formulation. Moreover, as an example, the present study reveals that it is conceivable to perform analyses that provide useful information for investigation and reasoning about the way health systems are constructed and about how to improve soundness of decision making for better organisation of service delivery.
Introduction
One of the key elements developed in the Alma-Ata Conference was the scientific soudness of Primary Health Care (WHO, 1978). Research in health system and health services organisation is particular in the sense that assumptions are difficult to demonstrate because of the impracticability to organise studies in which only one factor is changing. Thus, biase become difficult to control. That is the reason why this paper relates more to assumptions argumentation than to statistical evidence. In the present study it has been tried to organise data analysis agreeable with a framework usually used in the better described clinical epidemiological research. According to some authors, retrospective cohort studies implies that the investigation is initiated at a point in time after both the exposure and disease have already occured (HENNEKENS, 1987; BEAGLEHOLE
et al, 1994). In the present case related to health service organisation, subjects are health centres. Health information systems (HIS) give the opportunity to investigate the service delivery performed by health centres or outputs while they present some specific caracteristics. These correspond respectively to disease and exposure in the epidemiological terminology. This kind of study provides the opportunity to analyse the operationality of local health services. Even if careful attention should be put on their interpretation by addressing various biases, results might become useful arguments to orientate strategic decision making.
First consideration would convince the observer that health services delivered on a regular basis would automatically achieved better performance. Nevertheless, careful attention allows researcher to doubt this assumption because for example of widespread influence of vertical programmes, especially mass campaigns. It becomes then attractive to check the relationship between regularity and performance. Furthermore, it is not obvious that regularity and performance in one activity would be accompanied with high level of performance for other activities. Regularity of service delivery is a key element for quality of care. It assumes that health centres will better perform and will be likely to better respond to unsual solicitations if they are used to organise and deliver services on a regular basis than if they are working confusedly by following injunctions coming from different decision makers in a uncoordinated manner. Regularity of service delivery depends on many factors which are more or less related to providers, e.g. workload, seasonal variations, geographical accessibility, qualification of personnel, drug or vaccine shortages. In the present study, although they will be discussed, it will not be possible to address all these aspects, mostly because appropriate data are lacking.
HIS provides information for researching as well as for monitoring the health situation, the performance of promotive, preventive and curative activities and the availability and utilisation of health resources (WHO, 2000a). WHO recently proposed a framework to analysing health systems performance (WHO, 2000b). This report appeared to be controversial (VAN DER STUYFT & UNGER, 2000; NAVARRO, 2000; ALMEIDA et al, 2001, JAMISON & SANDBU, 2001), but it pertinently raised that one of the key function to be examined in health system analysis is the delivery of services. Health data is often considered as poorly reliable, mainly in developing countries. Nevertheless, some of them have developed adequate HIS for the last ten years and the adequacy of yielded information is becoming better (BASCH, 1999).
Albeit HIS are reputed to be more related to diseases or to ignore topics related to quality of care (CIBULSKIS & IZARD, 1996), it should be conceivable to perform analyses by using existing routine data which could provide information on qualitative as well as quantitative aspects of health service organisation.
Oucome indicators are the more reliable and useful to inform on health system performance. They are difficult to calculate on a routine basis because public services responsible for vital registration (e.g. births and deaths) are lacking. This was also the case in Rwanda. Nevertheless, output indicators are universally used to describe the productivity of health services. In Rwanda, HIS was completely dismantled during the 1994 war and genocide. A new health information system was implemented that provides routine information related to services delivered by primary health facilities in the country. It was considered as one of the key ingredients of health sector reform undertaken by the Ministry of Health from 1995 onward. This reform was based on health district implementation, decentralisation and increased community involvement in managing and financing health services. HIS was deeply redesigned in 1997 and its new version implemented in 1998 in the whole country. From 1998 onward monthly information has been collected in every public and not-for-profit (mostly church related) health centre. Information was then computerised at the district level before being sent to intermediate (i.e. regional) and central levels. The present study was performed by computing HIS data available in the Information, Research and Documentation Unit of the Ministry of Health.
By using indicators collected through routine HIS, this paper attempts to argue or even provide evidence that regularity of service delivery tested on BCG immunisation coverage indicator could be considered as a key pointer for better global performance at health centre level.
Methods
In 1999, 344 health centres were registred in Rwanda. Out of 344, 323 health centres were eligible for the present study. The other 21 were health facilities linked to jails or private companies (n=11) as well as health centres temporarily non operational for organisational or severe security reasons (n=10). None of these 21 health centres were required to performed preventive or obstetrical activities.
Each health centre has a defined catchment area. Each catchment area has a population that was determined or by local authorities or by health professionnals generally with the support of specialised aid agencies involved in the area. In 1999, the mean population of health centres catchment area was 24 284 inhabitants and the median population was 21 262. Yearly targets for each health centres were defined according to population of their catchment area as well as to the share of the population that was supposed to benefit from service delivery i.e., children aged 0-11 months or pregnant women. In Rwanda, the proportions of both children aged 0-11 months and pregnant women were defined by the Ministry of Health on the basis of a Socio-Demographic Survey conducted in 1996 by the Ministry of Finance and Economic Planning under the guidance of the United Nations Fund for Population (MINISTRY OF FINANCE AND ECONOMIC PLANNING, 1998). In 1999, these proportions represented 4.6 % of the total population. Yearly targets were rounded up or down to the closer unit. The mean year target population for these areas was 1116 and the median year target population was 968. Monthly targets for each health centre were calculated by dividing yearly targets by 12.
Performance indicators were selected for the year 1999. In order to categorise health centres that are regularly performant or not, vaccination against tuberculosis (BCG) was choosen as reference activity because it is the first to be given to children aged 0-11 months, be it just after delivery or during the first preventive contact with health services. This will constitute the baseline activity for the present study. The monthly regularity of this activity has been measured for each health centre. The issue was to check if each health centre reached or not the BCG immunisation monthly target. According to their regularity in delivering BCG immunisation, the health centres were grouped into two: group I included health centres which did not performed at least 60 % of their expected monthly BCG immunisation target during 9 months out of 12 and group II with all the other health centres.
The threshold of 60 % was selected because it represents 10 % above the mean value for tuberculosis immunisation coverage in Rwanda during the study’s year. The 10 % increase was
reckoned as a fair level of requirement. It was decided to lower the regularity criteria to 9 months instead of 12 in order to allow some variation in health centres activities which may not be under the responsability of service providers (due for example to seasonable variation in utilisation).
From the selected 323 health centres, according to criteria described above, 255 health centres (79 %) were in the Group I while 68 (21 %) were in Group II. The target population were not significantly different between the groups of health centres. BCG vaccine coverage was 48.4 % in Group I and 85.3 % in Group II. The difference was highly significant (p < 0.001).
According to data that were available in the Rwanda HIS, the following additionnal indicators were taken into consideration : (1) measles immunisation coverage, (2) third dose of Diphteria – Tetanus - Pertussis [DTP3] immunisation coverage, (3) obstetrical coverage [proportion of woman who delivered in health centres] and (4) antenatal care coverage [first contact during the pregnancy first trimester]. These indicators are among those usually recognised for analysing the global performances of first contact facilities (KIELMANN et al, 1991; WHO, 1999). Poliomyelitis immunisation was excluded of analysis because it was the key component of selective activities conducted in the whole country (National Immunisation Days).
Normal plots were first examined to check health service coverage distributions. These plots showed that all distributions were normal except obstetrical coverage and antenatal care coverage. Mean or median performances of health centres with standard deviation (SD) or range in each group were then compared with t-Student or Mann-Withney tests respectively. Regarding the 323 health centres selected for this study, some of them reported coverage higher than 100 %. For each indicator, these health centres were excluded singularly for regularity analysis. The number of included health centres was 294 for BCG vaccine coverage, 313 for measles vaccine coverage, 307 for DTP 3 vaccine coverage, 279 for obstetrical coverage and 320 for antenatal coverage. A lower number of health centres was observed for obstetrical activities because some of them did not have a maternity ward and consequently did not performed the activity.
In order to take into account the workload bias, health centres were initially compared for population and target population related to different activities. Health centres were divided in groups according to the population of their catchment area (less or equal to 20 000 inhabitants and more than 20 000 inhabitants). The 20 000 inhabitant threshold was selected because the infrastructure coverage norm in Rwanda corresponds to 1 health centre for every 20 000 inhabitants. Levels of activity were compared between the two population related groups for each
indicator. If needed, multiple linear regression has been performed in a view to adjusting performances for workload (population).
Finally, in order to validate the first results obtained on the basis of an a priori classification (performant or not regarding the regularity and magnitude of BCG immunisation coverage), cluster analysis was also performed. Cluster analysis meets investigator’s concern of finding a classification in which the items of interest (health centres in the present study) could be placed into a small number of homogeneous groups or clusters. Cluster analysis may provide a convenient summary of the multivariate data on which it is based and it may have theoritical or practical implications on strategies to define (EVERITT & DUNN, 1991). Out of 323, health centres which did not perform obstetrical activities (n= 35) and health centres which had at least one coverage exceeding 100 % (n=34) were excluded. This analysis was then related to 254 health centres. In order to allow comparative analysis, performances were transformed into z-scores.
Results
In Rwanda, during the study year, the monthly report completion rate was 93 %.
Table 1 shows the comparison of health centre performance for each indicator according to the population in their catchment area. There are significant differences for every indicator but not for BCG vaccine coverage and antenatal care coverage for which population size is not significantly different. For the other indicators, it apperared that those health centres having less than 20 000 inhabitants living in their catchment area performed significantly better.
Table 1: Comparison of health centres performance according to the volume of population in their catchment area
N N Mean# or median° (SD# or range°) p
(=< 20 000) (> 20 000) (=< 20 000) (> 20 000)
BCG vaccine coverage 294 122 172 57.0# (22.1)# 53.2# (20.3)# 0.129 Measles vaccine coverage 313 132 181 41.4# (19.3)# 36.3# (18.5)# 0.018 DTP 3 vaccine coverage 307 128 179 47.6# (19.9)# 42.6# (19.3)# 0.029
Obstetrical coverage 279 120 159 10.0° (95.6)° 7.0° (66.2)° 0.014
Antenatal coverage 320 138 182 3.0° (99.4)° 3.7° (71.3)° 0.354
DTP 3 = Diphteria Tetanus Pertussis (third dose)
Obstetrical coverage = deliveries that occured under profesionnal assistance in health centres Antenatal coverage = first contact with antenatal care during the first trimester of pregnancy N = number of health centres
(=< 20 000) = health centres having less than or equal to 20 000 inhabitants in their catchment area (> 20 000) = health centres having more than 20 000 inhabitants in their catchment area
p : significance value for t-student or Mann - Whitney test
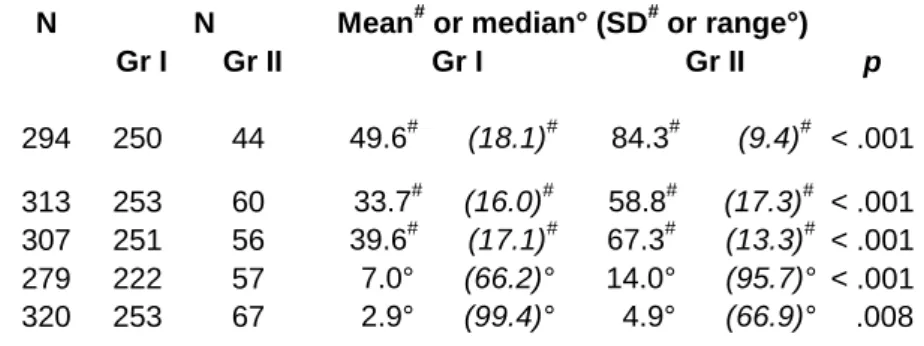
Table 2 shows that those health centres that have the better performance for BCG immunisation (Group II) are also those that systematically have better performance for all other selected indicators. It is important to emphasize the fact that the differences are highly statistically significant for all selected indicators whether there are related to immunisation activities or related to antenatal/obstetrical activities.
For each indicator, the difference of population size in Group I and II was tested. The difference was significant for both obstetrical and antenatal care coverage, p = 0.002 and p = 0.023 respectively. According to results expressed in Table 1 and Table 2, this implied that obstetrical coverage was the only indicator for which an adjustment was needed.
Table 2: Comparison of median and range between health centres according to the level of their performance
N N Mean# or median° (SD# or range°)
Gr I Gr II Gr I Gr II p
BCG vaccine coverage 294 250 44 49.6# (18.1)# 84.3# (9.4)# < .001 Measles vaccine coverage 313 253 60 33.7# (16.0)# 58.8# (17.3)# < .001 DTP 3 vaccine coverage 307 251 56 39.6# (17.1)# 67.3# (13.3)# < .001 Obstetrical coverage 279 222 57 7.0° (66.2)° 14.0° (95.7)° < .001 Antenatal coverage 320 253 67 2.9° (99.4)° 4.9° (66.9)° .008
DTP 3 = Diphteria Tetanus Pertussis (third dose)
Obstetrical coverage = deliveries that occured under professionnal assistance in health centres Antenatal coverage = first contact with antenatal care during the first trimester of pregnancy Gr I = health centres with < 9 months above 60 % of expected performance for BCG immunisation Gr II = health centres with >= 9 months above 60 % of expected performance for BCG immunisation p : significance value for t-Student or Mann - Whitney test
Among 279 health centres with obstetrical coverage inferior to 100 %, Group I and Group II were significantly different meaning that the median population was significantly lower as the performance was good. After adjustment for population with multiple linear regression, obstetrical coverage was significantly different in both groups according to performance. Mean difference of obstetrical coverage between Group I and Group II changed from 9.9 % to 9.4 % and remained statistically significant.
Clustering technique used in the present study allowed to classify all health centres into two clusters (A and B). All health centres that belonged to Cluster A were reputed to have a lower performance level than the health centres that belonged to Cluster B. Among health centres included in the cluster analysis, all those which belonged to Group II were classified in Cluster B (see Table 3). The proportion of health centres of Group I that were classified in Cluster B was significantly lower than the proportion of health centres of Group II classified in Cluster B (35 % versus 100 %, Pearson χ2 = 56.6, P < 0.001).
Table 3: Spreading of health centres of Group I and II in Cluster A and Cluster B. Cluster A Cluster B Total
Group I 140 75 215
Group II 0 39 39
Table 4 shows that performance of health centres of Group I and classified in Cluster B were systematically lower than performance of health centres of Group II and classified in Cluster B. Nevertheless, these differences were highly significant for BCG and DTP3 immunisation activities while they were not significant for measles immunisation activity as well as for antenatal and obstetrical coverage.
Table 4: Coverage for activities according to Groups and Clusters
BCG Measles DTP 3
N vaccine vaccine vaccine Obstetrical Antenatal coverage coverage coverage coverage coverage
Group I Cluster A 140 Mean 41.9 25.2 31.2
Median 5.6 2.4
Cluster B 75 Mean 63.9 48.4 55.2
Median 13.1 3.9
Group II Cluster B 39 Mean 84.5 53.7 64.6
Median 14.0 4.1
Results expressed as percentage (%)
DTP 3 = Diphteria Tetanus Pertussis (third dose)
Obstetrical coverage = deliveries that occured under professionnal assistance in health centres Antenatal coverage = first contact with antenatal care during the first trimester of pregnancy Gr I = health centres with < 9 months above 60 % of expected performance for BCG immunisation Gr II = health centres with >= 9 months above 60 % of expected performance for BCG immunisation
Discussion
Given the design of the present study, results provides evidence that regularity can be choosen as a mean to reach better performance in service delivery. In addtion, it appears that working on one activity should lead to better performance in other activities. This argues in favor of the need for global and horizontal approach for health system organising. This outlook supports as well the need for local health services strengthening instead of, for instance, favoring other selective activities, e.g. vertical programmes, that are often put in place in the aftermaths of disasters or that are choosen as privileged tools to achieve specific objectives, like poliomyelitis eradication. A more integrated approach at the district level should be promoted because of arguments described in the present study but also because of lower costs, increased effectiveness or eased planning and management (AGYEPONG, 1999). It does not mean that there is no room for vertical programmes. They will be restricted to very specific or particular health problems that would consume most of health centre resources, like sleeping sickness control in certain areas of Central Africa (EKWANZALA et al, 1996). Furthermore, it was often observed that vertical programmes will benefit from relying on well organised integrated health services (EKWANZALA et al, 1996; CAIRNCROSS et al, 1997; CLEASON & WALDMAN, 2000). It appears then that regularity and integration could be major arguments for strategic decision making about health services delivery orientations.
It is also clear that both regularity and integration especially if coupled with enhanced management might become a key issue in terms of quality assurance improvement in health facilities. These aspects should be emphasized during initial and in service training of all health professionnal categories. Cluster analysis combined with grouping methodology isolated 140 health centres that should benefit from improved situation analysis, training and supervision in a view to switching them to the lower right cell of the diagram (see black arrow in Table 3). Due to the big number, this could be difficult to organise from the central level but will be easily carried out from district level.
Health information systems are very often understood and used as tools to get information or are considered as a burden which imposes additonnal workload on the shoulders of professionnals working at the facility level of the health system. In Rwanda, just after the war and genocide, the HIS has been recognised as a systematic collection and reporting of performance of an activity that allows the managers to understand some aspects of the perfomance of health services in particular, or of the health system as a whole. This was the reason why medical authorities of the country decided to implement a relevant and comprehensive though simple computerised
information system. In Rwanda, health centres are very keen to send their monthly reports to district medical authorities. This point is important to pull out the bias of non response which could lead to discriminate health centres on absence of data instead of performance criteria. However, albeit the completion rate in Rwanda was remarkably high, accuracy of data may always be questioned, especially for those health centres that reported coverages over 100 %. Proper data analysis at district level should focus on that problem in order to increase reliability of health information collection at facility level.
As mentioned above, concerns about biases are numerous but are difficult to address in health services research. First of all, use of routine data which were not collected for the specific purpose of the study could be criticised by some researchers. Such data is becoming increasingly common and hailed as an efficient source of consistent information (VIRNIG & McBEAN, 2001). Next, regularity of health services delivery could be influenced by many factors among which workload, insecurity due to civil strifes, caracteristics of rural and urban settings, personnel skills and qualification, geographical accessibility, nearness of hospital maternity wards, vaccine shortage. The first two factors were specifically addressed. Adjustment to workload was performed and health centres that were in most remoted insecured areas did not provide any services and were excluded from analysis.
Data were not available in a view to taking all the other factors into account. Nevertheless, it can be pointed for instance that according to the 1996 Socio Demographic Survey, less than 6 % of the Rwandan population were living in urban settings which was a very small share of the population and was likely to have no significant influence on the global results of the study. Regarding skills and qualification of personnel, some studies conducted in Rwanda before 1994 suggested that there were no link between personnel qualification and performances, especially for activities connected with maternal health (Grundmann C, personnal communication). With regard to the nearness of district hospital maternity wards and their likelihood to performe BCG immmunisation as well, it is noteworthy that only 3 % of expected deliveries occured in hospitals in Rwanda. Once again, it makes it unlikely to have a significant influence on the results of the study.
Although no reliable information was available on vaccine availability, the fact that both obstetrical and antenatal care coverages showed the same trend of performance as immunisation activities, allowed also to eliminate the vaccine shortage bias. It was then authorized to conclude that Groups I and II discriminated more on performance than on the fact that in health centres of
Not withstanding all these problems, this kind of study conducted from the central or peripheral level of the Ministry of Health could be used as a baseline information set for subsequent analyses. It could also be used as a tool for comparing activities between health centres, districts or health regions.
Nonetheless, a worrying aspect remains that, according to our classification, only 20 % of health centres were performing well. This might bring a questionmark beside the whole reform process of the health system in Rwanda. Obviously, this is not the purpose of this paper. First, we have to say that the laps of time between implementation and this partial evaluation is very short. On that basis, it is more relevant to emphasize the huge amount of work that has been done between 1995 and 1999, during which the health system was reformed and relaunched in the whole country, while the Government was also concerned with the recovery of other sectors of the Rwandan society. Performances achieved by the Rwandan health system for immunisation were in the range of 40-60 %, not far from those officially reported by many countries of the WHO Africa Region (WHO, 1998). These results were achieved with ratios of medical doctors and nurses per 10 000 inhabitants respectively 7 and 4 times lower than in the other countries of the Region (WHO, 1998).
The study was focused on year 1999. This year corresponds to a breakpoint in the Rwanda health system recovery process because external aid decreased sharply and domestic resources – although increasing - remained very low (MINISTRY OF HEALTH, 2000). Between 1995 and 1998, external aid was increased from 3 to 45 million USD with a peak in 1998 as a consequence of humanitarian aid given by the international community in the aftermaths of war and genocide for a population increasing from 7.1 to 8 million. A share of about 40 % was concentrated on investment, mainly rehabilitation of infrastructures. From 1999 onward the international contribution to health care financing in Rwanda decreased sharply and drop under the 1995 level. In the meantime, additional domestic resources were mobilised from tax revenue and income generating activities of the State. According to the World Bank and International Monetary Fund recommendations, the Rwandan Government decided to direct this money towards the social sector in order to compensate the loss of external aid. Therefore, public domestic expenditure on health has increased from 2.9 % in 1996 to 4.2 % in 1999 as a share of the global budget of the Government. This represented 0.6 to 1.3 USD per inhabitant per year. The overall low level of financial resources in Rwanda may partly explain why the performance were weak in most of first line health facilities. Nonetheless, this was not the only explanation: recovery from destruction and persistance of troubles and war in various areas of the country as well as poor education were likely to be also responsible for low performance. However that may be, financial aspects remained
key issues in improving health system operationality and health budget should be increased. As pointed out recently, with a small additional amount of money spent on health, performance could improve significantly as long as the system is efficiently organised (EVANS et al, 2001).
BCG vaccine coverage is linked to other indicators as a “predictor” for good performance. The argumentation provides medical authorities with relevant elements for influencing strategic policy formulation at national or local level: regularity in delivering activities could be considered as a reflect of local health services operationality and should be an issue to emphasize in training processes. Moreover, as an example, the present study reveals that by handling available data at national level, it is conceivable to perform analyses that provide useful information for investigation and reasoning about the way health systems are constructed and about how to improve soundness of decision making for better organisation of service delivery.
References
Agyepong I. (1999) Reforming health service delivery at district level in Ghana: the perspective of a district medical officer. Health Pol Plann 14(1), 59-69.
Almeida C., Braveman P., Gold M.R. et al (2001) Methodological concerns and recommendations on policy consequences of the World Health Report 2000. Lancet, 357, 1692-97.
Basch P.F. (1999) Textbook of International Health (chapter 5). Oxford University Press, Oxford.
Beaglehole R., Bonita R., KjellströmT. (1994) Elements of Epidemiology. World Health Organization, Geneva
Cairncross S, Periès H, Cutts F. (1997) Vertical health programmes. Lancet, 349 S-III, 20-22.
Cibulskis R., Izard J. (1996) Monitoring systems. in Janovski K. (Editor) Health policy and systems development : An agenda for research. WHO/SHS/NHP/96.1, World Health Organization, Geneva
Cleason M., Waldman R.J. (2000) The evolution of child health programmes in developing countries: from targeting diseases to targeting people. Bull World Health Org, 78, 1234-45.
Ekwanzala M., Pepin J., Khonde N., Molisho S., Bruneel H., De Wals P. (1996) In the heart of darkness: sleeping sickness in Zaire. Lancet, 348, 1427-30.
Evans D.B., Tandon A.J., Murray C.J.L., Lauer J.A. (2001) Comparative efficiency of national health systems: cross national econometric analysis. Br Med J, 323, 307-10.
Everitt B.S., Dunn G. (1991) Applied Multivariate data analysis. Edward Arnold, London.
Hennekens C.H., Buring J.E. (1987) Epidemiology in Medicine. Little Brown & Co, Boston.
Jamison D.T., Sandbu M.E. (2001) Global health : WHO ranking of health system performance.
Science, 293, 1595-96.
Kielmann A.A., Janovsky K., Annett H. (1991) Assessing district health needs, services and systems. Protocols for rapid data collection and analysis. MacMillan, London.
Ministry of Finance and Economic Planning (1998) Socio-demographic survey in Rwanda. Kigali, Rwanda.
Ministry of Health (2000) Health Sector Public Expenditure Review. Kigali, Rwanda.
Navarro V (2000) Assessment of the World Health Report 2000. Lancet, 356, 1598-601.
Van der Stuyft P., Unger JP. (2000) Improving the performance of health systems: the World Health Report as go-between for scientific evidence and ideological discourse. Trop Med & Int Health 5(10) 675-7.
Virnig B.A., McBean M. (2001) Administrative data for public health surveillance and planning.
Annu Rev Public Health, 22, 213-30.
World Health Organization (1978) Primary health care. Report of the International Conference of Primary Health Care, Alma Ata, USSR. Health For All Series, no 1., WHO, Geneva.
World Health Organization (1998) Evaluation of the implementation of the global strategy for Health for All by 2000. A selective review of progress and constraints (1979-1996). WHO/HST/98.2. WHO, Geneva.
World Health Organization (1999) Catalogue of Health Indicators. WHO, Geneva.
World Health Organization (2000a) Health information systems development and strengthening.
WHO/EPI/OSD/00.6, Geneva.
World Health Organization (2000b) The World Health Report 2000. Health systems – Improving Performance. Geneva.