HAL Id: hal-00430181
https://hal.archives-ouvertes.fr/hal-00430181
Submitted on 6 Nov 2009HAL is a multi-disciplinary open access
archive for the deposit and dissemination of sci-entific research documents, whether they are pub-lished or not. The documents may come from teaching and research institutions in France or abroad, or from public or private research centers.
L’archive ouverte pluridisciplinaire HAL, est destinée au dépôt et à la diffusion de documents scientifiques de niveau recherche, publiés ou non, émanant des établissements d’enseignement et de recherche français ou étrangers, des laboratoires publics ou privés.
Imaging fast relaxation dynamics of NO2
Raluca Cireasa, Jean-Benoît Hamard, Cécile Maury, Valérie Blanchet
To cite this version:
Raluca Cireasa, Jean-Benoît Hamard, Cécile Maury, Valérie Blanchet. Imaging fast relaxation dynam-ics of NO2. Physica Scripta, IOP Publishing, 2009, 80, pp.048106. �10.1088/0031-8949/80/04/048106�. �hal-00430181�
Imaging fast relaxation dynamics of NO
2Raluca Cireasa
1, Jean-Benoˆıt Hamard, C´ecile Maury and Val´erie Blanchet
Universit´e de Toulouse ; UPS; Laboratoire Collisions Agr´egats R´eactivit´e,
IRSAMC, F-31062 Toulouse,France
CNRS ; UMR 5589 ; F-31062 Toulouse, France
Abstract
Time-resolved spectroscopy combined with velocity map imaging technique have been used to investigate the multiphoton dynamics of NO2 molecule. Two different
pump-probe excitation schemes were used to explore different potential energy surfaces (PESs) located in the first dissociation region and in the Rydberg region around 9.2 eV. Integrated and energy resolved signals of NO+2, NO+ and photoelectrons were recorded as a function of time. When exciting with 403 nm photons, the NO+ signal
exhibits an intriguing oscillatory behaviour with a period of 512 fs. The NO+ and
photoelectron kinetic energy distributions produced by this pump wavelength were cold, while those produced when employing 269 nm photons as pump were very rich, evidencing the presence of multiple excitation channels. A couple of sharp long lived photoion-photoelectron peaks represents the most salient feature of latter. They were assigned to an excitation by two 269 nm photons to a Rydberg state dissociating into NO(A2Σ+)+O(3P ). This NO+ peak as well as another one located at 0 eV display
very complex time dependencies including the signatures of two dissociation dynamics on timescales of 400 and 600 fs. The different pathways responsible of this temporal behaviour are discussed in view of shedding light onto the underlying multichannel multiphoton dynamics.
1
Introduction
The interest for NO2molecule stems not only from its importance for the environmental and
combustion chemistry, but also from the fact that it exhibits a rich and complex electronic structure despite the apparent simplicity of a triatomic molecule. Consequently, overtime it became a benchmark system for a variety of spectroscopic and dynamics studies concerning theoretical and experimental aspects of photodissociation, intramolecular vibrational redis-tribution, nonadiabatic couplings [1, 2, 3, 4, 5, 6, 7, 8, 9, 10, 11, 12, 13]. The numerous nonadiabatic interactions are reflected in a complex photodissociation dynamics. Photodis-sociation initiated into the first absorption band occurs via excitation to a surface of mixed
˜ A2B
2/ ˜X2A1electronic character followed by a rapid nonadiabatic transition [14, 15] through
a conical intersection and a transfer of the population back to the ground state correlating
with NO(X2Π)+O(3P) dissociation channel. While at low excess energy the dissociation is
slow and can be described as statistical, at higher excess energies vibrational population seems to be determined earlier on the reaction coordinate than the rotational population and it is highly inverted, indicating that the dissociation is very fast [16, 17, 18]. The dis-sociation time is decreasing quickly as the disdis-sociation wavelength is increased from about 50 ps at 398 nm to about 2 ps at 396 nm [19, 20]. Excitation with wavelengths shorter
than 250 nm allows accessing ˜D2B
2 state strongly predissociative even for low vibrational
levels and correlating diabatically to the second dissociation channel, NO(X2Π)+O(1D),
and adiabatically to the first one, NO(X2Π)+O(3P ) [21, 22]. The Rydberg region was also
investigated by multiphoton excitation and time domain studies showed that the lifetimes of some Rydberg states was in order of 500 fs [23, 24, 25]. In a two-colour pump-probe
experiment, NO2 was excited with 400 nm radiation and the nascent NO(A2Σ+) fragment
was probed at 800 nm by measuring the fluorescence depletion [23]. From the dependence of the fluorescence signal on the pump intensity appeared that the dynamics, leading to
dissociation into NO(A2Σ+) and O(3P), is initiated in the Rydberg region by three 400 nm
photons. In addition, the time dependence of the depletion fluorescence signal was used to infer an upper limit of about 600 fs for the complete separation of the fragments after the bond breaking. Photoelectron-photoion coincidence technique was implemented by Davies et al. in a femtosecond time-resolved experiment in order to discriminate between dissocia-tive multiphoton ionisation (DMI) and parent ionisation induced by absorption of 375 nm
photons [24, 25]. The energy correlation spectra recorded for the photoelectrons and NO+
indicate that the main mechanism is a rapid dissociation (about 500 fs) of the the parent,
upon absorption of three photons, into NO(C2Π)+O(3P) and subsequent ionisation of the
molecular fragment by absorption of an additional time delayed 375 nm photon.
Recently, an intriguing oscillatory behaviour of the integrated NO+ signal time
depen-dence was evidepen-denced in an experiment involving 400 nm and 266 nm pulses as pump and probe, respectively [26]. In a follow up study, velocity map images showed that this frag-ment was bearing very little kinetic energy [27]. Furthermore, similar oscillations were also recorded on the signal associated to slow photoelectrons. Oscillation periods of 600 fs and 830 fs were obtained from the fits of the oscillating component of the ion and photoelectron signals. These oscillations have been tentatively interpreted as due to a coherent excitation of some orbiting states located near the threshold of the first dissociation limit (3.1 eV) and corresponding to a loosely bound O atom to the NO molecule, rotating about each other. Vredenborg et al. used photoelectron-photoion coincidence method to shed more light onto the multiphoton multichannel dynamics induced by this pump-probe scheme [28]. Unfortu-nately, due to the low count rates associated with the coincidence method, the signal levels were not high enough to address the oscillation issue, though the authors mentioned that oscillations were observed in the high count experiments. Instead, the energy correlation plots were used in order to assess the different pathways responsible for the kinetic energy
distributions measured for NO+ and photoelectrons. The various peaks were assigned to
excitation schemes involving absorption of one or three 400 nm photons followed by one or two 266 nm photons. The correlation plots revealed that the slow photoelectrons were
coin-cident with both NO+ and NO+
2 and that slow NO+ was also produced in coincidence with
a photoelectron of 0.9 eV. The photoelectron spectra exhibit several long-lived structures whose lifetimes were related to the lifetimes of the first excited state or Rydberg states of the parent molecule or of excited states of the parent ion. The photoelectron-photoion couple bearing kinetic energies of 0.9 eV and 0.3 eV, respectively, were assigned to an excitation by
three 400 nm photons (9.3 eV) to a Rydberg state dissociating into NO(A2Σ+) and O(3P )
and subsequent ionisation of the molecular fragment by one photon of 266 nm. The study performed by Form et al. also reports a long lived photoelectron peak around 1 eV and a
strong short lived NO+feature around 0.3 eV overlying a broad long lived structure, though
they were ascribed to a different pathways [27].
The experiments initiated by 400 nm photons reveal a very interesting multiphoton
dy-namics, including an intriguing oscillatory behaviour of the NO+ and the photoelectron
signals and fast and slow dynamics of some NO2 Rydberg states located at 9.3 eV. In order
pump-probe schemes to discriminate between the different competitive processes. Consequently, beside the 400 nm pump scheme and in order to preclude the excitation of the first dissoci-ation region we have used 269 nm pump photons. We have measured both the integrated
and the velocity-resolved NO+ signal as a function of the delay between the pump and
probe laser. The velocity map imaging technique was also used to image the photoelectron
scattering distribution. The kinetic energy distributions for both NO+ and photoelectrons
indicate contributions of several channels involving multiphoton excitation of the parent.
Oscillations were recorded only when using 400 nm photons as pump. A cold NO+ kinetic
energy distribution displaying basically only a zero kinetic energy component was recorded.
Instead, when employing 269 nm as a pump the NO+ and photoelectron kinetic energy
dis-tributions appeared to be very rich, evidencing the presence of multiple excitation channels. The most salient features in both kinetic energy distributions correspond to the excitation of
a NO2 Rydberg state around 9.2 eV correlating to NO(A2Σ+)+O(3P) dissociation channel,
followed by the ionisation of the molecular fragment. The NO+ kinetic energy
distribu-tion presents very complex time dependencies including the signatures of two dissociadistribu-tion dynamics on timescales inferior to 600 fs. Combining the information obtained from the
temporal evolution of the kinetic energy distributions of the NO+ fragment and
photoelec-trons, we were able to reconstruct the picture of the multiphoton dynamics initiated by the 269 nm pump photons.
2
Experimental
The experimental setup we have used to perform time-resolved pump-probe experiments consists in a standard molecular beam machine coupled to a velocity map imaging detector [29].
The pump and probe femtosecond pulses are generated by a 1 kHz Ti:Sapphire regen-erative amplified system (Amplitude Systems) delivering pulses around 806 nm and with a Fourier limited full width at half maximum (FWHM) of about 60 fs. For the experiments presented herein we have employed two different pump-probe schemes. In the first one, a pump pulse around 400 nm was obtained by frequency doubling part of the fundamental laser output, while the remaining of it was frequency tripled to produce radiation around 269 nm. In the second pump-probe scheme, the fundamental’s third harmonic was used as pump beam and the fundamental was directly used as probe beam. The pump and probe pulse energies could be varied continuously, but were typically set around 15 µJ and 10 µJ, respectively, for the first scheme, and around 5 µJ and 50 or 150 µJ, respectively, for the second one. Subsequently, the pump and probe beams were recombined at a small angle onto the molecular beam after being focussed by using either spherical mirrors or thin lenses
of 50-75 cm focal lengths. The maximum intensities were typically set below 1012 W/cm2,
by adjusting the position of the focal point with respect to the molecular beam.
A continuous molecular beam was produced by expanding a mixture of about 8 % NO2
and Ar through a 200 µm diameter nozzle. Two 1 mm diameter skimmers were used to collimate the molecular beam in the interaction region to a diameter of 3 mm. It is well
known that NO2 co-exists in thermodynamical equilibrium with N2O4 and that traces of
NO are always present even in the highest purity NO2 samples. If at 400 nm the N2O4
absorption is about two orders of magnitude lower than that of NO2 molecules, at 269
nm that is the opposite. In order to reduce eventual contributions from the other two molecules to the detected signal, we have used a low total pressure (about 120 mTorr). In
these conditions, NO and N2O4 are present only in trace amounts and do not contribute
to the processes studied here: the NO+
fragments bearing kinetic energy that could be formed in the dissociation of the N2O4, but
only a spot in the center.
For the detection of the charged particles we had employed a velocity map configuration for the electrostatic lenses and an imaging detector consisting of a dual multichannel plate (MCP) coupled to a phosphor screen and to a CCD camera. The ions/photoelectrons created in the pump-probe experiments were extracted perpendicularly to the plane defined by the molecular and the laser beams and detected at the end of 40 cm TOF tube. By gating the voltage of the first MCP we could select the mass of the ionic fragments to be imaged onto the detector. In order to obtain the kinetic energy information, the raw images were Abel inverted and then calibrated to convert from pixel to energy scale. For the calibration, we have used photoelectron images obtained for the multiphoton ionization of Xe at 269 nm. For all the images, the polarizations of both pump and probe beams were set parallel to the detector plane. The resolution of the imaging data was limited by the spectral width of pump and probe pulses which were measured to have a FWHM of maximum 0.060 eV for 806 nm and about 0.030 eV for 400 nm and 269 nm.
3
Results and Discussions
Multiphoton absorption of pump and probe photons leads to both direct ionisation and
dis-sociative ionisation of NO2 molecules. For convenience, in Figure 1 we present a schematic
diagram displaying the most important excitation pathways as well as the neutral and ionic electronic states of the parent and fragments likely to be involved in the dynamics. Hence-forth, we use the following notation to denote a multiphoton pump-probe pathway: (a+b’), where a and b indicate the number of absorbed pump and probe photons, respectively, and the prime designates the probe.
The graphs from Figure 2 display the time dependence of NO+
2 and NO+ transient
signals measured using pump and probe wavelengths centred around 403.7 nm and 269.7
nm, respectively. The NO+2 signal is mainly produced during the cross correlation time and
on the negative side of the decay where the probe pulses are preceding the pump ones. In
turn, significant quantities of NO+are produced on the positive side of the time dependence
where the signal first decays over about 96 fs and then exhibits an intriguing oscillating behaviour over several ps. By fitting the oscillatory signal with a function allowing for oscillation damping, we have inferred an oscillation period of 512 fs and a damping time of
8.78 ps. The NO+ and photoelectron images basically consist of a central spot, indicating
that the transient responsible of the oscillations is produced with almost no kinetic energy. These oscillations are similar to those previously recorded in experiments for which the pump and probe pulse were 400 nm and 266 nm, respectively [26, 27]. In that case, oscillation periods of 600 fs and 830 fs and a much shorter damping time of about 3 ps were obtained
from the time dependence of the zero kinetic energy photoelectrons and NO+ transients.
The difference between the oscillation periods may be due to the difference in the damping time and noise level. In the frequency domain, 512 fs corresponds to an quantum spacing of
about 65 cm−1 and at the first sight, the wavepacket motion associated to these oscillations
could not be associated to any known vibrational or rotational mode of the parent molecule being either too slow or too fast. Form et al. proposed a tentative interpretation of the oscillations in terms of coherent excitation by one 400 nm photon of a set of ’orbiting’ states located near the threshold of the first dissociation limit (3.1 eV) [27]. These ’orbiting’ states
would describe a loosely bound NO2 molecule, with O and NO rotating about each other,
and which would be subsequently dissociatively ionised by two 269 nm probe photons to
were detected by optical double resonance spectroscopy only within a narrow region down
to 60 cm−1 below the dissociation limit [30]. The wavefunctions describing these states with
a very loose geometry should mostly sample the long-range part of the PES. Moreover, it is expected that such a floppy structure could only be reached by excitation of low rotational
states of ground state NO2 as for the high rotational states the centrifugal barrier would
screen off the long-range part of the PES. Bearing this in mind we have undertaken a survey of the oscillation modifications when scanning the pump wavelength across the dissociation threshold, between 408 nm and 396 nm and when changing the rotational temperature of the parent. The result of our measurements is at variance with the proposed explanation as it appears that their presence, period, phase and relaxation are independent of the
pump wavelength for the investigated interval as well as of the NO2 rotational state. This
behaviour is unexpected considering that some of the pump wavelengths are accessing PES regions outside the interval of 60 cm−1below the dissociation limit where the ’orbiting’ states
are located. Besides, for wavelengths longer than 400.5 nm, the total excitation energy is not enough to reach the dissociative ionisation limit of 12.38 eV (value obtained using ref.31 and 32 for the dissociation energy limit and ref. 33 for NO ionisation potential). That is the case for the experiment shown in Figure 2, for which the (1+2’) excitation scheme (labelled A in Fig. 1), suggested by Form at al. [27], provides only 12.27 eV, thus about 0.1 eV less than required. The energy spread due to the pump and probe pulse bandwidths is not enough to compensate the difference. This issue together with additional sources for altering the total excitation energy and its distribution will be thoroughly discussed elsewhere [34].
Based on these results we conclude that in order to explain the origin of the oscillations present in the time dependence of the slow ion and photoelectron signals, a different exci-tation scheme has to be envisaged. Two other options are then considered: the exciexci-tation by two 400 nm photons to a state located at 6.2 eV and the excitation by three 400 nm photons to a state located around 9.3 eV. Because of the high power densities associated with femtosecond pulses, it is extremely difficult to control the number of absorbed pho-tons. Therefore, to separate the two photon excitation from that by three photons, we have used different wavelengths: 200 nm to obtain the equivalent energy of two 400 nm photons and 269 nm to access by two photons the region around 9.3 eV. No regular oscillations
were observed on the NO+ integrated signals recorded with either of the two excitation
wavelengths. The results obtained when using 200 nm photons as pump will not be dis-cussed further as they are not relevant for the purpose of the present paper. Instead, we will concentrate on the excitation scheme employing two photons of 269 nm which allows us to preclude the dynamics around the first dissociation limit as well as the excitation of the states accessible by two 400 nm photons. In this way, we could exclude the influence of the fast non-adiabatic couplings around 400 nm and investigate the dynamics of the highly excited states located around 9.3 eV.
The overall dynamics induced by 269 nm photons and probed by 806 nm photons is
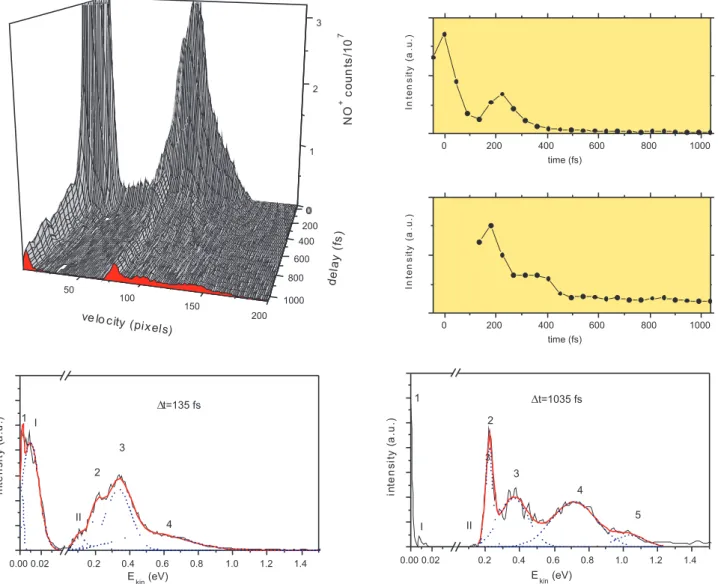
fast, taking place in less than 1 ps. The 2D plot from Figure 3 presents the NO+ kinetic
energy distribution as a function of the pump-probe delay using a time step of 45 fs. In this figure we also display two cuts parallel to the kinetic energy axis at given time delays: 135 fs and 1 ps (panel a and b) and two cuts parallel to the time axis presenting the time profiles for peaks 1 and 2, located at 0 eV and at 0.22 eV, respectively (panel c and d). Hereafter, only these two structures will be discussed in connection with the experiments performed using 400 nm and 266 nm photons in which they were also observed. A more detailed analysis of these peaks as well as of the remaining ones is presented elsewhere [35]. For a comprehensive discussion on the multichannel multiphoton dynamics initiated by 269 nm photons, the reader is referred to the same paper.
From Figure 3 one can remark that the NO+ peak at 0 eV exhibits a complex behaviour
with a first decay over 180 fs followed by a fast rise to a local maximum around 225 fs and another decay over 500-600 fs and then getting to a faux plateau, actually a very slow decay. The corresponding photoelectron peak bearing 0 eV of kinetic energy is also decreasing in time, but it is still the most intense feature at 5 ps as it can be seen in Figure 4 (peak a). This ion-photoelectron couple can be produced by two energetically equivalent excitation schemes: (1+5’) and (2+2’), that provide a total energy of 12.29 eV which is enough to reach the dissociative ionisation threshold at 12.38 eV when accounting for the spectral width of both pump and probe photons of at least 0.1 eV. These excitation schemes employ different intermediate states, around 4.6 eV (one pump photon) and 9.2 eV (two pump photons). It is very likely that these stepping states have different lifetimes, thus leading to the complexity of the kinetic distribution time dependence. The persistence of the peaks at long delays should be due to a long lived Rydberg state accessed by two 269 nm photons or possibly some other excitation schemes may have to be considered. Long lived zero and almost zero kinetic energy photoelectrons were detected by Vredenborg et
al. in coincidence with NO+ and NO+
2, respectively, in the experiment using 400 nm pump
photons and 266 nm probe photons. They were assigned to the energetically equivalent pathway (1×400+2’×266) (labelled A in Fig. 1), also proposed by Form et al. as being
responsible for the oscillating zero kinetic energy NO+ and photoelectron signal.
A close inspection of the NO+ kinetic energy distributions from Figure 3 reveals that
peak 2 located at 0.22 eV also exhibits a complex time dependence. The corresponding photoelectron peak has a kinetic energy of 0.96 eV and it is presented in Figure 4 (peak b). Actually, the peaks appear just outside the 90 fs cross correlation region and extend to the longest delay measured 50 ps. Their sharpness and lifetimes are indicative of a dissociation
process. The Rydberg state populated by two photons of 269 nm dissociates into NO(A2Σ+
v=0) and O(3P) fragments and further absorption of three 806 nm photons will produce
NO+(X1Σ+) and a photoelectron of 0.96 eV (peak b). In fact, the total excitation energy
corresponding to this (2+3’) process can be also reached by absorption of one photon of 269 nm and 6 photons of 806 nm, (1+6’). These pathways (labelled B and C in Fig. 1) are energetically equivalent to the (3×400+1’×266) proposed by Vredenborg et al. to
explain the long lived 0.9 eV photoelectron detected in coincidence with NO+ formed in
the three lowest vibrational states as indicated in their energy correlation plots [28]. An upper limit of 600 fs for the dissociation time was obtained with a resolution of 350 fs, by
Lopez et al. who reported the formation of the neutral NO(A2Σ+) in v=0, 1 and 2 after
three 400 nm photons excitation [23]. It is noteworthy to mention that a similar timescale
dissociation was measured for another NO2 Rydberg state excited by three 375 nm photons
[24]. Because the dissociation time was estimated at 600 fs, one would expect to see that
the NO+signal is building up over this time scale. Instead, as evidenced in Figure 3, the ion
signal exhibits a complex temporal behaviour with a fast decay to a first plateau extending from 270 fs to about 400 fs after which a second plateau is quickly reached around 500-600 fs. Such a complex temporal dependence is indicative of competition between several excitation pathways involving intermediate states with different lifetimes.
Globally, as discussed above and more in detail in ref. 36, it looks very likely that several
pathways are participating at the generation of the long lived NO+ transients labelled 1
and 2 and the corresponding photoelectrons. The knowledge of Franck-Condon transition probabilities from the ground state to the electronic states located at 4.6 eV and 9.2 eV and of their dynamics are required in order to disentangle the relative contributions of
each channel. In the pump step, one 269 nm photon excites NO2 molecules to a state
situated at 4.6 eV, above the first dissociation limit. As calculated by Schinke et al. this region corresponds to the dissociation continua of several electronic states, A2B
C2A
2 [22]. Only transitions to the first two are one photon dipole allowed from the ground
electronic state. In principle, the lifetime of a wavepacket launched by the pump photon should be quite short as it arrives in a continuum. The evolution of this wavepacket will be probed by 806 nm photons. Three probe photons carry the same energy as one 269 nm
photon and would further excite NO2 in the same region as two pump photons, around
9.2 eV, where according to theoretical calculations several high Rydberg states with the following vertical energies are present: 42A
1 at 9.14 eV, 52A1 at 9.24 eV, 32B1 at 9.27 eV,
52A
2 at 9.28 eV and 62A1 at 9.31 eV [36]. On symmetry grounds, any of these 2A1 states
can be accessed if one takes into account the laser bandwidths and the calculation accuracy. Depending on the Rydberg state lifetime, the absorption of three extra probe photons would either ionise the parent or the NO fragment.
At short delays after the pump excitation step, when the breaking N-O bond just starts to stretch out, the absorption of the probe photons will bring the molecule directly above the dissociative ionisation threshold, producing vibrational excited NO+2(X1Σ+). A similar
situation should happen for (1+6’) and (2+3’) excitation schemes if the pump-probe delay is shorter than the intermediate states lifetime. Any of these two mechanisms will provide a total energy of about 13.82 eV which can be shared in the following manner after the dissociative ionisation: a 0 eV photoelectron (peak a in Figure 4) and a total energy of
about 1.45 eV for the fragments, giving a maximum kinetic energy of 0.51 eV for NO+ and
possibly a broad distribution. The lifetime of these peaks is determined by the dissociation time of the intermediate states accessed by either one or two pump photons. A shoulder around 0.52 eV is present in the photoion kinetic energy distributions only on a timescale of less than 270 fs. In turn, the photoelectron peak at 0 eV is long lived due to contributions from other excitation pathways as shown above.
Conversely, at long delays after one pump photon absorption, the breaking bond be-comes so stretched that three probe photons will promote the molecule into the long range region of some linear Rydberg state located around 9.2 eV which will dissociate during the
probe pulse, producing NO(A2Σ+)+O(3P). Additional absorption of three probe photons
will ionise the NO fragments, producing ions and photoelectrons with kinetic energies iden-tical to those obtained by the energeiden-tically equivalent (2+3’) excitation scheme. Besides, one photon of 269 nm access the continua of two different states which may contribute on
different timescales. Therefore, the birth and the lifetime of NO+ and photoelectron peaks
will be determined by the lifetime of these intermediate stepping states. The NO+
vibra-tional distribution should depend on the bent or linear geometry of the intermediate level excited by one (4.6 eV) or two pump photons (9.2 eV). Indeed, this can be seen in the 2D plot from Figure 3 where three structures located at 0.22 eV (v=0) - peak 2, 0.11 eV (v=1) - peak I and 0.01 eV (v=2) - peak II become evident around 135 fs, but decrease over a time scale of about 400 fs, except the first one which stays on. The time profile of peak 1 at 0 eV exhibits a similar dynamics between 135 fs and 400 fs. Consequently, we can conclude that the lifetimes of the intermediate states excited by one pump photon are shorter than 400 fs. The peak 2 at 0.22 eV first decreases, but then reaches a plateau around 500-600 fs suggesting that the dissociation of the Rydberg state is basically complete. At 550 fs, the dependencies on the probe photon intensity of both 0.22 eV and 0 eV peaks correspond to the absorption of two photons indicating that the pathways requiring a high number of probe photons like (1+3’+3’) and (1+6’) became negligible. Consequently, at long delays, peak 2 will be produced only by the (2+3’) pathway in which the ionisation step is satu-rated. On the other hand, the peak 1 at 0 eV should be the result of dissociative ionisation via a (2+2’) pathway involving a long lived Rydberg state. The existence of such a long lived state is also supported by the existence at 5 ps delay of an extremely weak and broad photoelectron structure located around 2 eV (peak c in Figure 4). Vredenborg et al. have
also detected in coincidence with NO+
2 a long lived photoelectron peak bearing about 2 eV
of kinetic energy [28]. This was assigned to the excitation by three photons of 400 nm of a long lived Rydberg state located at 9.3 eV and its subsequent ionisation with one photon of 266 nm. As a final comment, we should emphasis that the temporal behaviours of the peaks not discussed herein are also supporting the conclusions inferred about the lifetime of the states located at 4.6 eV (one 269 nm photon excitation) and of the Rydberg states located at 9.2 eV (two photon 269 nm excitation).
4
Conclusions and Perspectives
In this paper, we have addressed the issue of competitive dynamics induced by the mul-tiphoton regime associated with high power densities femtosecond pulses. Elucidating the
interplay of the different multiphotonic pathways for a molecule like NO2 whose dynamics
is complicated by numerous nonadiabatic interactions becomes a challenging task. Recent time resolved experiments initiated by 400 nm radiation revealed a multiphoton dynamics,
including an intriguing oscillatory behaviour of the NO+ and the photoelectron signals and
fast and slow dynamics of some NO2 Rydberg states. In order to unravel the nature of this
complex dynamics, we have employed two different pump-probe schemes to discriminate between these competitive processes. By scanning the pump wavelength across the disso-ciation threshold, between 408 nm and 396 nm, we have shown that the period, phase and relaxation of the oscillations are independent of the pump wavelength in the investigated
interval of about 700 cm−1. Such a result is unexpected and at variance with the proposed
explanation based on the coherent excitation of orbiting states located in a narrow region
(60 cm−1) below the first dissociation limit. No oscillations are present when drastically
changing the pump wavelength to 269 nm. We believe that these oscillations cannot be pro-duced by a (2+1’) excitation scheme (labelled A in Fig. 1), but should arise from a (2+2’) process and that they probably represent a quantum beat signature. This hypothesis will be discussed more in detail in a future paper [34].
We have employed time-resolved ion and photoelectron imaging technique to extract energetic information characterising the photodissociation/photoionisation fragments initi-ated by 269 nm (pump) and 806 nm (probe) photons and to infer temporal information on their dynamics. Both the photoions and photoelectrons exhibit very rich kinetic energy dis-tributions with a complex dynamics taking place within less than 600 fs after pump photon
excitation. At short delays, most of the NO+ peaks exhibit faux plateaux, that we have
correlated to contributions of several multiphoton excitation schemes providing the same energy, but involving different intermediate stepping states. The most salient feature of the
ion kinetic energy distributions corresponds to a sharp NO+peak at 0.22 eV correlating to a
photoelecton of 0.96 eV. We have attributed the generation of this photoion-photoelectron
couple to the excitation of NO2 ground state molecules to a Rydberg state located around
9.2 eV which dissociates into NO(A2Σ+) and O(3P) fragments. Around 500-600 fs these
structures become stationary in agreement with the dissociation time of 600 fs measured by Lopez et al. for the dissociation of a Rydberg state excited by three photons of 400 nm, i.e. 9.29 eV. We have also evidenced the existence of a long lived Rydberg state which
is responsible for the long lived zero kinetic energy NO+ and photoelectron produced by
a (2+2’) pathway. On the other hand, the time dependencies of these 0 eV and 0.22 eV
NO+ peaks reveal the competition between two energetically equivalent pathways involving
one or two 269 nm photons (labelled B and C in Fig. 1). We have inferred a dissociation time of less than 400 fs for the electronic states accessed by the first pathway. A very interesting result of these experiments was the observation of the long range dynamics of
the state accessed by one 269 nm photon. This was possible by mapping with three probe photons the long range part of this state onto the dissociation region of the Rydberg state.
Another three probe photons enabled to detect this dynamics by ionisation of NO(A2Σ+)
fragment produced within the laser pulse. For complete disentanglement of these pathways and accurate measurement of the relaxation time, additional experiments are required using coincidence detection or alternatively, a change of the probe wavelength.
Acknowledgments
We thank Prof. B. J. Whitaker and Dr. B. Chatel for their contributions to the com-pletion of this research. The work was financially supported through the ANR-COCOMUV grant and a ”Plan Etat-R´egion: Spectrocopies Optiques Ultimes” funding scheme from R´egion Midi-Pyr´en´ees. We gratefully acknowledge the European Union for the award of a Intra-European Marie Curie fellowship to one of the authors (R.C.) through the con-tract MOLCOTUV-041732. JBH thanks the Acad´emie des Sciences for the postdoctoral fellowship.
References
[1] Busch G E and Wilson R, 1972, J. Chem. Phys., 56, 3626. [2] Delon A and Jost R, 1991, J. Chem. Phys., 95, 5686.
[3] Delon A, Heilliette S and Jost R, 1998, Chem. Phys., 238, 465.
[4] Volkers E A, Bulthuis J, Stolte S, Jost R, Wehres N and Linnartz H, 2007, J. Mol.
Spectrosc., 245, 1.
[5] Bezel I, Stolyarov D and Wittig C, 1999, J. Phys. Chem. A, 103, 10268.
[6] Kirmse B, Abel B, Schwarzer D, Grebenshchikov S Yu and Schinke R, 2000, J. Phys.
Chem. A, 104, 10374.
[7] Mahapatra S, K¨oppel H, Cederbaum L S, Stampfuss O and Wenzel W, 2000, Chem.
Phys., 259, 211.
[8] Sanrey M and Joyeux M, 2007, J. Chem. Phys., 126, 074301.
[9] Kurkal V, Fleurat-Leussard P and Schinke R, 2003, J. Chem. Phys., 119, 1489. [10] Reid S A and Reisler H, 1996, Ann. Rev. Phys., 47, 495.
[11] Ahmed M, Peterka D S, Bracker A S, Vasyutinskii O S and Suits A G 1999, J. Chem.
Phys., 110, 4115;
[12] Brouard M, Cireasa R, Clark A P, Preston T J and Vallance C, 2006, J. Chem. Phys., 124, 064309; and references therein.
[13] Wilkinson I and Whitaker B J, 2008, J. Chem. Phys., 129, 145312. [14] Santoro F and Petrongolo C, 1999, J. Chem. Phys., 110, 4419.
[16] Knepp P T, Terentis A C and Kable S H, 1995, J. Chem. Phys., 103, 194.
[17] Zacharias H, Geilhaupt M, Meier K and Welge K H, 1981, J. Chem. Phys., 74, 218. [18] Brooks C, Hancock G and Saunders M, 2007, Phys. Chem. Chem. Phys., 9, 5232. [19] Ionov S I, Brucker G A, Jacques C, Chen Y and Wittig C 1993, J. Chem. Phys., 99,
3420.
[20] Stolyarov D, Polyakova E, Bezel I and Wittig C 2002, Chem. Phys. Lett., 358, 71. [21] Tsuji K, Ikeda M, Awamura J, Kawai A and Shibuya K, 2003, Chem. Phys. Lett., 374,
601.
[22] Schinke R, Grebenshchikov S Yu and Zhu H, 2008, Chem. Phys., 346, 99; and references therein.
[23] L`opez-Martens R B, Schmidt T W and Roberts G, 1999, J. Chem. Phys., 111, 7183. [24] Davies J A, LeClaire J E, Continetti R E and Hayden C C, 1999, J. Chem. Phys., 111,
1.
[25] Davies J A, Continetti R E, Chandler D W and Hayden C C, 2000, Phys. Rev. Lett., 84, 5983.
[26] Epink A T J B, Whitaker B J, Gloague E, Soep B, Coroiu A M and Parker D H 2004,
J. Chem. Phys., 121, 7776.
[27] Form N T, Whitaker B J, Poisson L and Soep B, 2006, Phys. Chem. Chem. Phys., 8, 2925.
[28] Vredenborg A, Roeterdink W G and Janssen M H M, 2008, J. Chem. Phys., 128, 204311.
[29] Epink A T J B and Parker D H, 1997,Rev. Sci. Instrum., 68, 3477.
[30] Delon A, Reiche F, Abel B, Grebenshchikov S Yu and Schinke R, 2000, J. Phys. Chem.
A, 104, 10374.
[31] Jost R, Nyg ˙ard J, Pasinski A and Delon A, 1996, J. Chem. Phys., 105, 1287. [32] Butenhoff T J and Rohlfing E A, 1993, J. Chem.Phys.,98, 5469.
[33] Reiser G, Habenicht W, Muller-Dethlefs K and Sclag E W, 2001, Chem. Phys. Lett., 152, 119.
[34] Hamard J B, Cireasa R, Chatel B, Girard B, Blanchet V, Whitaker B J, in preparation [35] Cireasa R and Blanchet V, submitted to J. Chem. Phys.
0 2 4 6 8 10 12 14 0 2 4 6 8 10 12 14 C B A X 1 + 0.96 eV X 2 A 1 e -0.62 eV NO 2 + Rydberg states A 2 B 2 D 2 B 2 NO(X 2 ,v=0)+O( 3 P) NO(X 2 ,v=0)+O( 1 D) NO(A 2 + ,v=0)+O( 3 P) NO + (X 1 + ,v=0)+O( 3 P) E n e r g y ( e V )
Figure 1: Schematic representation of fragmentation and ionisation pathways discussed in
the text and of the relevant energy levels of NO2, NO+2, NO and NO+. The pathways are
labelled A, B and C. The photons are represented as arrows whose colours (online version) and sizes depend on the wavelength: dark grey (red) for 806 nm, light grey (cyan) for 403 nm and black (violet) for 269 nm. The dashed lines indicate the first dissociation limit, the ionisation and dissociative ionisation limits. The black double arrows correspond to the kinetic energy release of the photoelectron and of the fragments for the dissociation process C.
-500 0 500 1000 1500 2000 2500 3000 0 1 N O + n o r m a l i se d si g n a l delay (fs) 0 1 N O 2 + n o r m a l i se d si g n a l
Figure 2: The total integrated NO+
2 and NO+ signals recorded as a function of the
pump-probe delay. A positive delay corresponds to the situation where the 403.7 nm pulse acts as pump and the 269.7 nm one acts as probe. The results of the transient fits are shown as solid coloured lines (online version): the (blue) solid line represents the total fit, the dashed (green) line represents the cross correlation signal, which was measured to be 180 fs, the dotted (red) line describes an exponential decay with a time constant of 96 fs and the violet one represent a function describing the oscillating component with a rising time of 55 fs, an oscillation period of 512 fs and damping time of 8782 fs.
0 200 400 600 800 1000 50 100 150 200 0 1 2 3 de lay (fs ) N O + c o u n ts /1 0 7
ve lo city (pixels) 0 200 400 600 800 1000
In te n s it y (a .u .) time (fs) 0 200 400 600 800 1000 In te n s it y (a .u .) time (fs) 0.00 0.02 0.2 0.4 0.6 0.8 1.0 1.2 1.4 II I 4 3 2 Ekin(eV) in te n s it y (a .u .) Dt=135 fs 1 0.00 0.02 0.2 0.4 0.6 0.8 1.0 1.2 1.4 5 3 1 I II 2 3 4 Dt=1035 fs in te n s it y (a .u .) Ekin(eV)
Figure 3: NO+ kinetic energy distributions recorded as a function of the delay between 269
nm and 806 nm pulses with a step of 45 fs. The kinetic energy distributions were obtained by Abel inversion of the velocity map images. The transients discussed in the text are labelled 1, 2, I and II. Four one dimensional cuts were performed at constant energy or time. (a) The time profile of the peak 1. (b) The time profile of the peak 2. (c) The kinetic energy distribution measured at ∆t=135 fs. (d) The kinetic energy distribution measured at ∆t=1035 fs.
0.0 0.2 0.5 1.0 1.5 2.0 2.5 t=150 f s t=5000 f s P h o t o e l e ct r o n n o r m a l i ze d si g n a l E ki n (eV) a b c
Figure 4: Photoelectron kinetic energy distributions measured at two pump-probe delays: ∆t=150 fs and ∆t=5000 fs. The peaks discussed in the text are labelled a, b and c.